. 2018 Oct 23;9(11):1088.
doi: 10.1038/s41419-018-1121-9.

Progressive waves of IL-1β release by primary human monocytes via sequential activation of vesicular and gasdermin D-mediated secretory pathways

Affiliations

Progressive waves of IL-1β release by primary human monocytes via sequential activation of vesicular and gasdermin D-mediated secretory pathways

Claudia Semino et al. Cell Death Dis. .

Abstract

IL-1β is an essential cytokine, but its release needs to be strictly controlled to avoid severe inflammatory manifestations. Lacking a signal sequence, IL-1β does not follow the endoplasmic reticulum-Golgi route. Several pathways have been proposed to mediate its release. One involves the translocation of pro-IL-1β into intracellular vesicles of lysosomal origin that eventually fuse with the plasma membrane. Another exploits pores formed on the plasma membrane upon proteolytic cleavage of gasdermin D (GSDMD). Here we investigated how primary monocytes-the main source of IL-1β in humans-control IL-1β release in response to pro-inflammatory stimuli of increasing intensity and found that two different routes are induced depending on the strength of activation. Triggering of Toll-like receptor 4 (TLR4) by LPS induces slow IL-1β release through LAMP2A+ vesicles. In contrast, the simultaneous stimulation of TLR2, TLR4 and TLR7/8 drives high levels of ROS, GSDMD cleavage and faster IL-1β secretion. Drugs blocking ROS production prevent GSDMD cleavage supporting a role of oxidative stress in GSDMD-mediated secretion. Singly stimulated monocytes undergo apoptosis, whereas triple stimulation triggers pyroptosis, which might amplify inflammation. In both cases, however, IL-1β secretion precedes cell death. Inhibition of caspases 4/5 prevents GSDMD cleavage and pore-mediated secretion, but not vesicular release. The two pathways also display other distinct pharmacologic sensitivities that reflect the underlying mechanisms. Remarkably, single TLR4 stimulation is sufficient to activate massive, GSDMD-mediated IL-1β secretion in monocytes from patients affected by Cryopyrin Associated Periodic Syndrome (CAPS), an autoinflammatory disease linked to NLRP3 mutations. The exaggerated sensitivity to activation correlates with high basal ROS levels in CAPS monocytes. In conclusion, the vesicular pathway limits IL-1β release upon low pathogen load while stronger stimulation or concomitant cell stress induce instead uncontrolled secretion via GSDMD leading to detrimental inflammatory manifestations.


Conflict of interest statement

The authors declare that they have no conflict of interest.

Figures

Fig. 1
Fig. 1. Costimulation of TLR2, TLR4, and TLR7/8 induces ROS production, GSDMD cleavage and IL-1β hypersecretion.
a Intracellular ROS quantified by H2DCF-DA staining in monocytes unstimulated or stimulated for 1 h as indicated. N = 3. Data are expressed as RFU. b, c Monocytes from healthy donors were incubated with LPS alone or with LPS, R848, Zymosan (LRZ) for the indicated times (hours). (b) Time course of IL-1β secretion, quantified by ELISA. N = 6. Data are expressed as ng/ml (mean ± SEM). (c) One representative Western blot analysis (out of 3 performed) of intracellular and extracellular IL-1β at various times of exposure to LPS or LRZ. d One representative Western blot (out of 5 performed) showing GSDMD cleavage in cell lysates from monocytes cultured 6 h untreated (Unt) or with LRZ or LPS. Arrowhead indicates the p30 N-terminal domain of GSDMD. GAPDH served as loading control. e Secretion of IL-1β by monocytes stimulated with LRZ or LPS in the presence or absence of DPI (20 μM) or As2O3 (1 μM) as indicated. Data are expressed as the percent of IL-1β secreted by LPS or LRZ stimulated monocytes exposed to DPI or As2O3 relative to secretion without drugs. f, g Western blot analyses of GSDMD cleavage in monocytes stimulated 6 h with LRZ or LPS in the presence or absence of DPI (20 μM) or As2O3 as indicated. f One representative western blot out of 3 performed; arrowheads indicate p30 GSDMD. g Ratio of GSDMD p30/GAPDH obtained by quantitative densitometry of the 3 western blots like the one shown in f (mean ± SEM). h, i Western blot analyses of GSDMD cleavage in monocytes stimulated 6 h with LRZ or LPS in the presence or absence of Ac-YVAD, Z-LEVD or Ac-YVAD plus Z-LEVD (Y + L). h One representative western blot out of 3 performed; i Ratio of GSDMD p30 /GAPDH obtained by quantitative densitometry of the 3 western blots like the one shown in h (mean ± SEM). j Caspase dependency of IL-1β secretion. Monocytes were stimulated with LPS or LRZ in the presence or absence of Ac-YVAD, Z-LEVD or Ac-YVAD plus Z-LEVD (Y + L) and analyzed as above. Data are expressed as in e. Data information: One-way ANOVA (a, b, h, i) or Unpaired t-test (e, g) were used for significance (*P < 0.05, **P < 0.01, ***P < 0.001)
Fig. 2
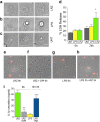
Fig. 2. Caspase dependency of LRZ-induced IL-18 secretion
a, b IL-18 (a) and TNF-α (b) secreted in supernatants of monocytes stimulated 18 h with LRZ or LPS in the presence or absence of Ac-YVAD, Z-LEVD, or both (Y + L), as indicated (N = 3). Data are expressed as pg/ml (a) or ng/ml (b), mean ± SEM. Data information: One-way ANOVA was used for significance (*P < 0.05, **P < 0.01)
Fig. 3
Fig. 3. Multiple stimulation induces pyroptosis whereas single stimulation induces apoptosis
a–c Monocytes were exposed to medium alone or supplemented with LPS or LRZ and analyzed by live cell microscopy for 6 h (N = 3). Images were taken every 3 min. Scale bar, 5 μm. a–b Morphologic changes of representative LRZ-stimulated (a) LPS-stimulated (b) or unstimulated (UNT, c) monocytes. Little if any morphologic changes are seen in unstimulated monocytes within this time frame. Timestamps are indicated in each image. d Quantification of LDH in supernatants from untreated (Unt), LPS or LRZ-stimulated monocytes. N = 6. Data are expressed as percent of released LDH vs. total LDH, mean ± SEM. e-h Live cell microscopy images of propidium iodide (PI) staining of monocytes exposed 6 h to LRZ in the absence (e) or presence of DPI (f), or to LPS (g), or for 3 h to LPS alone followed by 3 additional h with also R848 and zymosan (RZ) (h). (N = 3). i IL-1β secreted by cells stimulated 6 h with LRZ, in the presence or absence of DPI, or 6 h with LPS, or 3 h with LPS followed by 3 h with R848 and zymosan. Data are expressed as ng/ml (mean ± SEM). N = 3. Data information: In (d) One-way ANOVA and in (i) Unpaired t-test was used for significance (*P < 0.05, **P < 0.01, ***P < 0.001)
Fig. 4
Fig. 4. Subcellular localization of IL-1β and LAMP2A in LPS and LRZ-stimulated monocytes.
a Confocal microscopy of representative monocyte stimulated 6 h with LPS (upper panel) or LRZ (lower panel), stained for IL-1β and LAMP2A as indicated (N = 6). Scale bar, 5 μm. One single stack of Z-stack series is shown (Z = 4 for LPS and Z = 5 for LRZ). b Left-hand panels: TIRF microscopy of representative monocyte stimulated with LPS (upper panel) or LRZ (lower panel) and stained as in a (N = 6). Penetration depth = 110 nm. Scale bar, 5 μm. Right-hand panel: quantification of LAMP2A+/IL-1β+ vesicles found by TIRF analysis, in 50 LPS or LRZ stimulated monocytes, using Laplacian plugins for the extraction of image features (ImageJ) (N = 6), mean ± SEM. c Direct stochastic optical reconstruction microscopy (dSTORM) of IL-1β and LAMP2A as indicated (N = 4). A representative LPS (upper panel) and LRZ-stimulated cell (lower panel) is shown. Scale bar, 2μm. Insets show magnifications to better highlight structures where IL-1β and LAMP2A molecules are close to each other. d Cross-correlation (C) between the two channels (green and red, corresponding to IL-1β and LAMP2A fluorescence) as a function of distance. Six cells from 4 independent experiments were analyzed. For each cell, 10 representative ROIs (2 × 2 μm2) were chosen in the peripheral region of the cells for the analysis. The closeness of LAMP2A and IL-1β molecules is not random (C > 1) and increased co-clustering at the plasma membrane is higher in LPS-stimulated monocytes (y axis, amplitude of the cross correlation). Error bars indicate standard error of C on each ROI in the individual cell. e The image shows a representative Western blot (out of 3 performed) comparing the intracellular pools of LAMP2A and GAPDH in monocytes stimulated for 3 or 6 h with LPS or LRZ. f Surface expression of LAMP2A increases upon a 6 h stimulation with LPS relative to LRZ (monocytes from a representative subject out of 3 tested are shown). Data information: In b (right-hand panel) data are expressed as Mean ± SEM. Unpaired t-test was used for significance (***P < 0.001)
Fig. 5
Fig. 5. IL-1β secretion by LPS and LRZ-stimulated monocytes is differently modulated by drugs interfering with specific cell processes.
a The cartoon summarizes the targets of the drugs used in these experiments. Bafilomycin (BafA1) blocks the proton influx into endolysosomes, cytocalasin D (cytoD) and latrunculin B (latrB) inhibit actin polymerization. All these drugs induce secretory lysosomes exocytosis,,. 17AAG is an HSP90 inhibitor reported to prevent IL-1β translocation and secretion. Punicalagin stabilizes lipids in the plasma membrane and inhibit IL-1β secretion in mouse macrophages. b IL-1β secreted by LPS and LRZ-stimulated monocytes, untreated or treated with BafA1 (BAF), cytocalasin D (CytoD), latrunculin B (Lat), punicalagin (Pun), 17AAG, quantified by ELISA. N = 6. c, d LPS or LPS + 17AAG-treated monocytes were co-stained with anti LAMP2A and anti IL-1β Ab and analyzed by TIRF microscopy (penetration depth 110 nm) after 6 h of incubation (N = 3). (c) Representative LPS and LPS + 17AAG-treated monocytes are shown. Scale bar, 5 μm. d TIRF quantification of the number of LAMP2A+/IL-1β+ vesicles found in monocytes stimulated with LPS or LPS + 17AAG, obtained as in Fig. 4b (N = 3). Data information: In b, d Data are expressed as ng/ml, mean ± SEM. Unpaired t-test was used, and the significance compared with untreated cells is indicated (**P < 0.01, ***P < 0.001)
Fig. 6
Fig. 6. LPS alone is sufficient to trigger GSDMD cleavage and rapid IL-1β secretion in monocytes from CAPS patients
a Intracellular ROS accumulation was quantified by H2DCF-DA staining in unstimulated monocytes (Mo) from two healthy donors (Ctrl Mo) and two CAPS patients. The data are expressed as relative fluorescence units (RFU), and confirmed previous data obtained on a larger number of CAPS and control monocytes,. b, c Kinetics of IL-1β secretion in LPS or LRZ stimulated monocytes from healthy donors (Ctrl Mo) (b) or patients (CAPS Mo) (c) quantified by ELISA. Average of 5 experiments ± SEM. d Accumulation of pro-IL-1β in monocytes from CAPS patients or healthy donors. A representative Western blot out of 3 performed is shown. e Confocal [upper panel, one single stack of Z-stack series is shown (Z = 6)] and TIRF (lower panel, penetration depth = 110 nm) microscopy analyses of monocytes from a representative CAPS patient (out of three examined) stimulated for 5 h with LPS. Scale bar, 5μm. f IL-1β secreted by LPS-stimulated monocytes from CAPS patients, incubated in the absence or presence of latrunculin B (Lat), punicalagin (Pun), Ac-YVAD or Z-LEVD as indicated, was quantified by ELISA. Data are expressed as percent of IL-1β secretion relative to untreated cells. N = 6, mean ± SEM. g Live cell microscopy images of monocytes from healthy donors (Ctrl Mo) or CAPS patients (CAPS Mo) exposed for 6 h to LPS or LRZ as indicated. CAPS monocytes stimulated with LRZ died in the first 3 h from stimulations and detached from the well (not shown). N = 3 h This representative Western Blot (out of 3 performed) compares GSDMD cleavage and total levels in cell monocytes from CAPS patients or healthy donors, after 5 h with or without LPS. Data information: In a, f Unpaired t-test was performed, and the significance compared with untreated cells is indicated (*P < 0.05, **P < 0.01)
Fig. 7
Fig. 7. Routes of IL-1β secretion in human monocytes Two different mechanisms for IL-1β secretion can be activated in primary human monocytes depending on the strength of the inflammatory stimulus.
a In monocytes from healthy donors (Healthy Mo), small trauma or low pathogen load (LPS) activates a pathway involving secretory lysosomes that allows slow release of IL-1β, followed by apoptotic cell death that switches off the inflammatory response. Differently, a stronger stimulus (LRZ) results in gasdermin D cleavage with generation of the N-terminal domain that assembles in N-rings with formation of pores through which IL-1β can be externalized: this pathway of secretion is followed by pyroptosis, with membrane ruptures through which DAMPs can leave cells, further amplifying the inflammatory response. b Monocytes from CAPS patients (CAPS Mo) contain higher level of ROS at baseline that healthy monocytes. This condition enables the activation of the GSDMD-mediated IL-1β secretory pathway and the consequent hypersecretion of IL-1β even after small trauma or low pathogen load (LPS). Thus, hyperstimulated healthy monocytes and mildly stimulated CAPS monocytes use the same GSDMD-mediated pathway of IL-1β secretion

Similar articles

Cited by

References

    1. Dinarello CA. Interleukin-1 and the pathogenesis of the acute-phase response. N. Engl. J. Med. 1984;311:1413–1418. doi: 10.1056/NEJM198411293112205. - DOI - PubMed
    1. Dinarello CA. A clinical perspective of IL-1β as the gatekeeper of inflammation. Eur. J. Immunol. 2011;41:1203–1217. doi: 10.1002/eji.201141550. - DOI - PubMed
    1. Manthiram K, Zhou Q, Aksentijevich I, Kastner DL. The monogenic autoinflammatory diseases define new pathways in human innate immunity and inflammation. Nat. Immunol. 2017;18:832–842. doi: 10.1038/ni.3777. - DOI - PubMed
    1. Martinon F, Burns K, Tschopp J. The inflammasome: a molecular platform triggering activation of inflammatory caspases and processing of proIL-beta. Mol. Cell. 2002;10:417–426. doi: 10.1016/S1097-2765(02)00599-3. - DOI - PubMed
    1. Rabouille C, Malhotra V, Nickel W. Diversity in unconventional protein secretion. J. Cell. Sci. 2012;125:5251–5255. doi: 10.1242/jcs.103630. - DOI - PubMed

Publication types

MeSH terms