. 2018 Oct 23;9(1):4408.
doi: 10.1038/s41467-018-06557-8.

Discovery of RNA-binding proteins and characterization of their dynamic responses by enhanced RNA interactome capture

Affiliations

Discovery of RNA-binding proteins and characterization of their dynamic responses by enhanced RNA interactome capture

Joel I Perez-Perri et al. Nat Commun. .

Abstract

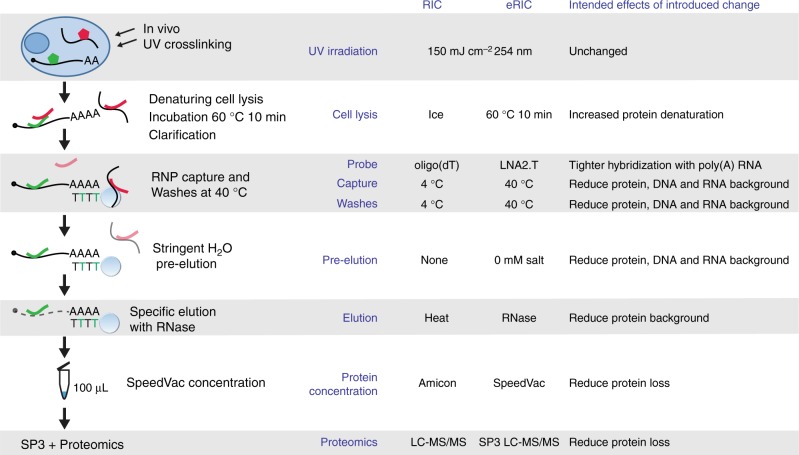
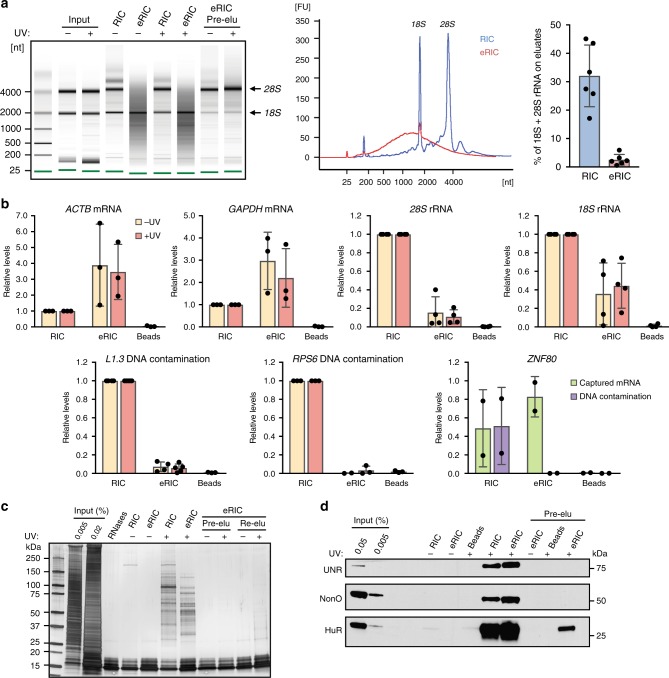
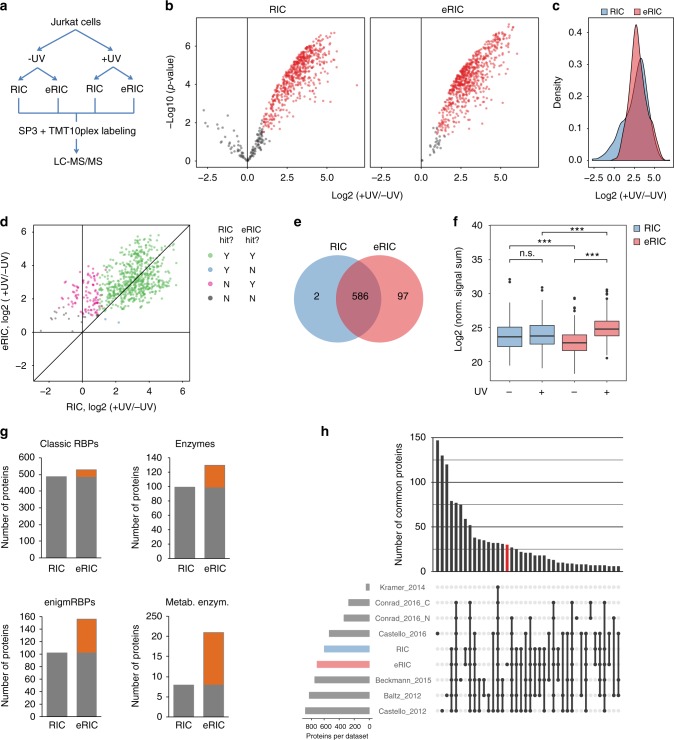
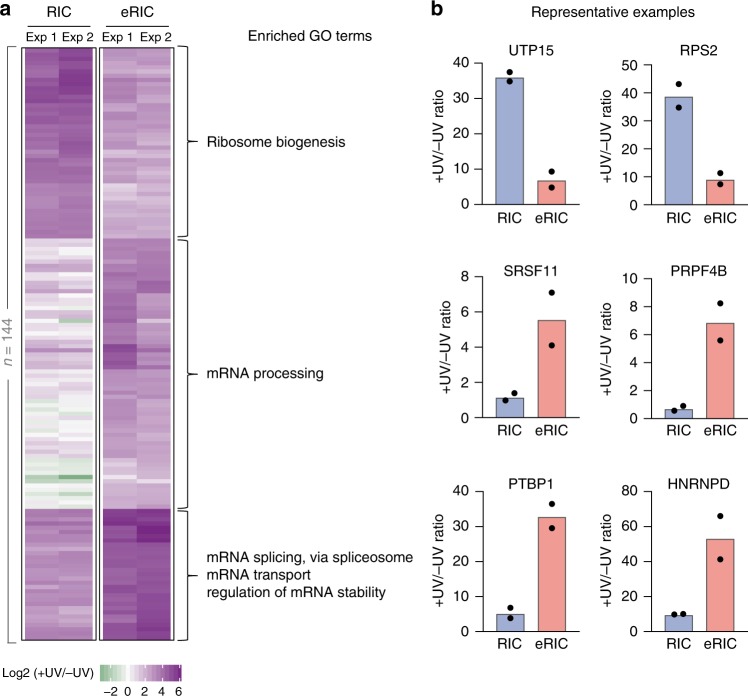
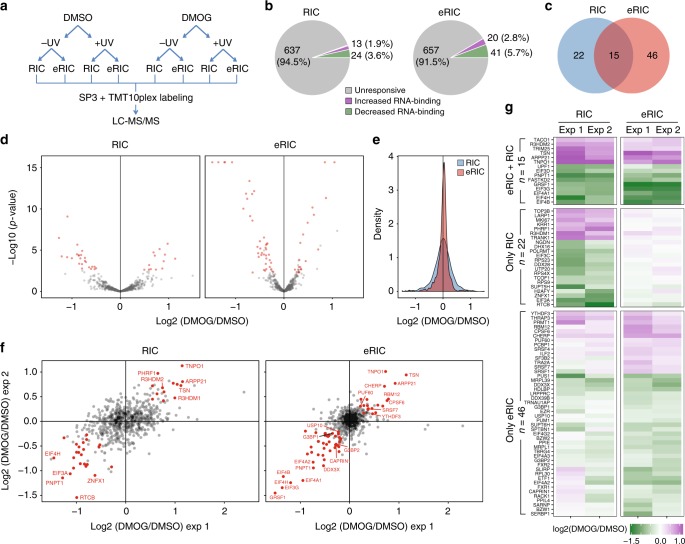
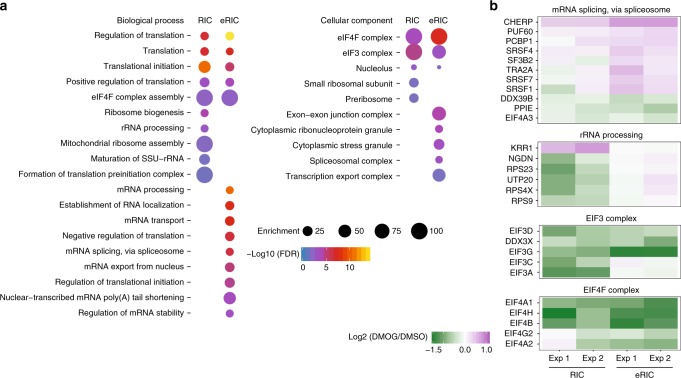
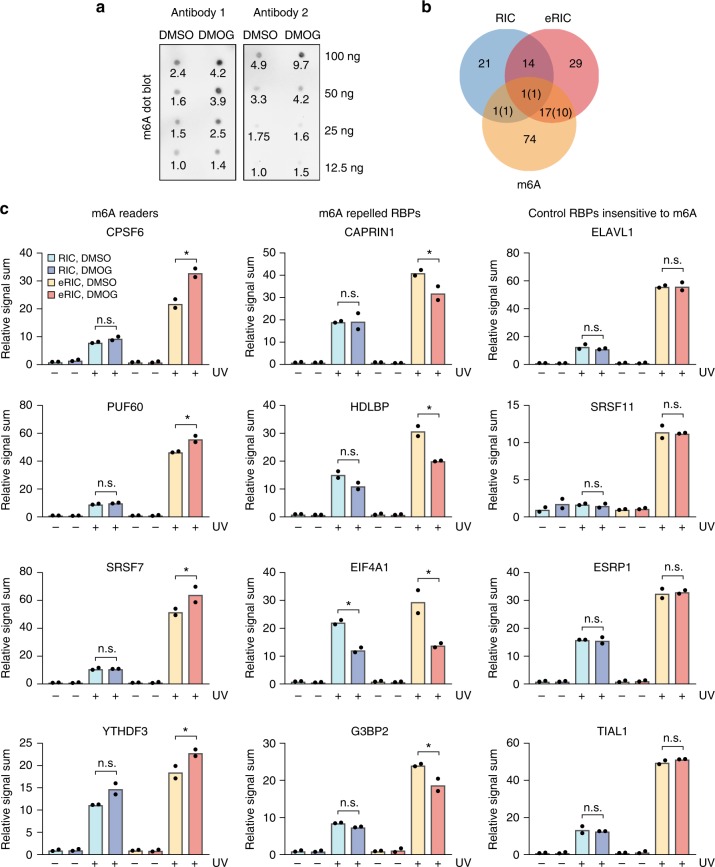
Following the realization that eukaryotic RNA-binding proteomes are substantially larger than anticipated, we must now understand their detailed composition and dynamics. Methods such as RNA interactome capture (RIC) have begun to address this need. However, limitations of RIC have been reported. Here we describe enhanced RNA interactome capture (eRIC), a method based on the use of an LNA-modified capture probe, which yields numerous advantages including greater specificity and increased signal-to-noise ratios compared to existing methods. In Jurkat cells, eRIC reduces the rRNA and DNA contamination by >10-fold compared to RIC and increases the detection of RNA-binding proteins. Due to its low background, eRIC also empowers comparative analyses of changes of RNA-bound proteomes missed by RIC. For example, in cells treated with dimethyloxalylglycine, which inhibits RNA demethylases, eRIC identifies m6A-responsive RNA-binding proteins that escape RIC. eRIC will facilitate the unbiased characterization of RBP dynamics in response to biological and pharmacological cues.


Conflict of interest statement

The authors declare no competing interests.

Figures

Fig. 1
Fig. 1
Schematic representation of the eRIC method. RBPs are crosslinked to RNAs in vivo by irradiating cells with 254 nm UV light. Crosslinked proteins are isolated under denaturing conditions employing a LNA-modified probe and stringently washed under high temperature conditions using high salt concentrations first (to eliminate contaminants primarily based on hydrophilic protein–protein interactions) and low salt concentrations afterwards (to eliminate contaminants based on nucleic acid base pairing). Captured proteins are then eluted with RNase, concentrated to 100 μL to apply the Single‐Pot Solid‐Phase‐enhanced Sample Preparation protocol (SP3, see main text: Analysis of RBPs identified by RIC versus eRIC), and identified by mass spectrometry. A comparison with the previous RIC protocol is included on the right. Green pentagon/line: native/denatured RBP; in red: contaminant protein. Black line with stretch of As: poly(A) RNA. Black line: contaminating non-poly(A) RNA/DNA. Light blue circle with stretch of T: capture probe coupled to magnetic beads (black and green Ts symbolize the alternation of DNA and LNA nucleotides; note that capture probe has actually 20 bases). LC-MS/MS: liquid chromatography–tandem mass spectrometry
Fig. 2
Fig. 2
eRIC captures polyadenylated RNA and covalently crosslinked proteins with high specificity. a, b Nucleic acids isolated by eRIC, RIC, or using uncoupled beads along the eRIC protocol on irradiated material (“Beads”) were analyzed using a 6000 Pico bioanalyzer (a) or by RT-qPCR (b). Note that the pre-elution step (“Pre-elu”) incorporated in eRIC leads to an effective removal of rRNAs, specially the 28S rRNA, without compromising the capture of poly(A) RNAs. a Representative result are shown in the left and middle panels; data on the right panel correspond to mean and standard deviation (s.d.) from six biologically independent experiments. −UV non-irradiated controls, +UV irradiated samples, [nt] length of RNA in number of nucleotides, [FU] fluorescence units. b Data correspond to mean and s.d. from at least three biologically independent experiments except for ZNF80 (two experiments). c, d Isolated proteins were separated by SDS-PAGE and silver-stained (c) or analyzed by western blot with antibodies to the positive control RBPs UNR, NonO, and HuR (d). The lane “RNases” contains a dilution of RNases A and T1. Note that lower bands in silver staining correspond to these enzymes. Re-elu heat elution performed after RNAse treatment. Note that a minor fraction of HuR appears to be associated with non-polyadenylated RNAs
Fig. 3
Fig. 3
Superior performance of eRIC in RBP detection. a Scheme of the workflow of the direct comparative analysis of eRIC and RIC. Proliferating Jurkat cells were irradiated or not, lysed, and lysates equally split for eRIC or RIC analyses. Concentrated eluates were subjected to SP3, TMT-labeled, and analyzed by MS. b Volcano plots displaying the log2-fold change (FC) in irradiated (+UV) over non-irradiated (−UV) samples (x axis) and the p values (y axis) of the proteins identified by eRIC (right) and RIC (left). Proteins with FDR < 0.05 (moderated t test) and FC ≥ 2 were considered significantly enriched and are depicted in red. c Density of log2-FC between irradiated and non-irradiated samples of proteins identified by eRIC (red) and RIC (blue). Note the lack of enrichment over background of many proteins in RIC but not eRIC samples (leading left area of the blue curve). d Scatter plot comparing the averaged log2-FC in irradiated over non-irradiated samples of proteins detected by eRIC (y axis) and RIC (x axis). Hits recovered by both eRIC and RIC are displayed in green, hits unique to eRIC or RIC in magenta and blue, respectively, and proteins identified as background by both methods are shown in black. e Venn diagram comparing the number of hits identified by eRIC and RIC. f Normalized signal sum in irradiated and non-irradiated samples of the 97 hits exclusively identified by eRIC. ***p < 0.001 (Wilcoxon signed-rank test); n.s.: not significant. Center lines represent medians, box borders represent the interquartile range (IQR), and whiskers extend to ±1.5× the IQR; outliers are shown as black dots. g Number of known RBPs, enzymes, enigmRBPs, and metabolic enzymes identified by eRIC and RIC. Orange boxes represent the hits exclusive to eRIC. h UpSet plot showing the number of common proteins (i.e., intersections) between the eRIC and RIC experiments presented here or in previously published RBP datasets. Conrad_2016_C and _N refers to cytoplasmic and nuclear datasets, respectively. Data correspond to two biologically independent experiments
Fig. 4
Fig. 4
Differential RBP enrichment with eRIC. a Unsupervised clustering and GO analysis of proteins whose enrichments in irradiated (+UV) over non-irradiated (−UV) samples differ significantly between eRIC and RIC (FDR < 0.05 (moderated t test) and FC > 2, 144 proteins). Three main clusters are observed that comprise RBPs preferentially recovered by RIC (top) or eRIC (middle and bottom). Note that proteins in the middle and bottom clusters markedly differ in their enrichment over background in RIC samples. Biological process GO terms enriched for each cluster are shown. Upper: “ribosome biogenesis” (−log10 (p value) = 39.95; enrichment = 40.6), middle: “mRNA processing” (18.36; 14.85), bottom: “mRNA splicing via spliceosome” (33.48; 52.4), “mRNA transport” (8.52; 30.85) and “regulation of mRNA stability” (4.04; 17.08) (Fisher’s Exact with FDR multiple test correction). b Fold change in irradiated over non-irradiated samples of representative example RBPs captured by eRIC and RIC. Data correspond to two biologically independent experiments (a, b); in b, data are shown as mean
Fig. 5
Fig. 5
Superior performance of eRIC in comparative analyses of RBP responses. a Experimental design: Jurkat cells were incubated for 6 h with 0.5 mM DMOG or the vehicle DMSO. After irradiation, cells were lysed and lysates equally split for eRIC or RIC analyses. n = 2 independent experiments. b Pie charts summarizing the response of the RNA-bound proteomes to DMOG treatment identified by eRIC (right) or RIC (left). The number and percentage of proteins displaying constant (gray), increased (green), or decreased (violet) RNA association upon DMOG is shown. c Venn diagram comparing the number of DMOG-responsive RBPs identified by each method. d Volcano plots displaying the p values (y axis) and the log2-fold change (FC) in DMOG- versus DMSO -treated and irradiated samples (x axis) of the proteins detected by eRIC (right) and RIC (left). Proteins with FDR < 0.05 (moderated t test) and consistent FC of at least 10% in each replicate were considered as hits and are depicted in red. e Density of log2-FC in DMOG- over vehicle-treated and irradiated samples of the proteins identified by eRIC (red) and RIC (blue). Note the lower signal dispersion of the RBPs recovered by eRIC. f Scatter plots of detected proteins comparing the log2 ratios (DMOG/vehicle) of two independent experiments (exp 1/2). g Heat map showing the protein log2 ratios (DMOG/vehicle) of eRIC/RIC hits. Hits were divided according to their occurrence in eRIC and/or RIC and clustered. Upper: eRIC/RIC common hits, middle and bottom: RIC and eRIC exclusive hits, respectively
Fig. 6
Fig. 6
Improved detection of poly(A)RBP responses by eRIC. a Representative biological processes and cellular components enriched among the DMOG-responsive RBPs identified by eRIC and/or RIC (Fisher’s Exact with FDR multiple test correction). b Examples of protein complexes or functionally related proteins that respond to DMOG with statistical significance
Fig. 7
Fig. 7
eRIC identifies m6A-responsive RBPs in vivo. a m6A dot blot of Jurkat cells treated with 0.5 mM DMOG or vehicle for 6 h, using two independent antibodies (Antibody 1: Abcam, Antibody 2: SySy). Serial dilutions of poly(A) RNA were blotted as indicated on the right. A quantification of the signal intensity based on image analysis is shown below each dot. Intensity is expressed relative to the lowest signal in the control. A representative blot of three biologically independent experiments is shown. b Overlap between DMOG-responsive RBPs identified by eRIC/RIC and m6A-regulated RBPs previously reported by Edupuganti et al. or Arguello et al.. Between brackets are the number of proteins with directions of DMOG-induced changes that coincide with previous reports. c Normalized signal sum in eRIC and RIC samples of representative examples of reported m6A readers (left), m6A-repelled RBPs (middle), and RBPs insensitive to m6A (right). −UV non-irradiated controls, +UV irradiated samples. eRIC and RIC values are expressed relative to the respective untreated control (−UV, DMSO). Data are shown as mean from two biologically independent experiments. Asterisk (*) indicates FDR < 0.05 (moderated t test)

References

    1. Baltz AG, et al. The mRNA-bound proteome and its global occupancy profile on protein-coding transcripts. Mol. Cell. 2012;46:674–690. doi: 10.1016/j.molcel.2012.05.021. - DOI - PubMed
    1. Castello A, et al. Insights into RNA biology from an atlas of mammalian mRNA-binding proteins. Cell. 2012;149:1393–1406. doi: 10.1016/j.cell.2012.04.031. - DOI - PubMed
    1. Conrad T, et al. Serial interactome capture of the human cell nucleus. Nat. Commun. 2016;7:11212. doi: 10.1038/ncomms11212. - DOI - PMC - PubMed
    1. Beckmann BM, et al. The RNA-binding proteomes from yeast to man harbour conserved enigmRBPs. Nat. Commun. 2015;6:10127. doi: 10.1038/ncomms10127. - DOI - PMC - PubMed
    1. Hentze MW, Castello A, Schwarzl T, Preiss T. A brave new world of RNA-binding proteins. Nat. Rev. Mol. Cell Biol. 2018;19:327–341. doi: 10.1038/nrm.2017.130. - DOI - PubMed

Publication types