

Breast cancer risk in premalignant lesions: osteopontin splice variants indicate prognosis
- PMID: 30353046
- PMCID: PMC6251032
- DOI: 10.1038/s41416-018-0228-1
Breast cancer risk in premalignant lesions: osteopontin splice variants indicate prognosis
Abstract
Background: Premalignant breast lesions pose variable risks for transformation, raising the question who should receive treatment to counteract the potential progression to breast cancer. Because the secreted metastasis mediator Osteopontin (OPN) is a marker for breast cancer aggressiveness, its presence in these lesions may reflect progression risk.
Methods: By immunohistochemistry, we analyse the association of Osteopontin variant expression in healthy breasts, hyperplasias, papillomas, and carcinomas in situ from 434 women to assess a) staining for OPN exon 4 (present in OPN-a and OPN-b) or OPN-c in low-risk to high-risk lesions b) correlations between staining and progression (DCIS with invasion, invasive cancer) or survival.
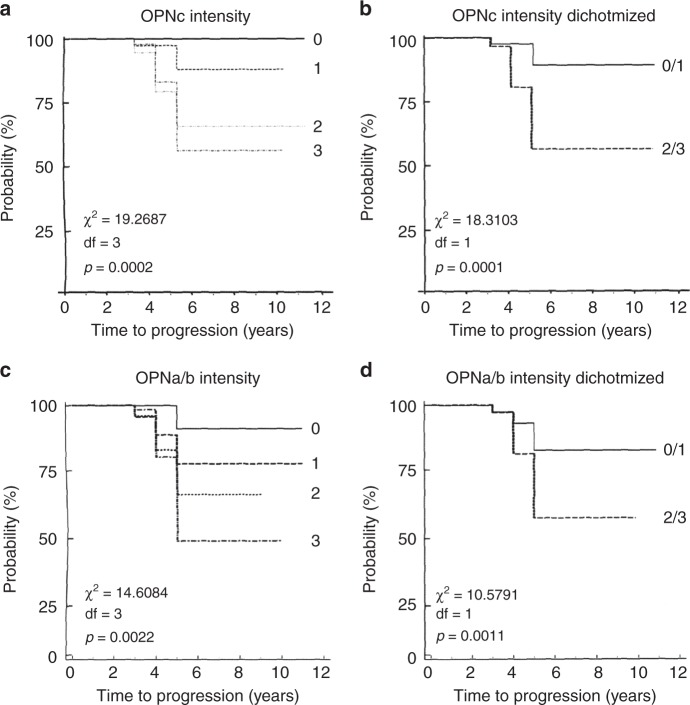
Results: The markers correlate with risk, and they are prognostic for ensuing invasive disease and survival. About 10% of OPN-c pathology score 0-1 (intensity), vs. 40% of score 3 experience cancer over 5 years. More than 90% of women, who progress, had pathology scores of 2-3 for OPN-c intensity at the time of initial diagnosis. When combining OPN-c and OPN exon 4 staining, all of the low intensity patients are alive after 5 years, whereas women in the high category have a close to 30% chance to die within 5 years. Of patients who succumb, close to 80% had a high combined score at the time of initial diagnosis.
Conclusion: The combined information of OPN splice variant immunohistochemistry can provide a foundation for very reliable prognostication and has the potential to aid decision making in the treatment of early breast lesions.
Conflict of interest statement
The authors declare no competing interests.
Figures


Similar articles
-
Breast cancer risk in papilloma patients: Osteopontin splice variants indicate prognosis.Breast Cancer Res. 2022 Sep 29;24(1):64. doi: 10.1186/s13058-022-01561-9. Breast Cancer Res. 2022. PMID: 36175970 Free PMC article.
-
Expression and clinical significance of osteopontin in calcified breast tissue.Asian Pac J Cancer Prev. 2012;13(10):5219-23. doi: 10.7314/apjcp.2012.13.10.5219. Asian Pac J Cancer Prev. 2012. PMID: 23244138
-
Prognostic Value of Osteopontin Splice Variant-c Expression in Breast Cancers: A Meta-Analysis.Biomed Res Int. 2016;2016:7310694. doi: 10.1155/2016/7310694. Epub 2016 Jul 4. Biomed Res Int. 2016. PMID: 27462610 Free PMC article.
-
Osteopontin splice variants and polymorphisms in cancer progression and prognosis.Biochim Biophys Acta Rev Cancer. 2017 Aug;1868(1):93-108.A. doi: 10.1016/j.bbcan.2017.02.005. Epub 2017 Feb 28. Biochim Biophys Acta Rev Cancer. 2017. PMID: 28254527 Review.
-
Carcinoma in situ of the female breast. A clinico-pathological, immunohistological, and DNA ploidy study.APMIS Suppl. 2003;(108):1-67. APMIS Suppl. 2003. PMID: 12874968 Review.
Cited by
-
SPP1 promotes radiation resistance through JAK2/STAT3 pathway in esophageal carcinoma.Cancer Med. 2022 Dec;11(23):4526-4543. doi: 10.1002/cam4.4840. Epub 2022 May 20. Cancer Med. 2022. PMID: 35593388 Free PMC article.
-
Prognostic value of OCT4A and SPP1C transcript variant co-expression in early-stage lung adenocarcinoma.BMC Cancer. 2020 Jun 5;20(1):521. doi: 10.1186/s12885-020-06969-0. BMC Cancer. 2020. PMID: 32503462 Free PMC article.
-
A single-cell landscape of pre- and post-menopausal high-grade serous ovarian cancer ascites.iScience. 2023 Aug 25;26(10):107712. doi: 10.1016/j.isci.2023.107712. eCollection 2023 Oct 20. iScience. 2023. PMID: 37701567 Free PMC article.
-
Meta-analysis of Osteopontin splice variants in cancer.BMC Cancer. 2023 Apr 24;23(1):373. doi: 10.1186/s12885-023-10854-x. BMC Cancer. 2023. PMID: 37095438 Free PMC article.
-
Distinctive Prognostic Value and Cellular Functions of Osteopontin Splice Variants in Human Gastric Cancer.Cells. 2021 Jul 19;10(7):1820. doi: 10.3390/cells10071820. Cells. 2021. PMID: 34359989 Free PMC article.
References
Publication types
MeSH terms
Substances
Grants and funding
LinkOut - more resources
Full Text Sources
Other Literature Sources
Medical
Research Materials
Miscellaneous
