. 2018 Oct 23;8(1):15615.
doi: 10.1038/s41598-018-33689-0.

c-Fos induces chondrogenic tumor formation in immortalized human mesenchymal progenitor cells

Affiliations

c-Fos induces chondrogenic tumor formation in immortalized human mesenchymal progenitor cells

Ander Abarrategi et al. Sci Rep. .

Abstract

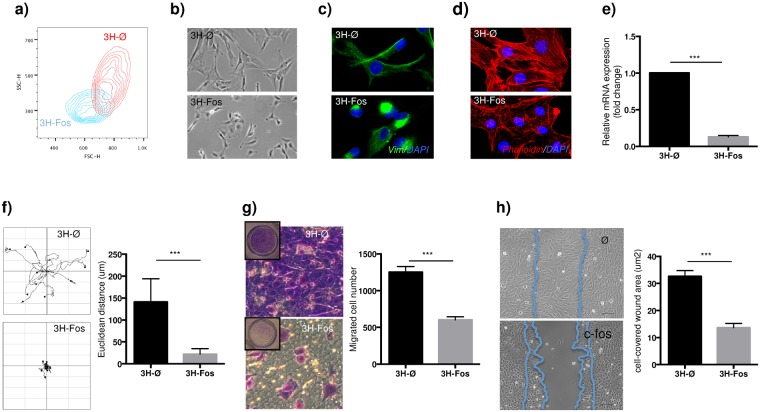
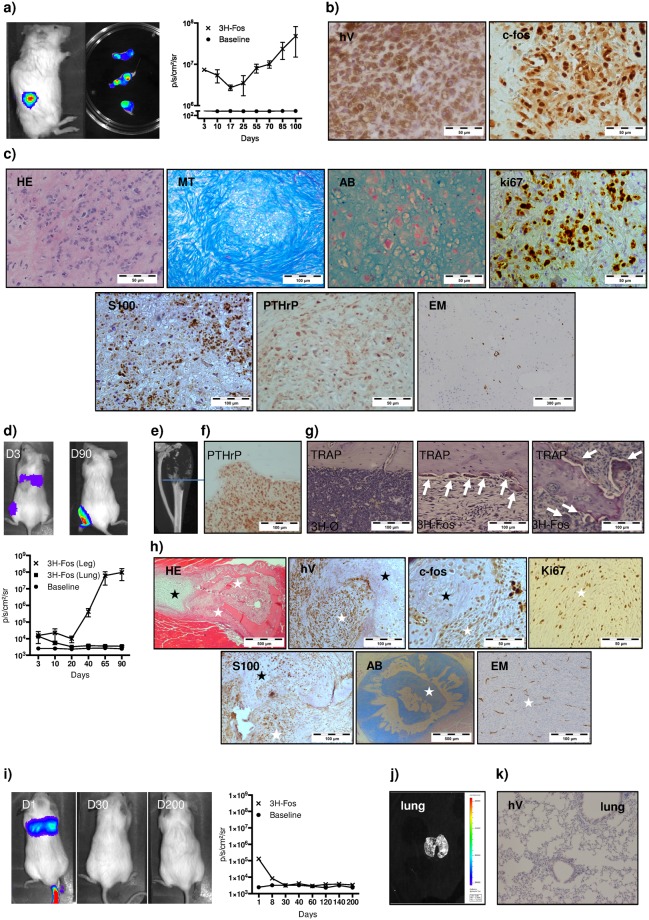
Mesenchymal progenitor cells (MPCs) have been hypothesized as cells of origin for sarcomas, and c-Fos transcription factor has been showed to act as an oncogene in bone tumors. In this study, we show c-Fos is present in most sarcomas with chondral phenotype, while multiple other genes are related to c-Fos expression pattern. To further define the role of c-Fos in sarcomagenesis, we expressed it in primary human MPCs (hMPCs), immortalized hMPCs and transformed murine MPCs (mMPCs). In immortalized hMPCs, c-Fos expression generated morphological changes, reduced mobility capacity and impaired adipogenic- and osteogenic-differentiation potentials. Remarkably, immortalized hMPCs or mMPCs expressing c-Fos generated tumors harboring a chondrogenic phenotype and morphology. Thus, here we show that c-Fos protein has a key role in sarcomas and that c-Fos expression in immortalized MPCs yields cell transformation and chondrogenic tumor formation.


Conflict of interest statement

The authors declare no competing interests.

Figures

Figure 1
Figure 1
c-Fos expression in human sarcoma samples. (AC) Co-expression studies of FOS with other genes in a cohort with 259 sarcoma samples. (See Dataset 1 in Supplementary Materials and methods). (A,B Pearson correlation study, p < 0.01). (A) Example of positive correlation between FOS and JUNB gene expression. Each dot represents a sarcoma sample. (B) Example of negative correlation between FOS and BRCA1 gene expression. Each dot represents a sarcoma sample. (C) Gene ontology (GO) study of FOS correlated genes (chi-square with continuity correction study, p < 0.01). A list of significant GO terms with the p-values is provided. The number on the right of each GO term represent the number of genes observed for that GO term. (D) Representative images of performed c-Fos IHC in clinical samples of human sarcomas (Chondrosarcoma n = 29, Osteosarcoma n = 67). (E) Table summarizing the presence of c-Fos in clinical samples of human sarcomas (Fisher’s exact test, p < 0.01). (F,G) c-Fos expression at mRNA level in different sarcoma tumors (*p ≤ 0.1). (F) data extracted from dataset 2, a cohort with 21 sarcoma samples, and normalized to c-Fos expression in growth plate (GP) controls included in the same dataset. (G) data from 19 sarcoma samples extracted from dataset 3 and normalized to HSP90 expression in each patient.
Figure 2
Figure 2
c-Fos expression induces 3H cells transformation. (a) RT-qPCR of c-Fos expression in transduced cells (n = 3). (b) Western blot showing c-Fos expression (n = 3). (c) Quantification of cell doubling time (n = 3). (d) Cell cycle study showing percentage of cells in each cell cycle phase (n = 3, ANOVA with multiple comparison test). (e) RT-qPCR of Cyclin A1 (CCN1) and B-Myb (MYBL2) expression levels (n = 4). (f) “Reactome_Meiotic recombination” Specific gene set enriched in 3H-Fos cells. Data obtained from GSEA pathway study. (g) Confocal images depicting z-stack reconstruction (Red: Phalloidin staining, Blue: DAPI) (n = 3). (h) Representative images of semisolid cultures at day 7, and quantification of MTT reduction by viable cells recovered from cultures (n = 4). (i) Immunofluorescence images of mitochondrial network (Green: Mitochondria, Blue: DAPI) (n = 3). (j) Quantification of Mitochondrial Membrane Potential (MMP) at basal level (n = 5). (k) Real time measurement of OCR during sequential addition of mitochondrial function modulation compounds (O: Oligomycin, F: FCCP, A/R: antimycin A and Rotenone) (n = 5 per each point, multiple t-test). (l) Lactate accumulation measurement after 48 hours cell culture (n = 3). (m) Cell 6-AN drug dose-response assay (n = 3 per each point). (3H-Ø, empty vector transduced cells; 3H-Fos, c-Fos vector transduced cells). (Unless specified, unpaired t-test. *p ≤ 0.05; **p ≤ 0.01; ***p ≤ 0.001).
Figure 3
Figure 3
c-Fos induces cytoskeletal changes and suppresses 3H cells invasion properties. (a) FACS plot representing cell size and complexity of transduced cells. (b) In vitro cell morphology after lentiviral transduction. (c) Representative immunofluorescence images of vimentin intermediate filament (Green: vimentin, Blue: DAPI) (n = 3). (d) Representative immunofluorescence images of Actin cytoskeleton (Red: Palloidin staining, Blue: DAPI) (n = 3). (e) RT-qPCR showing Tropomyosin 1 expression (n = 3). (f) Graphical representation and quantitative data of cell-displacement 17 hours after seeding at low density (data provided as mean euclidean distance displacement per cell) 10 cells are shown per condition (n = 10). (g) Transwell migrated cell-number quantification and representative images of crystal violet stained cells, after 24 hours of migration induction (n = 3). (h) Quantification and representative images of wound healing ability in cultured cells measured 12 hours after would formation (quantification is provided as cell-covered wound area) (n = 3). (3H-Ø, empty vector transduced cells; 3H-Fos, c-Fos vector transduced cells.) (unpaired t-test. *p ≤ 0.05; **p ≤ 0.01; ***p ≤ 0.001).
Figure 4
Figure 4
c-Fos induces impaired adipogenic and osteogenic, but not chondrogenic, differentiation in 3H cells. Representative images of (a) oil red staining after adipogenic differentiation (n = 5); (b) Osteogenic differentiation: alizarin red staining (n = 5), ALP activity (n = 3) and RUNX2 expression (n = 3). ALP protein activity and RT-qPCR of RUNX2 expression were measured 7 days and 24 hours after osteogenic induction, respectively. (c) Alcian blue staining after chondrogenesis differentiation in pellet cultures (n = 3). (d) Basal SOX9 expression in transduced cells (no differentiation induced) (n = 3). (3H-Ø, empty vector transduced cells; 3H-Fos, c-Fos vector transduced cells) (unpaired t-test. *p ≤ 0.05; **p ≤ 0.01; ***p ≤ 0.001).
Figure 5
Figure 5
3H-Fos cells generate chondrogenic tumors in immunodeficient mice. (ac) Subcutaneous model (n = 20). (a) Bioluminiscence images show tumor generation in mice, bioluminescence of extracted tumors and tumor formation bioluminiscence signal-kinetic in mice (n = 3). (b) IHC of tumors showing human vimentin and c-Fos expression (note c-Fos is present at nuclear and cytoplasmic level). (c) Subcutaneous tumor characterization. Representative images of performed staining and IHC studies are provided. (dh) Orthotopic model (n = 13). (d) Assessment of tumor formation by bioluminiscence after intra-bone marrow inoculation of 3H-Fos cells (D3, day 3; D90, day 90) (n = 3). (e) MicroCT image shows lytic lesion in mouse tibia implanted with 3H-Fos cells (n = 10). (f) IHC image shows PTHrP expression in tumoral cells. (g) TRAP staining shows osteoclasts (white arrows) in the bone lining area and in the proximity of reactive bone formed in the tumor. (h) Representative images of performed staining and IHC studies are provided (black stars indicate point of neoformed cartilage tissue; white starts indicate the location of osteolytic lesions and tumoral cells). (ik) Intravenous (i.v.) model (n = 10). (i) Bioluminiscence signal-kinetic study after IV inoculation of 3H-Fos cells (D1, day 1; D30, day 30; D200, day 200) (n = 3). (j) Lungs did not present bioluminiscence signal at experimental end point. (k) No micrometastasis were observed in histological sections (hV, Vimentin; H/E, hematoxilin and eosin; MT, Masson’s trichromic; AB, Alcian Blue; EM, endomucin).
Figure 6
Figure 6
c-Fos expression in murine p53−/−Rb−/− MPCs generate chondrogenic tumors. (a) Characterization of tumors generated after subcutaneous implantation of mMPC-Fos cells (n = 3). (b) Characterization of tumors generated after intratibial implantation of mMPC-Fos cells (n = 6). (c) Non-calcified lung metastasis generated by mMPC-Fos tumors in intratibial implantation model (n = 5). (d) Characterization of tibia samples implanted with mMPC-Ø cells (n = 3). (e) Calcified lung metastasis generated by mMPC-Ø tumors in intratibial implantation model (n = 3). Alcian blue (AB) and Masson’s trichrome (MT) indicates acid mucin and typical chondrogenic matrix deposition. Chondrogenic phenotype generated by mMPC-Fos was also confirmed by IHC of specific markers expression (Pre-Col2, S100). Note that lung metastasis from mMPC-Fos also appears typically chondrogenic and no calcium deposition is detected as shown by loss of staining for Alizarin red (AR), while tumors generated by mMPC-Ø appears as an ossifying tumour showing direct bone formation and also metastatic disease shows radio dense and osteogenic characteristics.

Similar articles

Cited by

References

    1. Mutsaers AJ, Walkley CR. Cells of origin in osteosarcoma: mesenchymal stem cells or osteoblast committed cells? Bone. 2014;62:56–63. doi: 10.1016/j.bone.2014.02.003. - DOI - PubMed
    1. Sottnik JL, et al. Osteocytes serve as a progenitor cell of osteosarcoma. J Cell Biochem. 2014;115:1420–1429. doi: 10.1002/jcb.24793. - DOI - PMC - PubMed
    1. Mohseny AB, et al. Osteosarcoma originates from mesenchymal stem cells in consequence of aneuploidization and genomic loss of Cdkn2. J Pathol. 2009;219:294–305. doi: 10.1002/path.2603. - DOI - PubMed
    1. Shimizu T, et al. c-MYC overexpression with loss of Ink4a/Arf transforms bone marrow stromal cells into osteosarcoma accompanied by loss of adipogenesis. Oncogene. 2010;29:5687–5699. doi: 10.1038/onc.2010.312. - DOI - PubMed
    1. Grigoriadis AE, Schellander K, Wang ZQ, Wagner EF. Osteoblasts are target cells for transformation in c-fos transgenic mice. J Cell Biol. 1993;122:685–701. doi: 10.1083/jcb.122.3.685. - DOI - PMC - PubMed

Publication types

MeSH terms

Substances