. 2019 Feb;37(2):257-269.
doi: 10.1002/stem.2932. Epub 2018 Nov 2.

Ovarian Carcinoma-Associated Mesenchymal Stem Cells Arise from Tissue-Specific Normal Stroma

Affiliations

Ovarian Carcinoma-Associated Mesenchymal Stem Cells Arise from Tissue-Specific Normal Stroma

Lan G Coffman et al. Stem Cells. 2019 Feb.

Abstract

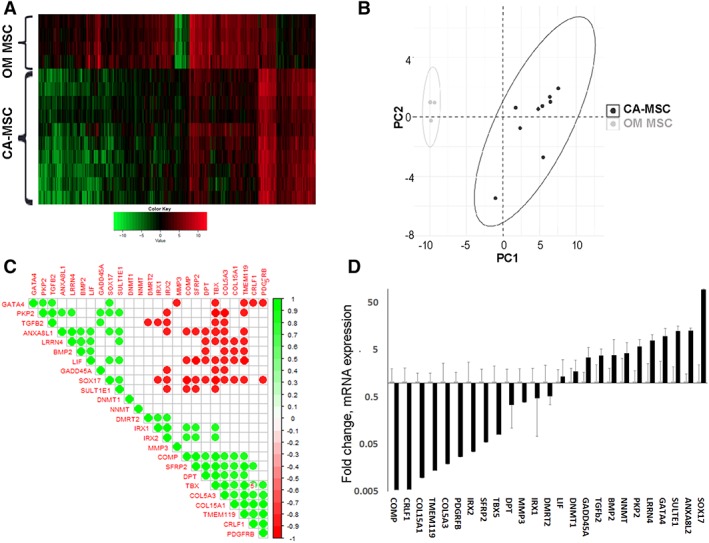
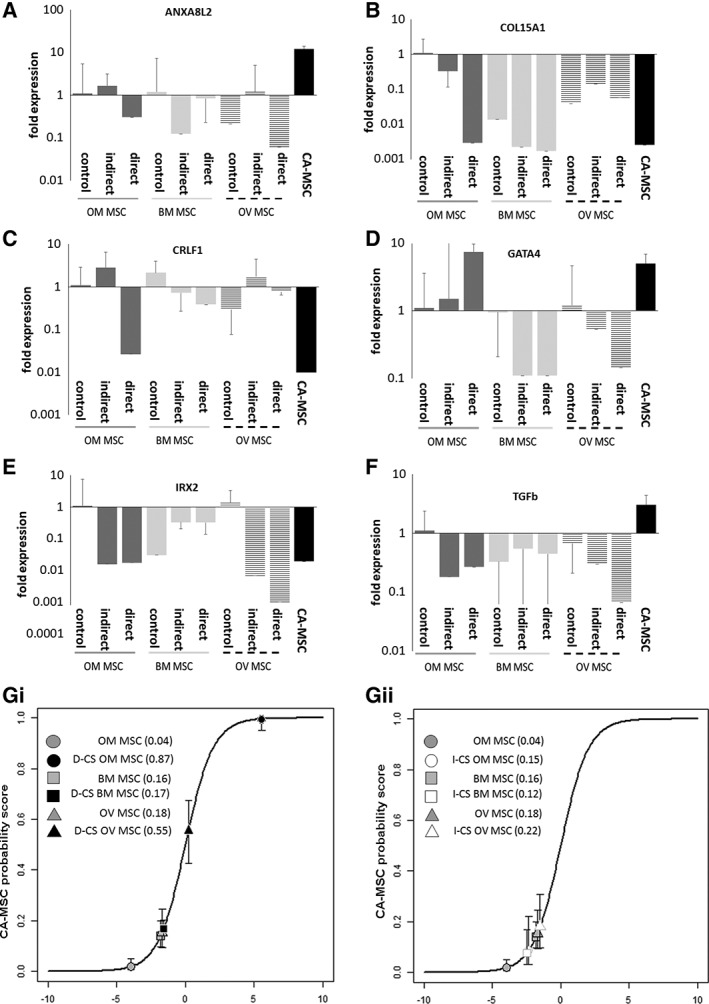
Carcinoma-associated mesenchymal stem cells (CA-MSCs) are critical stromal progenitor cells within the tumor microenvironment (TME). We previously demonstrated that CA-MSCs differentially express bone morphogenetic protein family members, promote tumor cell growth, increase cancer "stemness," and chemotherapy resistance. Here, we use RNA sequencing of normal omental MSCs and ovarian CA-MSCs to demonstrate global changes in CA-MSC gene expression. Using these expression profiles, we create a unique predictive algorithm to classify CA-MSCs. Our classifier accurately distinguishes normal omental, ovary, and bone marrow MSCs from ovarian cancer CA-MSCs. Suggesting broad applicability, the model correctly classifies pancreatic and endometrial cancer CA-MSCs and distinguishes cancer associated fibroblasts from CA-MSCs. Using this classifier, we definitively demonstrate ovarian CA-MSCs arise from tumor mediated reprograming of local tissue MSCs. Although cancer cells alone cannot induce a CA-MSC phenotype, the in vivo ovarian TME can reprogram omental or ovary MSCs to protumorigenic CA-MSCs (classifier score of >0.96). In vitro studies suggest that both tumor secreted factors and hypoxia are critical to induce the CA-MSC phenotype. Interestingly, although the breast cancer TME can reprogram bone marrow MSCs into CA-MSCs, the ovarian TME cannot, demonstrating for the first time that tumor mediated CA-MSC conversion is tissue and cancer type dependent. Together these findings (a) provide a critical tool to define CA-MSCs and (b) highlight cancer cell influence on distinct normal tissues providing powerful insights into the mechanisms underlying cancer specific metastatic niche formation. Stem Cells 2019;37:257-269.

Keywords: Hypoxia; Mesenchymal stem cell; Ovarian cancer; Tumor microenvironment.


Conflict of interest statement

D.B. declared research support from Roche‐Genentech and AstraZeneca. R.B. declared a leadership position with Tradewind Biosciences and two patents with the University of Michigan. The other authors indicated no potential conflicts of interest.

Figures

Figure 1
Figure 1
Carcinoma‐associated mesenchymal stem cells (CA‐MSCs) have a unique expression profile compared with normal MSCs. (A): Unsupervised hierarchical clustering of RNAseq reveals distinct expression profiles for omental derived MSCs (OM‐MSCs) and CA‐MSCs. Clustered heatmap shown with green representing downregulated RNA expression and red representing upregulated RNA expression. (B): Principal component analysis of RNAseq data comparing normal OM MSCs to CA‐MSCs demonstrating broad differences in expression patterns. Each dot corresponds to one individual sample (10 CA‐MSC samples and four OM MSC samples, dots may overlie each other). Ellipses represent centroids from kmeans clustering. (C): Correlation plot for gene enrichment scores of top 25 differentially expressed genes from RNAseq analysis. Green represents positive correlation where red represents negative correlation. Associations with p ≤ .001 are shown. (D): Independent validation of expression differences in the top 25 differentially expressed genes via qRT‐PCR. Fold change in expression compared with OM MSCs, error bars = SEM.
Figure 2
Figure 2
Development of a carcinoma‐associated mesenchymal stem cells (CA‐MSCs) classifier to distinguish CA‐MSCs versus normal MSCs. (A): The CA‐MSC classifier contains genes (bolded) from distinct gene enrichment scores clusters demonstrating representation of nonoverlapping sets of differential gene expression. (B): Final logistic regression model with CA‐MSC classifier scores ranging from 0 to 1 distinguishing normal MSCs versus CA‐MSCs. B1 = −0.00622, B2 = 0.175026, B3 = 0.886027, B4 = −0.34594, B5 = 0.416952, B6 = −0.00824. (C): Validation of the CA‐MSC classifier using independent samples from multiple patient‐derived tissues, error bars = SEM.
Figure 3
Figure 3
Indirect and direct cancer stimulation of normal mesenchymal stem cells (MSCs) with ovarian cancer cell coculture partially induces the carcinoma‐associated (CA)‐MSC expression profile. Bone marrow MSCs, omental MSCs and ovarian MSCs underwent indirect cancer stimulation (I‐CS) or direct cancer stimulation (D‐CS) with ovarian cancer cells. qRT‐PCR expression of genes in the CA‐MSC classifier were assessed: (A) ANAX8, (B) COL15A1, (C) CRLF1, (D) GATA4, (E) IRX2, (F) TGF‐β (fold expression changes compared with OM MSC control) and expression data was applied to the CA‐MSC classifier: (G): Average CA‐MSC classifier scores across three independent experiments with (i) I‐CS and (ii) D‐CS. Error bars = SEM.
Figure 4
Figure 4
Hypoxia alters the behavior of MSCs and enhances the cancer‐mediated induction of a carcinoma‐associated mesenchymal stem cell (CA‐MSC) expression profile. (A): Omental (OM) MSCs and CA‐MSCs (i) grow slower and (ii) form sphere‐like structures when grown under hypoxic conditions (1% O2). (B): CA‐MSCs have higher (i) mRNA and (ii) protein levels of HIF1α versus OM MSCs and HIF1α is induced with cancer cell coculture. (C–E): Hypoxic indirect or direct cancer stimulation of bone marrow MSCs, OM MSCs and ovarian MSCs with ovarian cancer cell coculture yielded mRNA expression changes of genes in the CA‐MSC classifier: (C) ANAX8, (D) COL15A1, (E) CRLF1, (F) GATA4, (G) IRX2, (H) TGF‐β (fold expression changes compared with OM MSC control). (I): Average CA‐MSC classifier scores across three independent experiments with (i) indirect hypoxic cancer stimulation (Ihyp‐CS) and (ii) direct hypoxic cancer stimulation (Dhyp‐CS). Error bars = SEM.
Figure 5
Figure 5
In vivo cancer stimulation (IV‐CS) effectively induces the carcinoma‐associated mesenchymal stem cell (CA‐MSC) expression profile. (A): qRT‐PCR expression analysis of IV‐CS omental (OM) MSC and IV‐CS ovarian (OV) MSCs demonstrating the development of a CA‐MSC expression profile (fold expression changes compared with OM MSC control). (B): Average CA‐MSC classifier scores of IV‐CS OM MSC and IV‐CS OV MSCs. Error bars = SEM. (C): Composite analysis of cancer stimulated MSCs and resultant CA‐MSC classifier scores. Values represented as average score with SEM.
Figure 6
Figure 6
Carcinoma‐associated mesenchymal stem cell (CA‐MSC) classification of cancer stimulated MSCs corresponds with induction of tumor cell chemotherapy resistance. Cancer stimulated omental (OM) MSCs, bone marrow (BM) MSCs and ovarian (OV) MSCs combined with GFP‐labeled CAOV3 or PEO1 cancer cells were treated with cisplatin and viable GFP‐tumor cells were assessed via FACs. (A): Indirect hypoxic cancer stimulation (Ihyp‐CS) enhances OM MSC‐mediated induction of (i) CAOV3 and (ii) PEO1 chemotherapy resistance. (B): Direct hypoxic cancer stimulation (Dhyp‐CS) further enhances OM MSC‐mediated induction of (i) CAOV3 and (ii) PEO1 chemotherapy resistance. (C): in vivo cancer stimulation (IV‐CS) enhances OM MSC‐mediated induction of PEO1 chemotherapy resistance comparable to effects seen with CA‐MSCs. (D): Composite analysis of viable PEO1 cells ± cancer stimulated MSCs demonstrating the induction of cancer cell chemotherapy resistance is proportional to the development of the CA‐MSC expression profile (as measured via the CA‐MSC classifier score). (E): in vivo cancer stimulated OM MSCs (IV‐CS OM MSC) grown with GFP‐tumor cells (PEO1) increase (E) the number of tumor spheres and (F) the total number of nonadherent tumor cells (quantified via sphere dissociation). Error bars = SEM. (G): Representative pictures of (i) tumor spheres without MSCs and (ii) tumor cells mixed with IV‐CS OM MSCs.
Figure 7
Figure 7
In vivo cancer stimulated omental mesenchymal stem cells (OM MSCs) increase ovarian cancer cell growth in a murine xenograft model. (A): In vivo cancer stimulation (IV‐CS) OM MSCs mixed with CAOV3 tumor cells in NSG mice significantly enhance the initiation and growth rate of CAOV3 tumors to levels equivalent to patient derived CA‐MSCs. (B): IV‐CS OV MSCs likewise enhance CAOV3 tumor growth whereas bone marrow (BM) MSCs inhibit CAOV3 tumor growth. (C): BM‐MSCs stimulated with breast cancer cells (IV‐CS BM MSCs) enhance breast cancer tumor initiation and growth. Error bars = SEM.

Similar articles

Cited by

References

    1. Surveillance, Epidemiology, and End Results (SEER) Program (www.seer.cancer.gov) Research Data (1973–2010), National Cancer Institute, DCCPS, Surveillance Research Program, Surveillance Systems Branch, released April 2013, based on the November 2012; submission.
    1. McLean K, Gong Y, Choi Y et al. Human ovarian carcinoma‐associated mesenchymal stem cells regulate cancer stem cells and tumorigenesis via altered BMP production. J Clin Invest 2011;121:3206–3219. - PMC - PubMed
    1. Musrap N, Diamandis EP. Revisiting the complexity of the ovarian cancer microenvironment—Clinical implications for treatment strategies. Mol Cancer Res 2012;10:1254–1264. - PubMed
    1. Nieman KM, Kenny HA, Penicka CV et al. Adipocytes promote ovarian cancer metastasis and provide energy for rapid tumor growth. Nat Med 2011;17:1498–1503. - PMC - PubMed
    1. da Silva Meirelles L, Chagastelles PC, Nardi NB. Mesenchymal stem cells reside in virtually all post‐natal organs and tissues. J Cell Sci 2006;119:2204–2213. - PubMed

Publication types