

How Do Home and Clinic Blood Pressure Readings Compare in Pregnancy?
- PMID: 30354754
- PMCID: PMC6080884
- DOI: 10.1161/HYPERTENSIONAHA.118.10917
How Do Home and Clinic Blood Pressure Readings Compare in Pregnancy?
Abstract
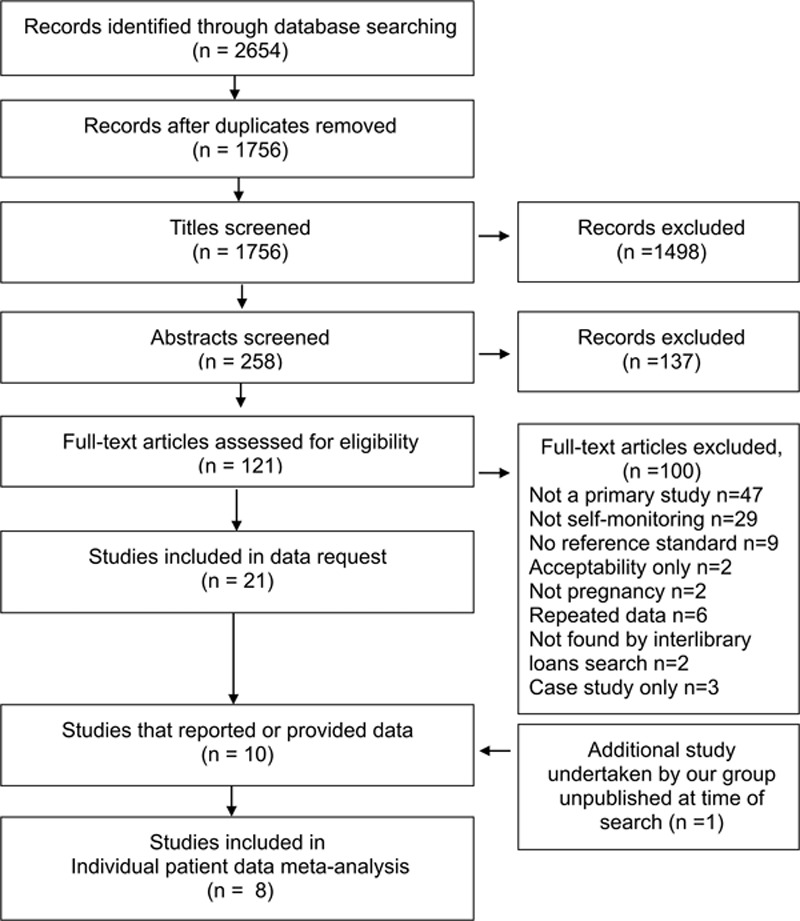
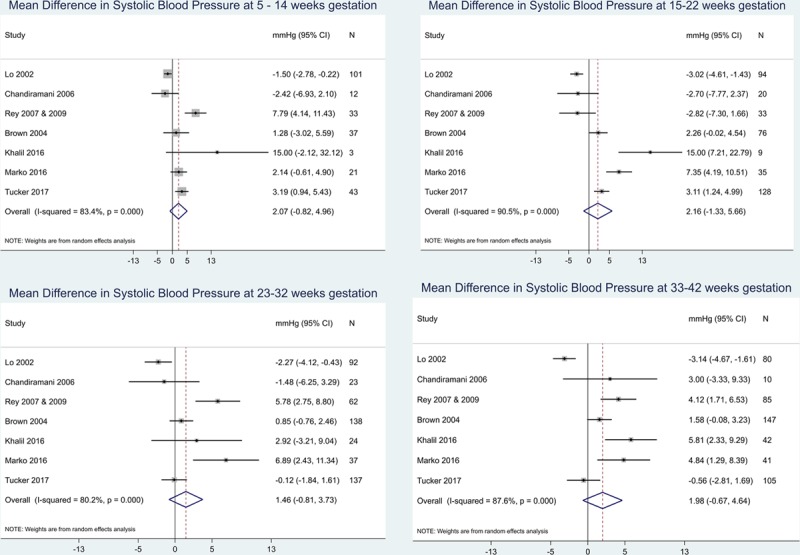
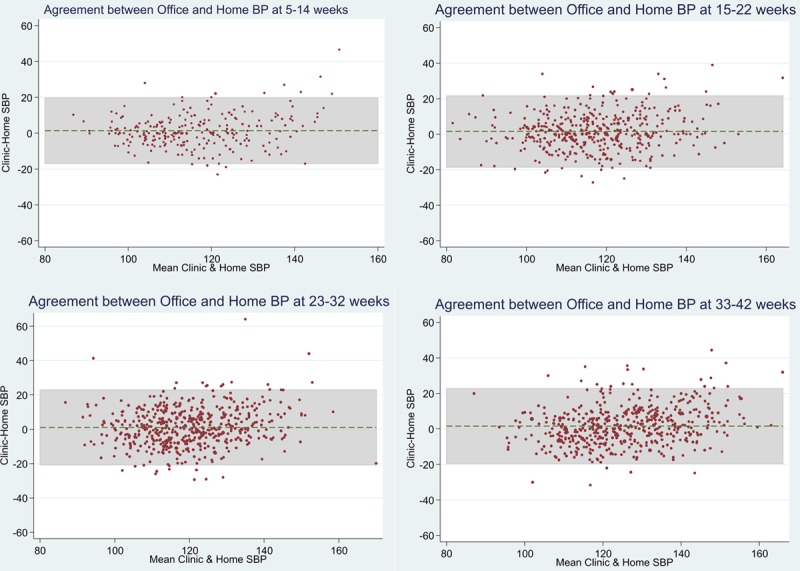
Hypertensive disorders during pregnancy result in substantial maternal morbidity and are a leading cause of maternal deaths worldwide. Self-monitoring of blood pressure (BP) might improve the detection and management of hypertensive disorders of pregnancy, but few data are available, including regarding appropriate thresholds. This systematic review and individual patient data analysis aimed to assess the current evidence on differences between clinic and self-monitored BP through pregnancy. MEDLINE and 10 other electronic databases were searched for articles published up to and including July 2016 using a strategy designed to capture all the literature on self-monitoring of BP during pregnancy. Investigators of included studies were contacted requesting individual patient data: self-monitored and clinic BP and demographic data. Twenty-one studies that utilized self-monitoring of BP during pregnancy were identified. Individual patient data from self-monitored and clinic readings were available from 7 plus 1 unpublished articles (8 studies; n=758) and 2 further studies published summary data. Analysis revealed a mean self-monitoring clinic difference of ≤1.2 mm Hg systolic BP throughout pregnancy although there was significant heterogeneity (difference in means, I2 >80% throughout pregnancy). Although the overall population difference was small, levels of white coat hypertension were high, particularly toward the end of pregnancy. The available literature includes no evidence of a systematic difference between self and clinic readings, suggesting that appropriate treatment and diagnostic thresholds for self-monitoring during pregnancy would be equivalent to standard clinic thresholds.
Keywords: blood pressure; hypertension; pre-eclampsia; pregnancy; white coat hypertension.
Figures
References
-
- Duley L. The global impact of pre-eclampsia and eclampsia. Semin Perinatol. 2009;33:130–137. doi: 10.1053/j.semperi.2009.02.010. - PubMed
-
- Say L, Chou D, Gemmill A, Tunçalp Ö, Moller AB, Daniels J, Gülmezoglu AM, Temmerman M, Alkema L. Global causes of maternal death: a WHO systematic analysis. Lancet Glob Health. 2014;2:e323–e333. doi: 10.1016/S2214-109X(14)70227-X. - PubMed
-
- Khan KS, Wojdyla D, Say L, Gülmezoglu AM, Van Look PF. WHO analysis of causes of maternal death: a systematic review. Lancet. 2006;367:1066–1074. doi: 10.1016/S0140-6736(06)68397-9. - PubMed
-
- Knight M KS, Brocklehurst P, Neilson J, Shakespeare J, Kurinczuk JJ, editors. on Behalf of MBRRACEUK. Saving Lives, Improving Mothers’ Care Lessons Learned to Inform Future Maternity Care From the UK and Ireland Confidential Enquiries into Maternal Deaths and Morbidity 2009–2012. Maternal, Newborn and Infant Clinical Outcome Review Programme. Oxford, UK: National Perinatal Epidemiology Unit, University of Oxford; 2014.
-
- Cantwell R, Clutton-Brock T, Cooper G, et al. Saving Mothers’ Lives: reviewing maternal deaths to make motherhood safer: 2006-2008. The Eighth Report of the Confidential Enquiries into Maternal Deaths in the United Kingdom. BJOG. 2011;118(suppl 1):1–203. doi: 10.1111/j.1471-0528.2010.02847.x. - PubMed
Publication types
MeSH terms
Grants and funding
LinkOut - more resources
Full Text Sources
Medical
