

Interference With Endothelial PPAR (Peroxisome Proliferator-Activated Receptor)-γ Causes Accelerated Cerebral Vascular Dysfunction in Response to Endogenous Renin-Angiotensin System Activation
- PMID: 30354810
- PMCID: PMC6209120
- DOI: 10.1161/HYPERTENSIONAHA.118.11857
Interference With Endothelial PPAR (Peroxisome Proliferator-Activated Receptor)-γ Causes Accelerated Cerebral Vascular Dysfunction in Response to Endogenous Renin-Angiotensin System Activation
Abstract
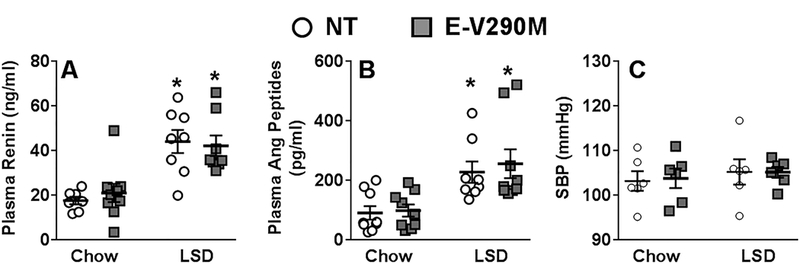
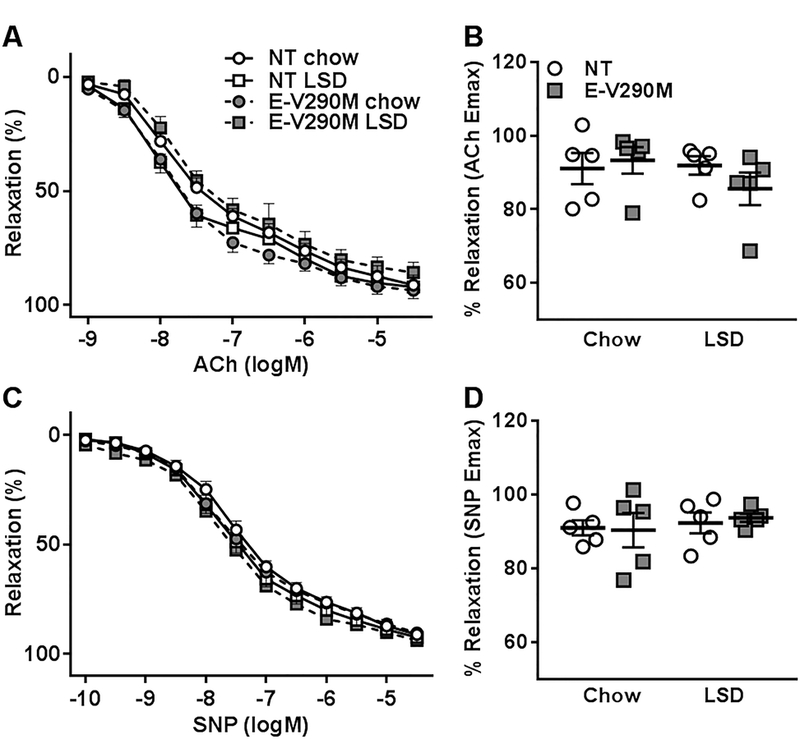
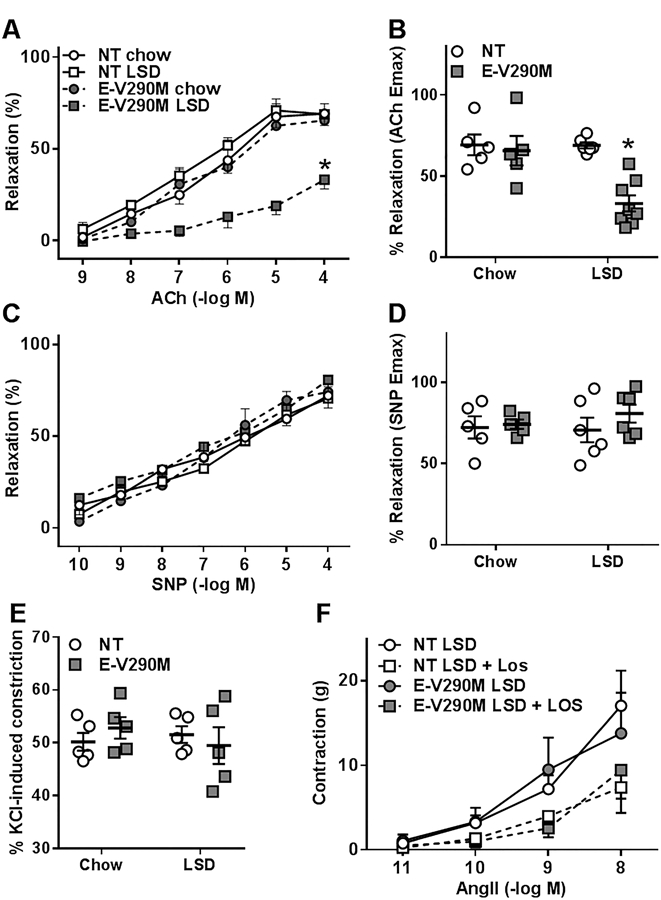
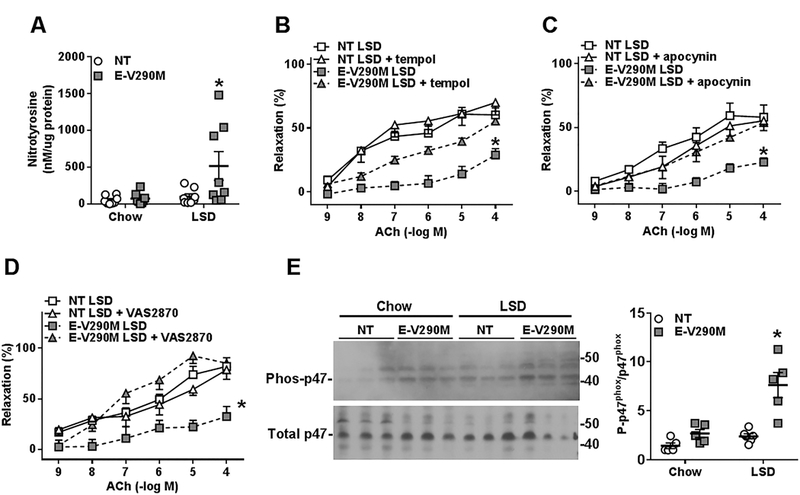
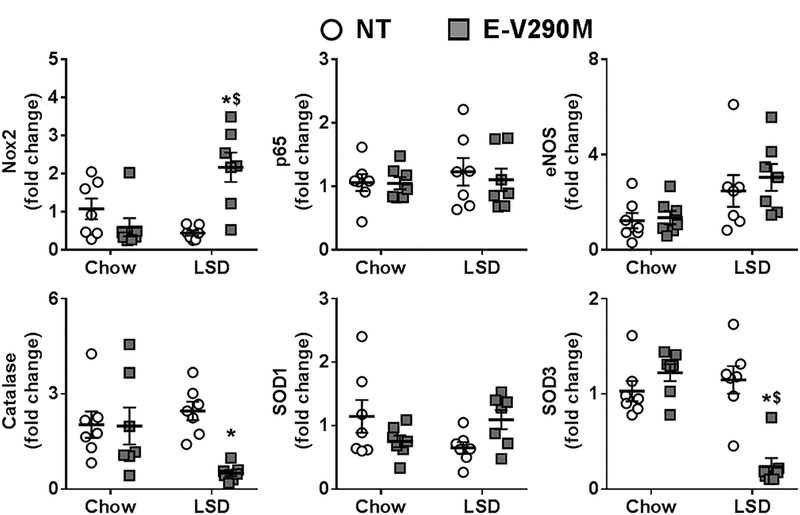
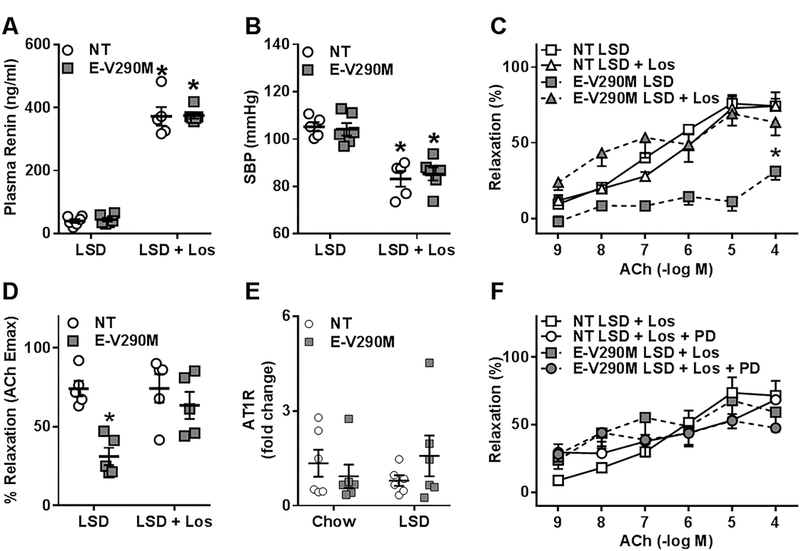
Low-salt diet is beneficial in salt-sensitive hypertension but may provoke cardiovascular risk in patients with heart failure, diabetes mellitus, or other cardiovascular abnormalities because of endogenous renin-angiotensin system activation. PPAR (peroxisome proliferator-activated receptor)-γ is a transcription factor which promotes an antioxidant pathway in the endothelium. We studied transgenic mice expressing a dominant-negative mutation in PPAR-γ selectively in the endothelium (E-V290M) to test the hypothesis that endothelial PPAR-γ plays a protective role in response to low salt-mediated renin-angiotensin system activation. Plasma renin and Ang II (angiotensin II) were significantly and equally increased in all mice fed low salt for 6 weeks. Vasorelaxation to acetylcholine was not affected in basilar artery from E-V290M at baseline but was significantly and selectively impaired in E-V290M after low salt. Unlike basilar artery, low salt was not sufficient to induce vascular dysfunction in carotid artery or aorta. Endothelial dysfunction in the basilar artery from E-V290M mice fed low salt was attenuated by scavengers of superoxide, inhibitors of NADPH oxidase, or blockade of the Ang II AT1 (angiotensin type-1) receptor. Simultaneous AT1 and AT2 receptor blockade revealed that the restoration of endothelial function after AT1 receptor blockade was not a consequence of AT2 receptor activation. We conclude that interference with PPAR-γ in the endothelium produces endothelial dysfunction in the cerebral circulation in response to low salt-mediated activation of the endogenous renin-angiotensin system, mediated at least in part, through AT1 receptor activation and perturbed redox homeostasis. Moreover, our data suggest that the cerebral circulation may be particularly sensitive to inhibition of PPAR-γ activity and renin-angiotensin system activation.
Keywords: endothelial dysfunction; hypertension; mice; renin-angiotensin system; risk factors; sodium restriction.
Figures
Similar articles
-
Genetic Interference With Endothelial PPAR-γ (Peroxisome Proliferator-Activated Receptor-γ) Augments Effects of Angiotensin II While Impairing Responses to Angiotensin 1-7.Hypertension. 2017 Sep;70(3):559-565. doi: 10.1161/HYPERTENSIONAHA.117.09358. Epub 2017 Jul 3. Hypertension. 2017. PMID: 28674038 Free PMC article.
-
Interference with PPARγ in endothelium accelerates angiotensin II-induced endothelial dysfunction.Physiol Genomics. 2016 Feb;48(2):124-34. doi: 10.1152/physiolgenomics.00087.2015. Epub 2015 Nov 3. Physiol Genomics. 2016. PMID: 26534936 Free PMC article.
-
Endothelial PPARγ (Peroxisome Proliferator-Activated Receptor-γ) Protects From Angiotensin II-Induced Endothelial Dysfunction in Adult Offspring Born From Pregnancies Complicated by Hypertension.Hypertension. 2019 Jul;74(1):173-183. doi: 10.1161/HYPERTENSIONAHA.119.13101. Epub 2019 May 20. Hypertension. 2019. PMID: 31104564 Free PMC article.
-
Hypertension: renin-angiotensin-aldosterone system alterations.Circ Res. 2015 Mar 13;116(6):960-75. doi: 10.1161/CIRCRESAHA.116.303587. Circ Res. 2015. PMID: 25767283 Review.
-
[Angiotensin II receptor blockers: current status and future prospects].Drugs. 2002;62 Spec No 1:53-64. Drugs. 2002. PMID: 12036389 Review. French.
Cited by
-
Increased Susceptibility of Mice Lacking Renin-b to Angiotensin II-Induced Organ Damage.Hypertension. 2020 Aug;76(2):468-477. doi: 10.1161/HYPERTENSIONAHA.120.14972. Epub 2020 Jun 8. Hypertension. 2020. PMID: 32507043 Free PMC article.
-
Impact of the Renin-Angiotensin System on the Endothelium in Vascular Dementia: Unresolved Issues and Future Perspectives.Int J Mol Sci. 2020 Jun 16;21(12):4268. doi: 10.3390/ijms21124268. Int J Mol Sci. 2020. PMID: 32560034 Free PMC article. Review.
-
EP3 (E-Prostanoid 3) Receptor Mediates Impaired Vasodilation in a Mouse Model of Salt-Sensitive Hypertension.Hypertension. 2021 Apr;77(4):1399-1411. doi: 10.1161/HYPERTENSIONAHA.120.16518. Epub 2021 Mar 1. Hypertension. 2021. PMID: 33641369 Free PMC article.
-
PPARγ and RhoBTB1 in hypertension.Curr Opin Nephrol Hypertens. 2020 Mar;29(2):161-170. doi: 10.1097/MNH.0000000000000579. Curr Opin Nephrol Hypertens. 2020. PMID: 31789920 Free PMC article. Review.
-
Conditional deletion of smooth muscle Cullin-3 causes severe progressive hypertension.JCI Insight. 2019 Jun 11;5(14):e129793. doi: 10.1172/jci.insight.129793. JCI Insight. 2019. PMID: 31184598 Free PMC article.
References
-
- Mozaffarian D, Benjamin EJ, Go AS, et al. Heart disease and stroke statistics−−2015 update: a report from the American Heart Association. Circulation 2015;131:e29–e322. - PubMed
-
- Whelton PK, Appel LJ, Sacco RL, et al. Sodium, blood pressure, and cardiovascular disease: further evidence supporting the American Heart Association sodium reduction recommendations. Circulation 2012;126:2880–2889. - PubMed
Publication types
MeSH terms
Substances
Grants and funding
LinkOut - more resources
Full Text Sources
Research Materials
Miscellaneous
