. 2018 Nov;72(5):1160-1171.
doi: 10.1161/HYPERTENSIONAHA.118.11650.

Role of DNA De Novo (De)Methylation in the Kidney in Salt-Induced Hypertension

Affiliations

Role of DNA De Novo (De)Methylation in the Kidney in Salt-Induced Hypertension

Pengyuan Liu et al. Hypertension. 2018 Nov.

Abstract

Numerous adult diseases involving tissues consisting primarily of nondividing cells are associated with changes in DNA methylation. It suggests a pathophysiological role for de novo methylation or demethylation of DNA, which is catalyzed by DNA methyltransferase 3 and ten-eleven translocases. However, the contribution of DNA de novo (de)methylation to these diseases remains almost completely unproven. Broad changes in DNA methylation occurred within days in the renal outer medulla of Dahl SS rats fed a high-salt diet, a classic model of hypertension. Intrarenal administration of anti-DNA methyltransferase 3a/ten-eleven translocase 3 GapmeRs attenuated high salt-induced hypertension in SS rats. The high-salt diet induced differential expression of 1712 genes in the renal outer medulla. Remarkably, the differential expression of 76% of these genes was prevented by anti-DNA methyltransferase 3a/ten-eleven translocase 3 GapmeRs. The genes differentially expressed in response to the GapmeRs were involved in the regulation of metabolism and inflammation and were significantly enriched for genes showing differential methylation in response to the GapmeRs. These data indicate a significant role of DNA de novo (de)methylation in the kidney in the development of hypertension in SS rats. The findings should help to shift the paradigm of DNA methylation research in diseases involving nondividing cells from correlative analysis to functional and mechanistic studies.

Keywords: DNA methylation; diet; genomics; hypertension; kidney.


Figures
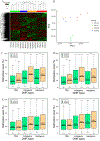
Figure 1.
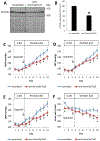
Figure 1.. A high-salt diet for 14 days changes DNA methylation profiles in the renal outer medulla of SS rats.
A. Heatmap based on DNA methylation profiles in the renal outer medulla. Each row represents a CpG site, and each column depicts methylation data from an individual rat. The color bar at the top of the graph indicates grouping of rats based on experimental conditions. B. Principal component analysis using DNA methylation profiles in the renal outer medulla. Each dot indicates a sample. Samples with the same color belong to the same group of rats. C-F. Methylation levels of genomic regions differentially methylated between CRLLS and CRLHS (C), MCWLS and MCWHS (D), CRLLS and MCWLS (E), and CRLHS and MCWHS (F). MCW, SS rats obtained from a colony maintained on a purified diet, AIN-76A, containing 0.4% NaCl at MCW; CRL, SS rats obtained from a colony maintained on a non-purified diet, 5L2F, containing 0.75% NaCl at Charles River Laboratories; LS, rats fed the same diet as the diet the respective colony was maintained on until they are 8 weeks old when the tissues were collected for analysis; HS, rats fed an AIN-76A diet containing 4% NaCl for 14 days starting at 6 weeks of age; TSS, transcriptional start site regions; DMR, differentially methylated regions. *, p<0.05; **, p<0.01.
Figure 2.
Figure 2.. Expression of Dnmt3 and Tet isoforms in the renal medulla of SS and salt-insensitive SS.13BN rats.
Western blot analysis is shown for Dnmt3a (A), Dnmt3b (B), Tet1 (C), and Tet2 (D) in the renal medulla of SS and SS.13BN (abbreviated as 13 in the bar graphs) rats maintained on a 0.4% NaCl diet (LS) or switched a 4% NaCl diet for 7 days (HS) (n=3-4). Coomassie stain of the entire membrane, part of which is shown below the Western blot, was used for normalization. *, p<0.05 vs. 13HS; two-way ANOVA followed by Holm-Sidak test.
Figure 3.
Figure 3.. Intra-renal administration of anti-Dnmt3a/Tet3 GapmeR’s attenuates salt-induced hypertension in SS rats.
A. Renal medullary interstitial administration of GapmeR’s targeting Dnmt3a and Tet3 (anti-Dnmt3a/Tet3) knocked down Dnmt3a in the outer medulla, compared with rats receiving a scrambled GapmeR. The Western blot analysis was performed at day 7 after the GapmeR administration. Part of the Coomassie blue stain used for normalization is shown under each corresponding Western blot. B. Densitometry quantification of the blot shown in panel A normalized by Coomassie stains. n=4-5, *, p<0.05 vs. rats treated with scrambled GapmeR; student t-test. C. Mean arterial blood pressure (MAP) of SS rats treated with a high-salt diet and renal medullary interstitial administration of scrambled or anti-Dnmt3a/Tet3 GapmeRs. D. Systolic blood pressure (SBP). E. Diastolic blood pressure (DBP). F. Heart rate. N=9 for scrambled GapmeR and 11 for anti-Dnmt3a/Tet3 GapmeRs. *, p<0.05 vs. scrambled GapmeR; two-way repeated measure ANOVA followed by Holm-Sidak test.
Figure 4.
Figure 4.. Intra-renal administration of anti-Dnmt3a/Tet3 GapmeR’s results in differential methylation in the renal outer medulla of SS rats.
A. Heatmap based on DNA methylation profiles in the renal outer medulla. Each row represents a CpG site, and each column depicts methylation data from an individual rat. The color bar at the top of the graph indicates grouping of rats based on experimental conditions. B. Principal component analysis using DNA methylation profiles in the renal outer medulla. Each dot indicates a sample. Samples with the same color belong to the same group of rats. C-E. Number and associated Gene Ontology terms for genomic regions differentially methylated in the HS_SCR group compared with the 0.4% salt group (C), the HS_DT group compared with the 0.4% salt group (D), and the HS_SCR group compared with HS_DT group (E). HS_SCR, SS rats treated with intra-renal administration of a scrambled GapmeR (4 mg/kg) and fed the 4% NaCl diet for 7 days; HS_DT, SS rats treated with intra-renal administration of GapmeR’s targeting Dnmt3a and Tet3 (2 mg/kg each) and fed the 4% NaCl diet for 7 days; 0.4% salt, SS rats surgically prepared in the same way as rats in HS_SCR and HS_DT groups but used for tissue collection just prior to when GapmeR and high-salt diet would have been given; DMR, differentially methylated regions; TSS, transcriptional start site regions; GOTERM_MF, molecular function terms in Gene Ontology; BH, Benjamini-Hochberg method.
Figure 5.
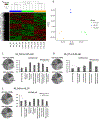
Figure 5.. Intra-renal administration of anti-Dnmt3a/Tet3 GapmeR’s substantially prevents changes in gene expression induced by high salt diet.
A. Heatmap based on RNA expression profiles in the renal outer medulla. Each row represents a transcript, and each column depicts RNA abundance data from an individual rat. The color bar at the top of the graph indicates grouping of rats based on experimental conditions. B. Principal component analysis using gene expression profiles in the renal outer medulla. Each dot indicates a sample. Samples with the same color belong to the same group of rats. C. Of 1,712 genes differentially expressed between HS_SCR and 0.4% salt groups, 1,294 (or 76%) were not differentially expressed between HS_DT and 0.4% salt groups. Numbers in the venn diagram represent numbers of differentially expressed genes. D. Of the 1,294 genes shown in blue in panels B and C, 328 were significantly differentially expressed between HS_SCR and HS_DT groups. See Figure 4 for abbreviations of group names.
Figure 6.
Figure 6.. Genes significantly differentially expressed and differentially methylated in response to intra-renal administration of anti-Dnmt3a/Tet3 GapmeR’s.
12 of the 328 differential expressed genes shown in panel D of Figure 5 were associated with genomic regions differentially methylated between rats treated with scrambled GapmeR (HS_SCR) and GapmeR’s targeting Dnmt3a and Tet3 (HS_DT). The difference between the two groups was statistically significant (FDR<0.05) in each panel (mean values were plotted). All differentially methylated regions are located in intragenic regions, except that the regions associated with Adamts9 and XLOC_022899 are located in transcriptional start site regions.

Comment in

  • De Novo DNA (de)Methylation in the Kidney.
    Zhuo JL, Li XC. Zhuo JL, et al. Hypertension. 2018 Nov;72(5):1084-1086. doi: 10.1161/HYPERTENSIONAHA.118.11755. Hypertension. 2018. PMID: 30354833 Free PMC article. No abstract available.

References

    1. Okano M, Bell DW, Haber DA, Li E. DNA methyltransferases Dnmt3a and Dnmt3b are essential for de novo methylation and mammalian development. Cell. 1999;99(3):247–57. - PubMed
    1. Wu X, Zhang Y. TET-mediated active DNA demethylation: mechanism, function and beyond. Nat Rev Genet. 2017; 18(9):517–534. - PubMed
    1. Smith ZD, Meissner A. DNA methylation: roles in mammalian development. Nat Rev Genet. 2013;14(3):204–20. - PubMed
    1. Baccarelli A, Rienstra M, Benjamin EJ. Cardiovascular epigenetics: basic concepts and results from animal and human studies. Circ Cardiovasc Genet. 2010;3(6):567–73. - PMC - PubMed
    1. Liang M, Cowley AW Jr, Mattson DL, Kotchen TA, Liu Y. Epigenomics of hypertension. Semin Nephrol. 2013;33(4):392–9. - PMC - PubMed

Publication types

Substances