. 2018 Dec 15;29(26):3183-3200.
doi: 10.1091/mbc.E18-08-0515. Epub 2018 Oct 24.

Methionine coordinates a hierarchically organized anabolic program enabling proliferation

Affiliations

Methionine coordinates a hierarchically organized anabolic program enabling proliferation

Adhish S Walvekar et al. Mol Biol Cell. .

Abstract

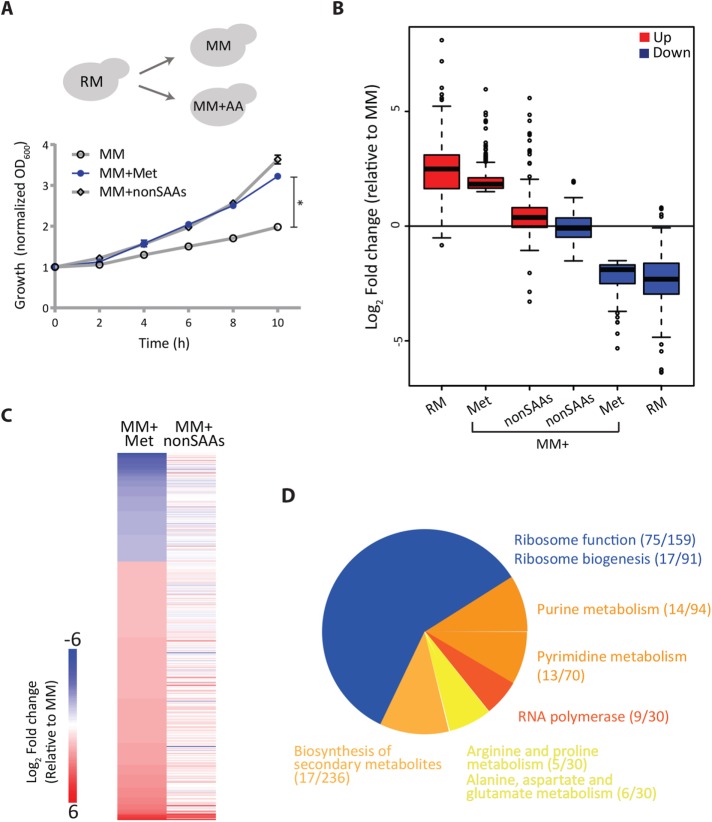
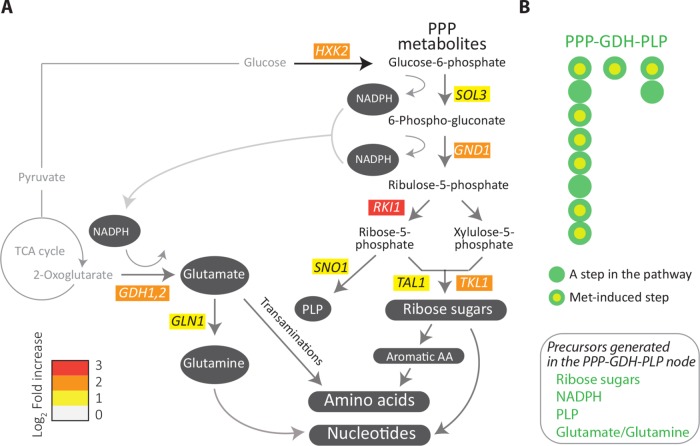
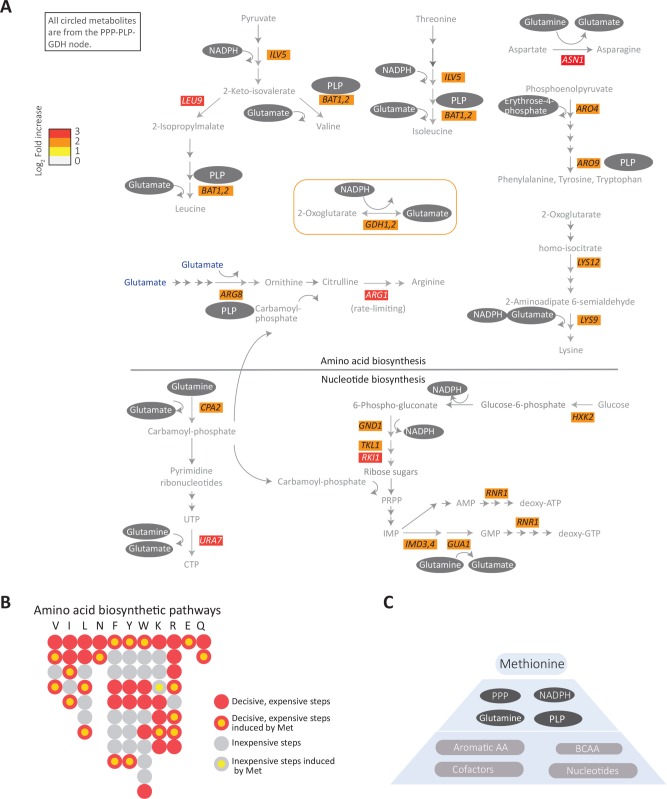
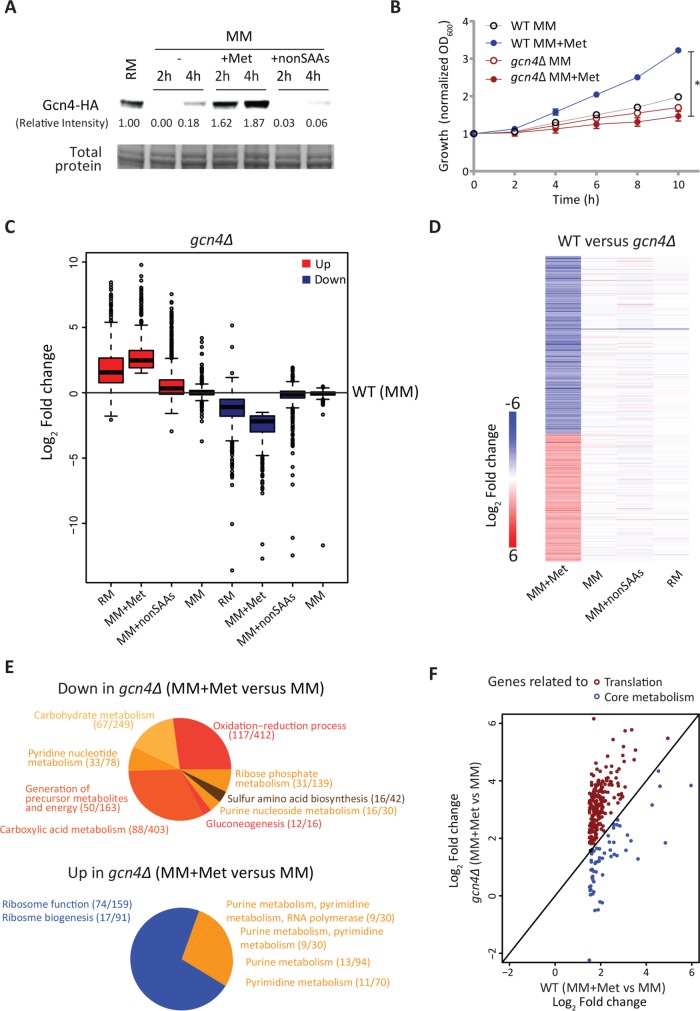
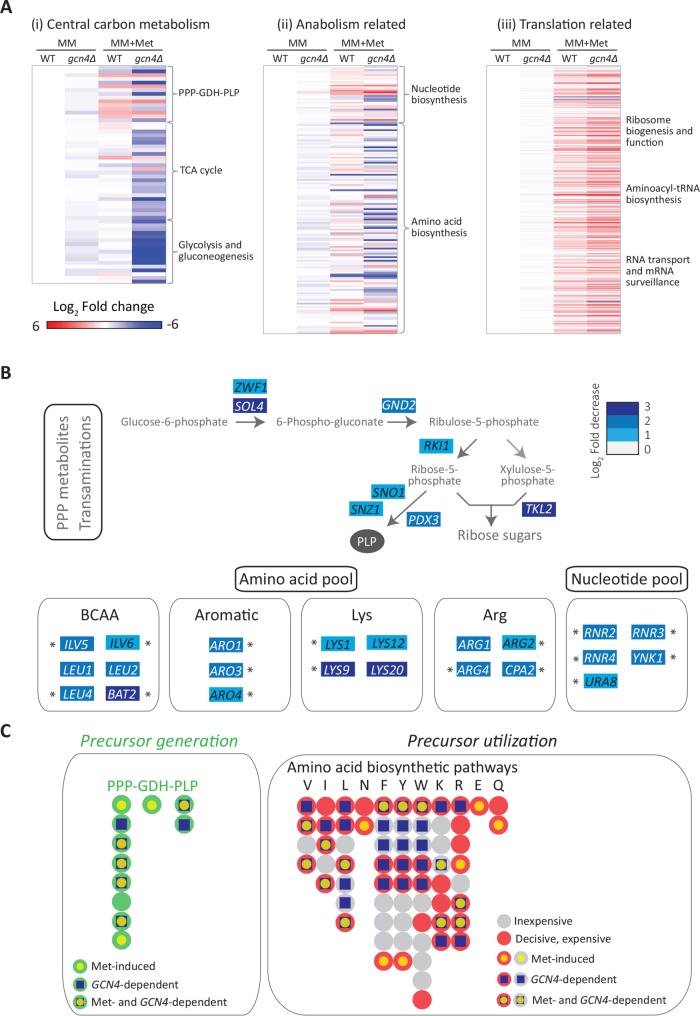
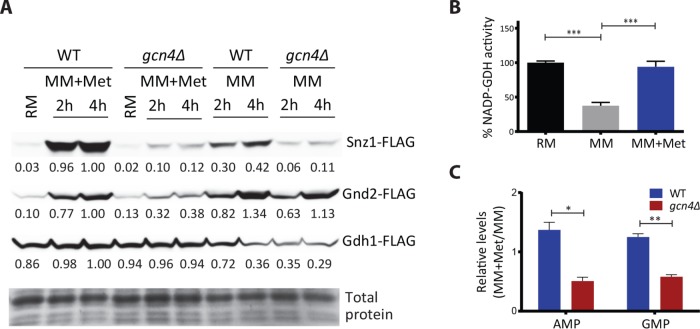
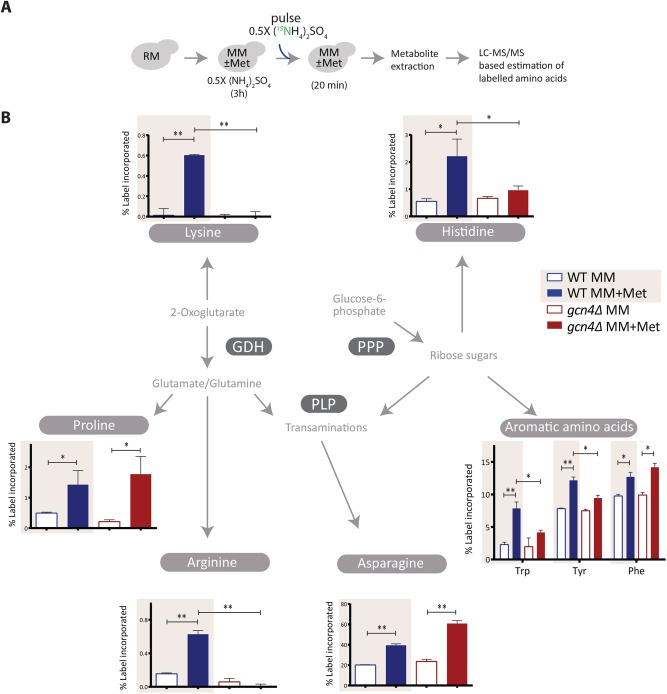
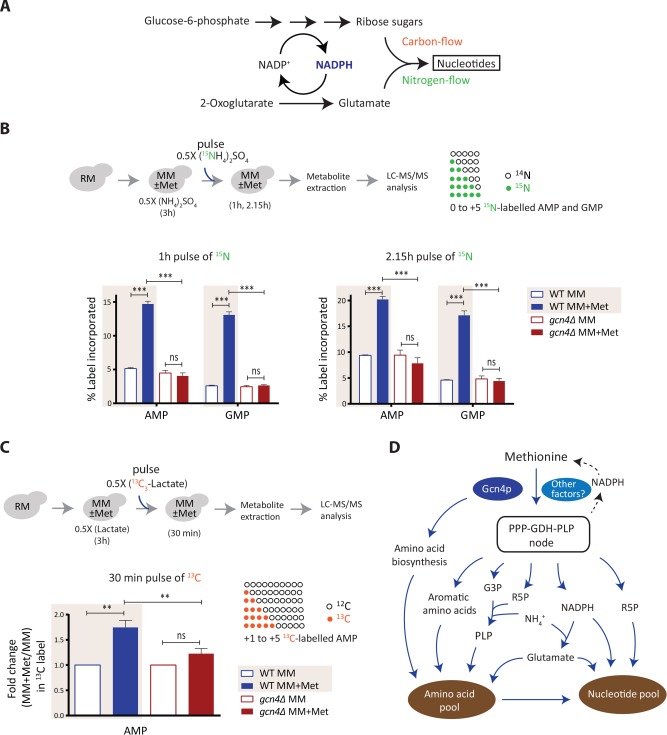
Methionine availability during overall amino acid limitation metabolically reprograms cells to support proliferation, the underlying basis for which remains unclear. Here we construct the organization of this methionine-mediated anabolic program using yeast. Combining comparative transcriptome analysis and biochemical and metabolic flux-based approaches, we discover that methionine rewires overall metabolic outputs by increasing the activity of a key regulatory node. This comprises the pentose phosphate pathway (PPP) coupled with reductive biosynthesis, the glutamate dehydrogenase (GDH)-dependent synthesis of glutamate/glutamine, and pyridoxal-5-phosphate (PLP)-dependent transamination capacity. This PPP-GDH-PLP node provides the required cofactors and/or substrates for subsequent rate-limiting reactions in the synthesis of amino acids and therefore nucleotides. These rate-limiting steps in amino acid biosynthesis are also induced in a methionine-dependent manner. This thereby results in a biochemical cascade establishing a hierarchically organized anabolic program. For this methionine-mediated anabolic program to be sustained, cells co-opt a "starvation stress response" regulator, Gcn4p. Collectively, our data suggest a hierarchical metabolic framework explaining how methionine mediates an anabolic switch.


Figures

FIGURE 1:
FIGURE 1:
Methionine mediates a transcriptional rewiring reflecting a “growth state.” (A) Methionine and cell proliferation during amino acid limitation. Shown are growth profiles of WT cells grown in rich medium (RM) and shifted to minimal medium (MM) with or without the indicated amino acid supplements (2 mM each; nonSAAs indicates all the nonsulfur amino acids except tyrosine). The growth profile with methionine is in blue (n = 4). (B) Global trends of gene expression in RM and methionine supplemented MM. The boxplot shows fold changes in gene expression levels of two gene classes (up- or down-regulated) relative to MM for cells grown in different amino acid combinations (RM, MM + Met, MM + nonSAAs). The gene classes were defined as those genes that had a significant change (up in red, Met-induced; down in blue, Met-repressed) in MM + Met relative to MM. Also see Supplemental File E1 for gene lists. (C) Effect of methionine on a global transcriptional response in cells. The heat map shows differentially expressed genes in cells grown in MM plus methionine compared with MM (left column), with cells grown in MM plus nonSAAs compared with MM (right column). Also see Supplemental file E1 for gene lists and Supplemental Figures 2 and 3 for related volcano plots and cladograms. (D) GO-based analysis of the methionine-induced genes. The pie chart depicts the processes grouped by GO analysis for the up-regulated transcripts between MM plus methionine and MM set. Numbers in the bracket indicate the number of genes from the query set/ total number of genes in the reference set for the given GO category. Also see Supplemental File E2 for GO annotations and Supplemental Figure 6 for related GO groupings.
FIGURE 2:
FIGURE 2:
Methionine uniquely induces the PPP-GDH-PLP node. (A) Metabolic pathways induced by methionine. Illustration of the results of a manual regrouping of the methionine responsive genes into their relevant metabolic pathways, restricted only to central carbon metabolism, and subsequent anabolic processes. The pathway map includes individual genes in central carbon metabolism which are induced by methionine (indicating the fold changes in gene expression). The color bar indicates the fold increase in gene expression. (B) A bird’s-eye view description of the PPP-GDH-PLP node regulated by methionine. Each bead (or filled circle) represents a step in the pathway (see details in Supplemental Figures 4 and 5). Methionine-induced steps are shown with a yellow fill at the centre of the circle for the given step. Precursors generated through this node are shown in the inset; p = 1.2 × 10⁻⁶ (Fisher’s exact test) for the methionine-dependent induction of the PPP-GDH-PLP node.
FIGURE 3:
FIGURE 3:
Methionine sets up a hierarchical metabolic response leading to anabolism. (A) Grouping of the methionine-induced genes, focusing on amino acid and nucleotide metabolism. The schematic shows the methionine-responsive genes in various amino acid and nucleotide biosynthesis pathways, along with their fold changes in gene expression (indicated by the color bar). The substrates/cofactors produced by the PPP-GDH-PLP node (see Figure 2) for the individual steps in these pathways is also mapped on to the schematic. Note that all gene products induced by methionine in these pathways use PPP intermediates, NADPH, PLP and/or glutamine/glutamate (indicated within gray ovals) in their biochemical reactions. (B) A bird’s-eye view description of the amino acid biosynthesis steps regulated by methionine, with metabolically expensive or inexpensive steps indicated. Each bead (or filled circle) represents a step in the pathway (prepared according to the individual amino acid pathways shown at https://pathway.yeastgenome.org/; details in Supplemental Figures 4 and 5). A step is considered expensive (red) when it is either the entry point or the exit point or if it involves ATP utilization or reduction. All the rest of the steps are considered inexpensive (gray). Methionine-induced steps are shown with a yellow fill at the centre of the circle for the given step. p = 7.4e-5 (Fisher’s exact test) for methionine-dependent induction of genes encoding the critical, rate-limiting, or costly steps in amino acid biosynthesis (not significant for the inexpensive steps). (C) A proposed hierarchical organization of the methionine-mediated anabolic remodeling. Methionine induces expression of genes in the PPP-GDH-PLP node, which provides precursors for the key steps in the biosynthesis of all other amino acids and nucleotides, and these steps are also directly induced by methionine.
FIGURE 4:
FIGURE 4:
The anabolic program induced by methionine requires GCN4. (A) Gcn4p is induced by methionine. Gcn4p amounts were detected by Western blotting of WT cells (expressing Gcn4p with an HA epitope, tagged at the endogenous locus) shifted from RM to MM or MM supplemented with the indicated combinations of amino acids. A representative blot is shown (n = 3). Also see Supplemental Figure 7A. (B) GCN4 is necessary for methionine-mediated increased growth. WT and gcn4Δ cells were shifted from RM to MM with or without methionine supplementation and growth was monitored. Also see Supplemental Figure 7B (n = 4). (C) Trends of gene expression in RM and methionine supplemented MM in gcn4Δ cells. Gene expression levels of transcripts in gcn4Δ cells grown in RM or shifted to MM or MM plus methionine or MM plus nonSAAs were compared with only the WT MM set. Also see Supplemental File E1 for related gene lists and Supplemental Figure 8 for related volcano plots. (D) Global transcriptional response in the absence of GCN4. The heat map shows differentially expressed genes (log2 1.5-fold change; p < 10-4) between WT and gcn4Δ cells in the respective growth conditions. Also see Supplemental File E1 for related gene lists and Supplemental Figure 8 for related volcano plots. (E) GO-based analysis of the methionine-responsive genes in gcn4Δ cells. A pie chart showing the processes grouped by GO analysis for the up-regulated and down-regulated transcripts between MM + methionine and MM sets in the gcn4Δ background. Numbers in the bracket indicate the number of genes from the query set/total number of genes in the reference set for the given GO category. Also see Supplemental file E2 for related GO groupings. (F) The methionine-induced metabolic program requires GCN4. Categorization of the GCN4-dependent transcripts in the presence of methionine, as related to metabolism, or translation. The expression level of the methionine-responsive transcripts related to metabolism and translation in WT set (MM plus methionine vs. MM) was compared with the gcn4Δ background. The genes related to the metabolic steps described in Figures 1 and 2 are marked with blue circles, while genes related to ribosome biogenesis and function are marked with red circles. Also see Supplemental Figure 9 for the list of GCN4-dependent genes related to metabolism, picked up in this analysis. In all panels, data shows mean ± SD. *p < 0.05.
FIGURE 5:
FIGURE 5:
In methionine-rich medium the absence of GCN4 results in an anabolic failure. (A) Global transcriptional response in the presence of methionine in WT cells or cells lacking GCN4. The heat maps show transcript abundances of 1) genes involved in central carbon metabolism (including the PPP-GDH-PLP node), 2) anabolism (including amino acid biosynthesis), and 3) translation related processes in the respective growth conditions and genetic backgrounds. Note: compared with WT cells, the loss of GCN4 shows little effect in MM. In cells supplemented with methionine, cells lacking GCN4 have a strongly reduced central carbon metabolism component (p = 2.2 × 10⁻¹⁶) and anabolic component (p = 4.1 × 10⁻⁸) and increased translation component (p = 2.2 × 10⁻¹⁶) (Fisher’s exact tests). (B) GCN4 is required for the metabolic program due to methionine. Grouping of the GCN4-dependent genes based on the defined PPP-GDH-PLP–dependent metabolic node. The schematic shows the GCN4-dependent genes (comparison of MM plus methionine set between WT and gcn4Δ) in the PPP, amino acid, and nucleotide biosynthesis pathways, along with fold changes in gene expression. The arrows marked blue in the PPP are the steps down-regulated in gcn4Δ cells. The rate-limiting steps in the pathway are marked by an asterisk. (C) A bird’s-eye view depiction of the methionine-induced genes and the GCN4-dependent genes (in the presence of methionine) mapped onto pathways that either generate biosynthetic precursors or pathways that utilize these precursors. The left panel shows steps induced by methionine in WT cells and the GCN4 dependence (in methionine medium) for the PPP-GDH-PLP node. The right panel shows the critical, expensive steps or the inexpensive steps in amino acid biosynthesis pathways (details in Supplemental Figures 4 and 5), with a mapping of these as methionine-induced and/or GCN4 dependent. Each bead (or filled circle) represents a step in the pathway (prepared as shown in Figure 3B). For the given step, methionine-induced steps are shown with a yellow fill at the center of the circle, and GCN4-dependent steps are shown with a blue square at the center of the circle. Left panel, p = 4.2 × 10⁻³ (Fisher’s exact test) for GCN4-dependent genes that control the PPP-GDH-PLP node. Right panel, p = 7 × 10⁻³ (Fisher’s exact test) for GCN4-dependent genes encoding the critical, rate-limiting steps in amino acid biosynthetic pathways.
FIGURE 6:
FIGURE 6:
The PPP-GDH-PLP nodal enzymes are methionine dependent and largely GCN4 dependent. (A) Snz1p, Gnd2p, and Gdh1p amounts in WT or gcn4Δ cells, with methionine in the medium as the variable. WT and gcn4Δ cells expressing FLAG-tagged Snz1p or Gnd2p or Gdh1p were shifted from RM to MM or MM plus methionine, and amounts of these proteins were detected by Western blotting. A representative blot is shown in each case (n = 2). Also see Supplemental Figure 10. (B) NADP-dependent glutamate dehydrogenase activity with methionine in the medium as a variable. Crude extracts of WT cells grown in RM and shifted to MM or MM plus methionine were analyzed for intracellular biosynthetic NADP–glutamate dehydrogenase activity (n = 4). (C) Relative nucleotide amounts in the presence of methionine in WT or gcn4Δ cells. WT and gcn4Δ cells grown in RM were shifted to MM (4 h) with and without methionine, and the relative amounts of AMP and guanosine 5’-monophosphate (GMP) from metabolite extracts of the respective samples were measured by LC-MS/MS (n = 2 biological replicates, with technical replicates). In all panels, data indicate mean ± SD. *p < 0.05, **p < 0.01, ***p < 0.001.
FIGURE 7:
FIGURE 7:
Methionine increases amino acid biosynthesis. (A) A schematic showing the experimental design of 15N pulse-labeling experiment to measure amino acid biosynthetic flux. Cells were shifted to MM with and without methionine and maintained for 3 h, 15N-ammonium sulfate was pulsed into the medium, and the indicated, labeled metabolites were measured. (B) Methionine increases amino acid biosynthesis in a GCN4-dependent manner. 15N label incorporation into newly synthesized amino acids in WT and gcn4Δ cells was measured, as shown in A. For all the labeled moieties, fractional abundance of the label was calculated. Also see Supplemental Figure 11 for the label incorporation kinetics experiment and Supplemental Table 2 for mass spectrometry parameters (n = 2 biological replicates, with technical replicates). In all panels, data indicate mean ± SD. *p < 0.05, **p < 0.01.
FIGURE 8:
FIGURE 8:
Methionine increases nucleotide biosynthesis. (A) Schematic showing carbon and nitrogen inputs in nucleotide biosynthesis and their coupling to the PPP/NADPH metabolism. (B) Methionine increases nucleotide biosynthesis in a GCN4-dependent manner. The WT and gcn4Δ cells treated and pulse-labeled with 15N ammonium sulfate as illustrated in the top panel. For all the labeled moieties, fractional increase of the incorporated label was calculated to measure newly synthesized AMP and GMP (also see Supplemental Figure 12 for cytidine 5’-monophosphate [CMP] and uridine 5’-monophosphate [UMP]) (n = 3). (C) Methionine enhances carbon flux into AMP biosynthesis. An experimental setup similar to that in B was employed, using 13C-lactate for carbon labeling. Label incorporation into nucleotides (from +1 to +5) was accounted for calculations. (Note: GMP could not be estimated because of MS/MS signal interference from unknown compounds in the metabolite extract) (n = 2 biological replicates, with technical replicates.) (D) A model illustrating how methionine triggers an anabolic program leading to cell proliferation. Methionine promotes the synthesis of PPP metabolites, PLP, NADPH, and glutamate (up-regulated genes in the pathways are shown in blue), which directly feed into nitrogen metabolism. As a result, methionine activates biosynthesis of amino acids and nucleotides, allowing the cells to grow in amino acid limiting medium. GCN4 is required to sustain this anabolic program. In all panels data indicate mean ± SD. ns: nonsignificant difference, **p < 0.01, ***p < 0.001.

Similar articles

Cited by

References

    1. Alam MT, Zelezniak A, Mülleder M, Shliaha P, Schwarz R, Capuano F, Vowinckel J, Radmanesfahar E, Krüger A, Calvani E, et al. (2016). The metabolic background is a global player in Saccharomyces gene expression epistasis. Nat Microbiol , 15030. - PMC - PubMed
    1. Barton MD, Delneri D, Oliver SG, Rattray M, Bergman CM. (2010). Evolutionary systems biology of amino acid biosynthetic cost in yeast. PLoS One , e11935. - PMC - PubMed
    1. Bi M, Naczki C, Koritzinsky M, Fels D, Blais J, Hu N, Harding H, Novoa I, Varia J, Raleigh J, et al. (2005). ER stress-regulated translation increases tolerance to extreme hypoxia and promotes tumor growth. EMBO J , 3470–3481. - PMC - PubMed
    1. Boer VM, Amini S, Botstein D. (2008). Influence of genotype and nutrition on survival and metabolism of starving yeast. Proc Natl Acad Sci USA , 6930–6935. - PMC - PubMed
    1. Boer VM, Crutchfield CA, Bradley PH, Botstein D, Rabinowitz JD. (2010). Growth-limiting intracellular metabolites in yeast growing under diverse nutrient limitations. Mol Biol Cell , 198–211. - PMC - PubMed

Publication types

MeSH terms