. 2018 Sep 28;123(8):986-995.
doi: 10.1161/CIRCRESAHA.118.313341.

Effect of Intracoronary Metformin on Myocardial Infarct Size in Swine

Affiliations

Effect of Intracoronary Metformin on Myocardial Infarct Size in Swine

George Techiryan et al. Circ Res. .

Abstract

Rationale: Metformin has been demonstrated to decrease infarct size (IS) and prevent postinfarction left ventricular (LV) remodeling in rodents when given intravenously at the time of reperfusion. It remains unclear whether similar cardioprotection can be achieved in a large animal model.

Objective: The objective of this study was to determine whether intravascular infusion of metformin at the time of reperfusion reduces myocardial IS in a porcine model of acute myocardial infarction.

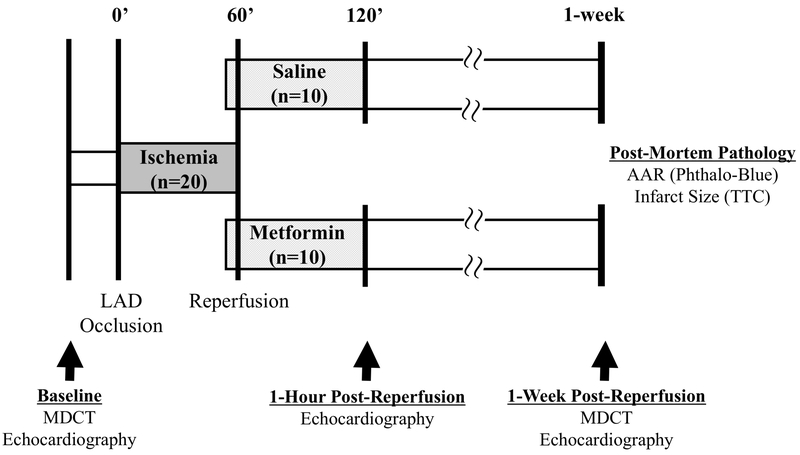
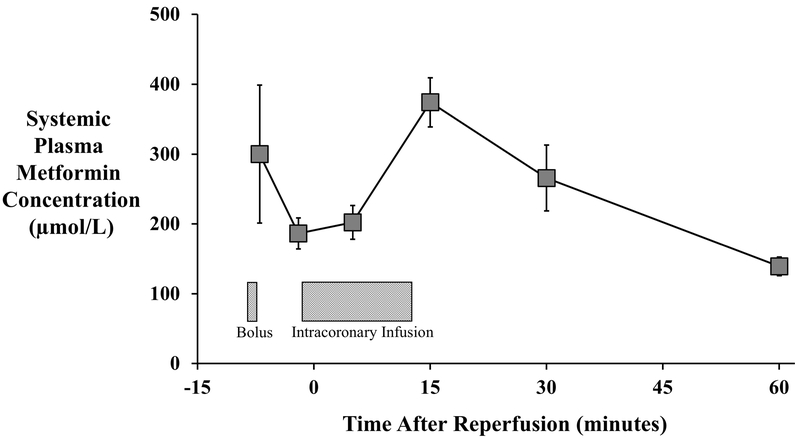
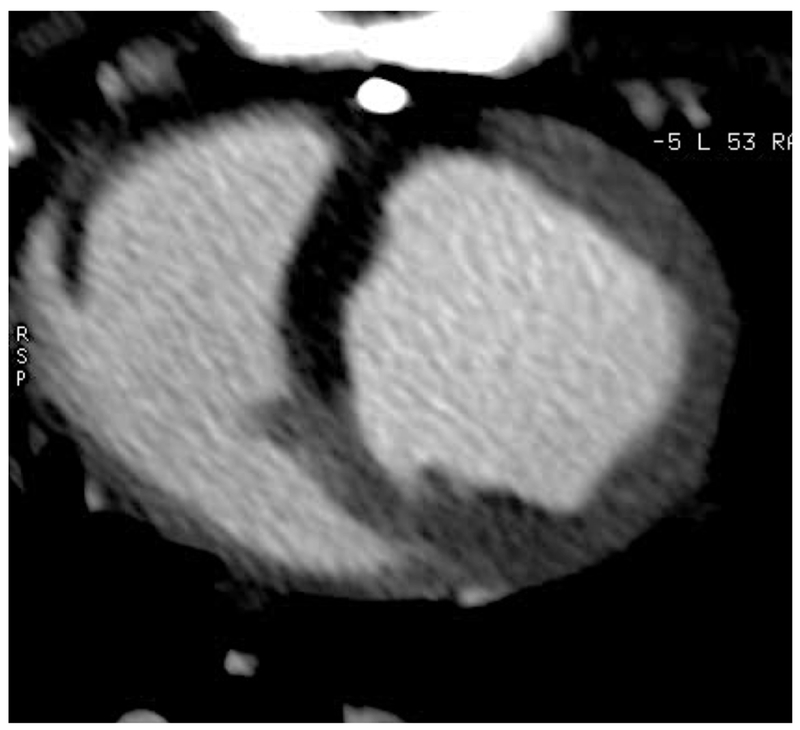
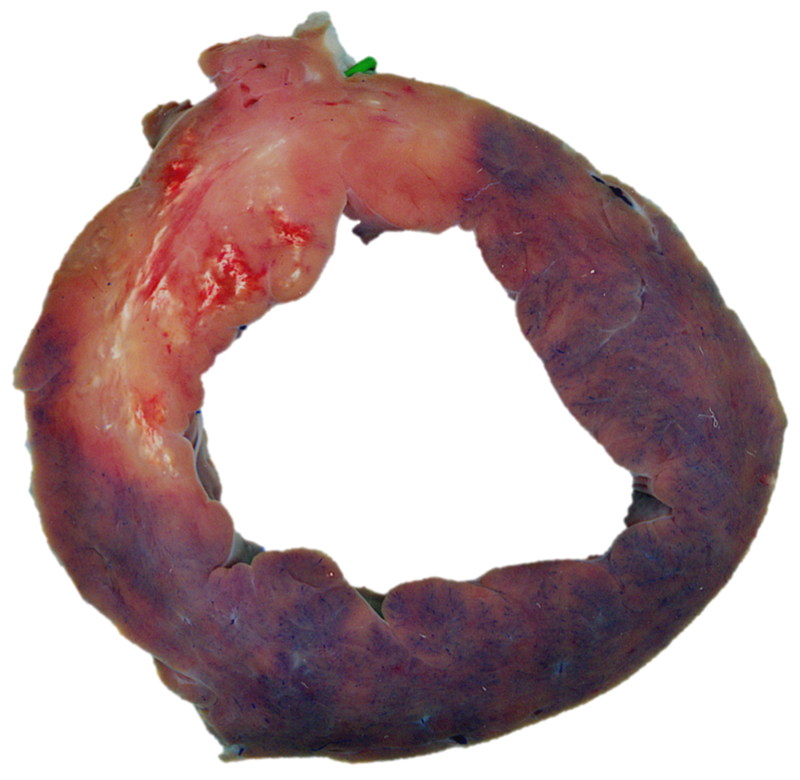
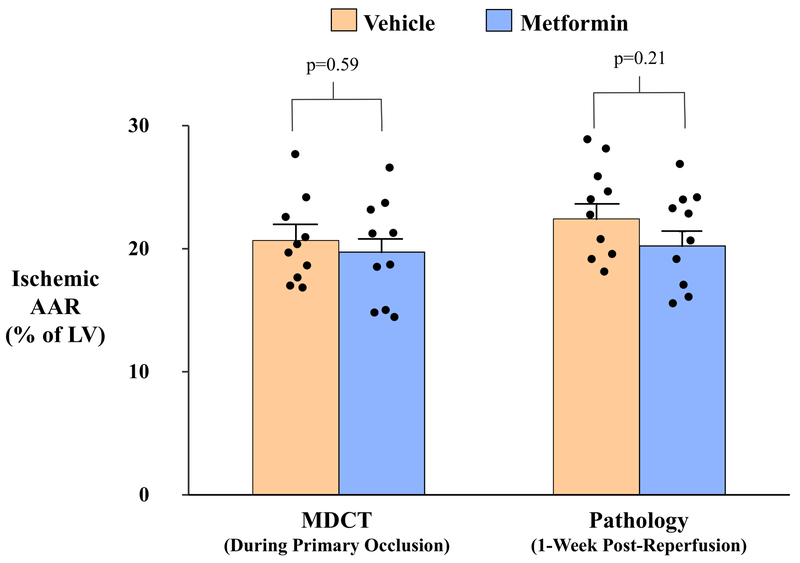
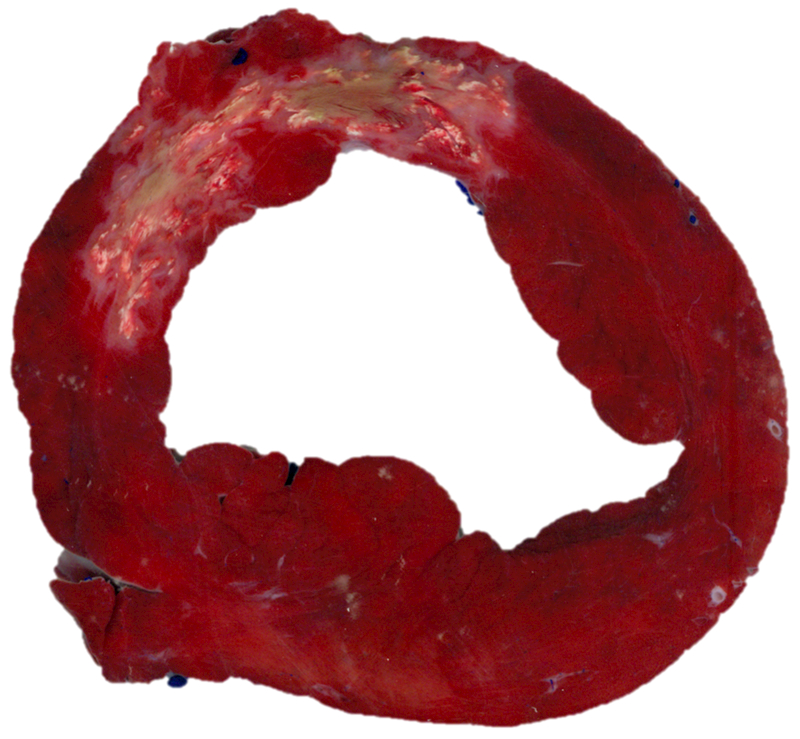
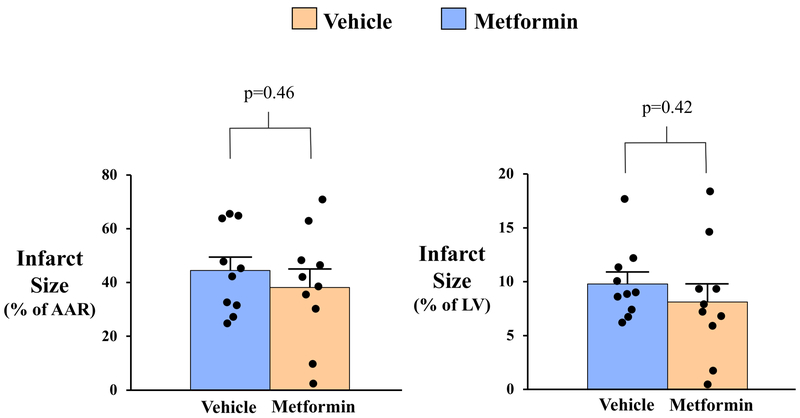
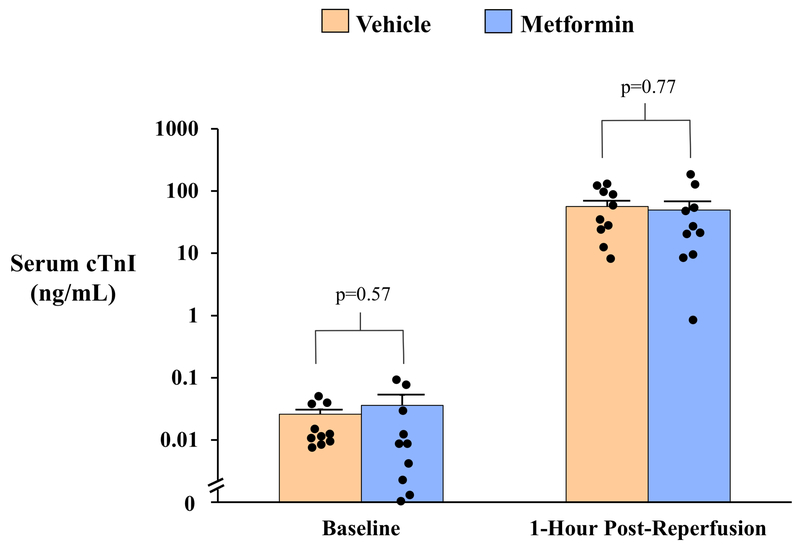
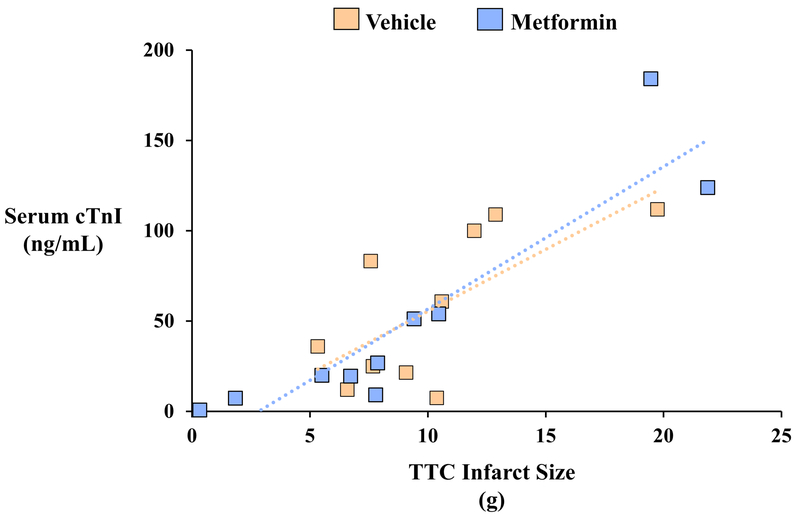
Methods and results: In a blinded and randomized preclinical study, closed-chest swine (n=20) were subjected to a 60-minute left anterior descending coronary artery occlusion to produce myocardial infarction. Contrast-enhanced computed tomography was performed during left anterior descending coronary artery occlusion to assess the ischemic area-at-risk. Animals were randomized to receive either metformin or vehicle as an initial intravenous bolus (5 mg/kg) 8 minutes before reperfusion, followed by a 15-minute left coronary artery infusion (1 mg/kg per minute) commencing with the onset of reperfusion. Echocardiography and computed tomographic imaging of LV function were performed 1 week later, at which time the heart was removed for postmortem pathological analysis of area-at-risk and IS (triphenyltetrazolium chloride). Baseline variables including hemodynamics and LV function were similar between groups. Peak circulating metformin concentrations of 374±35 µmol/L were achieved 15 minutes after reperfusion. There was no difference between the area-at-risk as a percent of LV mass by computed tomography (vehicle: 20.7%±1.1% versus metformin: 19.7%±1.3%; P=0.59) or postmortem pathology (22.4%±1.2% versus 20.2%±1.2%; P=0.21). IS relative to area-at-risk averaged 44.5%±5.0% in vehicle-treated versus 38.2%±6.8% in metformin-treated animals ( P=0.46). There was no difference in global function 7 days after myocardial infarction as assessed by echocardiography or computed tomographic ejection fraction (56.2%±2.6% versus 56.3%±2.4%; P=0.98).

Conclusions: In contrast to rodent hearts, postconditioning with high-dose metformin administered immediately before reperfusion does not reduce IS or improve LV function 7 days after myocardial infarction in swine. These results reinforce the importance of rigorously testing therapies in large animal models to facilitate clinical translation of novel cardioprotective therapies.

Keywords: infarction; metformin; models, animal; myocardial infarction; ventricular remodeling.


Figures

Figure 1:
Figure 1:. Experimental protocol.
All study personnel were blinded to treatment allocation until completion of data collection and analysis. Following baseline data collection including echocardiography and multi-detector computed tomography (MDCT) imaging, swine were subjected to a 60-minute occlusion of the left anterior descending (LAD) coronary artery in the closed-chest state. Contrast-enhanced MDCT was performed 5 minutes after the onset of LAD occlusion for assessment of the ischemic area-at-risk (AAR). Eight minutes prior to reperfusion, a bolus of metformin (5 mg/kg) or saline (vehicle) was administered via intravenous infusion in blinded fashion. Two minutes prior to reperfusion, an intracoronary infusion of metformin (1 mg/mL/min) or saline was initiated through the guide catheter engaged in the LAD and maintained until 15 minutes after reperfusion. Serial echocardiography was performed to assess LV function and MDCT imaging was repeated 1-week post-reperfusion to assess infarct size and LV ejection fraction. Immediately prior to euthanasia, the LAD was re-occluded, phthalocyanine blue was administered, and the heart was excised for post-mortem assessment of the ischemic AAR and infarct size. Please see text for additional details. LAD indicates left anterior descending coronary artery; MDCT, multi-detector computed tomography; AAR, area-at-risk; TTC, triphenyl tetrazolium chloride.
Figure 2:
Figure 2:. Plasma Metformin Concentrations.
Serial plasma samples were obtained to assess metformin levels via high pressure liquid chromatography-mass spectroscopy (HPLC-MS; n=4). The total dose of metformin administered (including the IV bolus and 15-minute intracoronary infusion) was 691.1±30.9 mg. The venous concentration at the onset of reperfusion averaged 24.1±2.9 µg/mL and rose to reach a peak of 48.3±4.5 µg/mL 15-minutes after reperfusion. Plasma metformin remained elevated after the infusion was stopped, with an average level of 18.0±1.7 µg/mL at 1-hour after reperfusion. Metformin levels were undetectable in all blood samples collected from saline-treated animals.
Figure 3:
Figure 3:. Quantification of the Ischemic Area-at-Risk.
The ischemic area-at-risk (AAR) was quantified by contrast-enhanced MDCT imaging during the primary index occlusion (A), as well as pathologically via coronary re-occlusion and injection of phthalocyanine blue 1-week after reperfusion immediately prior to euthanasia (B). Both methodologies demonstrated that the ischemic AAR was similar between vehicle- and metformin-treated animals (C). Solid black circles indicate data points for individual animals from each treatment group. AAR indicates area-at-risk; LV, left ventricle; MDCT, multi-detector computed tomography.
Figure 4:
Figure 4:. Quantification of Myocardial Infarct Size.
Post-mortem pathological analysis of myocardial infarct size was performed on 8mm-thick concentric rings of the left ventricle following triphenyl tetrazolium chloride (TTC) staining (A). Infarct size was similar between treatment groups when expressed relative to post-mortem pathology-based measurements of the ischemic area-at-risk (AAR; B, left panel) and as a percentage of left ventricular mass (B, right panel). Solid black circles indicate data points for individual animals from each treatment group. AAR indicates area-at-risk; LV, left ventricle.
Figure 5:
Figure 5:. Serum Cardiac Troponin I Concentrations After Myocardial Infarction.
Circulating serum concentrations of cardiac troponin I (cTnI) were quantified by a porcine-specific ELISA assay on venous blood collected at baseline and 1-hour after reperfusion. Serum cTnI values rose ~2,000-fold 1-hour after reperfusion but were not different between vehicle- and metformin-treated animals (A). A strong correlation was observed between serum cTnI 1-hour post-reperfusion and myocardial infarct size assessed by triphenyl tetrazolium chloride (TTC) staining 1-week later (r=0.84, p<0.01; B). Solid black circles indicate data points for individual animals from each treatment group. cTnI indicates cardiac troponin I; TTC, triphenyl tetrazolium chloride.

Comment in

  • Translation, Translation, Translation.
    Heusch G, Skyschally A, Kleinbongard P. Heusch G, et al. Circ Res. 2018 Sep 28;123(8):931-933. doi: 10.1161/CIRCRESAHA.118.313947. Circ Res. 2018. PMID: 30355042 No abstract available.

References

    1. Lefer DJ and Marban E. Is Cardioprotection Dead? Circulation. 2017;136:98–109. - PMC - PubMed
    1. Heusch G and Gersh BJ. The pathophysiology of acute myocardial infarction and strategies of protection beyond reperfusion: a continual challenge. EurHeart J. 2017;38:774–784. - PubMed
    1. Heusch G Molecular basis of cardioprotection: signal transduction in ischemic pre-, post-, and remote conditioning. Circ Res. 2015;116:674–99. - PubMed
    1. Pell VR, Chouchani ET, Murphy MP, Brookes PS and Krieg T Moving Forwards by Blocking Back-Flow: The Yin and Yang of MI Therapy. CircRes. 2016;118:898–906. - PMC - PubMed
    1. Varjabedian L, Bourji M, Pourafkari L and Nader ND Cardioprotection by Metformin: Beneficial Effects Beyond Glucose Reduction. Am J Cardiovasc Drugs. 2018. - PubMed

Publication types

MeSH terms