Review
. 2018 Sep 14;123(7):886-904.
doi: 10.1161/CIRCRESAHA.118.312806.

Age-Related Changes in Glucose Metabolism, Hyperglycemia, and Cardiovascular Risk

Affiliations
Review

Age-Related Changes in Glucose Metabolism, Hyperglycemia, and Cardiovascular Risk

Chee W Chia et al. Circ Res. .

Abstract

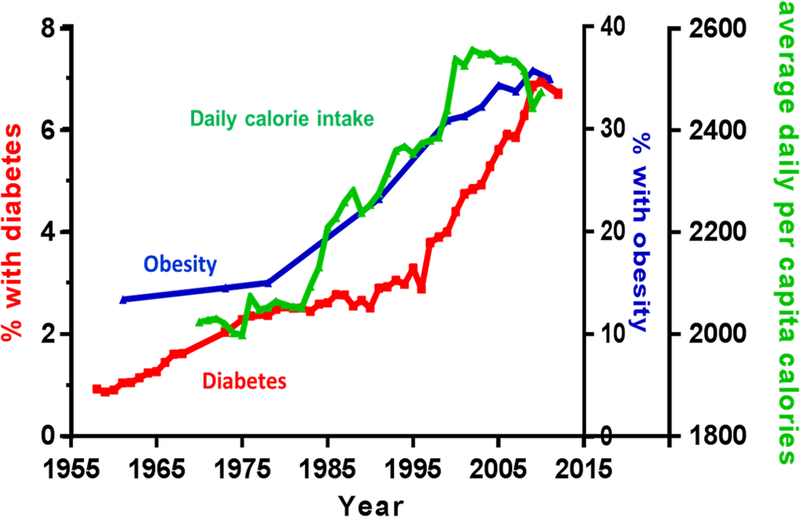
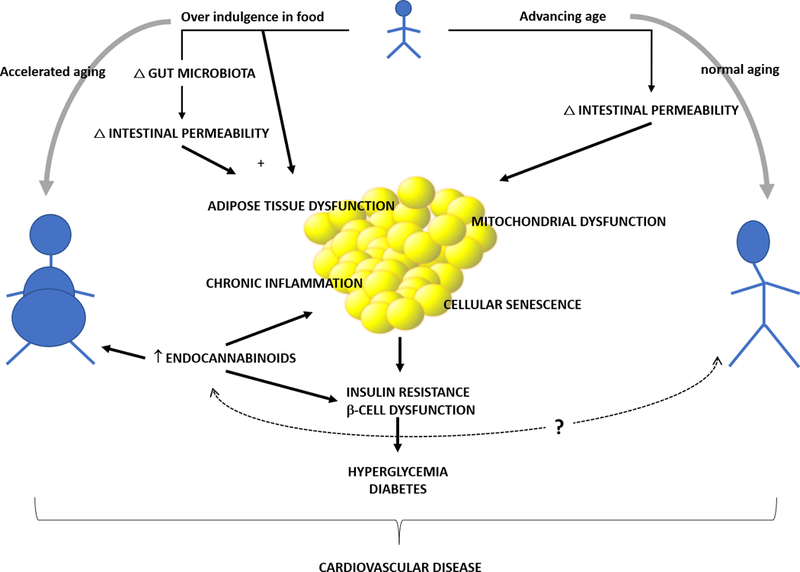
Aging and diabetes mellitus are 2 well-known risk factors for cardiovascular disease (CVD). During the past 50 years, there has been an dramatic increase in life expectancy with a simultaneous increase in the prevalence of diabetes mellitus in the older population. This large number of older individuals with diabetes mellitus is problematic given that CVD risk associated with aging and diabetes mellitus. In this review, we summarize epidemiological data relating to diabetes mellitus and CVD, with an emphasis on the aging population. We then present data on hyperglycemia as a risk factor for CVD and review the current knowledge of age-related changes in glucose metabolism. Next, we review the role of obesity in the pathogenesis of age-related glucose dysregulation, followed by a summary of the results from major randomized controlled trials that focus on cardiovascular risk reduction through glycemic control, with a special emphasis on older adults. We then conclude with our proposed model of aging that body composition changes and insulin resistance link possible dysregulation of physiological pathways leading to obesity and diabetes mellitus-both forms of accelerated aging-and risks for CVD.

Keywords: aging; cardiovascular diseases; diabetes mellitus; obesity; risk factors.


Figures

Figure 1:
Figure 1:
Selected participants from the Baltimore Longitudinal Study of Aging with data on A1c and OGTT that had no history of diabetes and were not on antidiabetic medication. Out of 1152 participants, 131 individuals were newly diagnosed with type 2 diabetes using either A1c, FPG or 2hG. Using FPG (yellow oval) alone identified 40 (31%) cases, 2hrG alone (red circle) identified 89 (68%) cases, and A1c alone (blue circle) identified 66 (51%) cases. If only FPG and A1c are used for diagnosis, more than one-third of those with diabetes would be missed.
Figure 2:
Figure 2:. Oral glucose tolerance test
Top panel shows OGTT results in 2,777 nondiabetic participants from the Baltimore Longitudinal Study of Aging. Each line corresponds to one decade. Plasma glucose levels during OGTT rise consecutively for every decade of age until they peaked at the 7th decade. Men and women have similar patterns with men having more severe glucose intolerance. Bottom panel shows the OGTT results adjusted for body mass index (BMI).
Figure 3:
Figure 3:
Dose-response curve for insulin-mediated whole-body glucose infusion rate during hyperglycemic clamps in young (---) young and old (—)subjects. Left panel presents glucose infusion rate in mg/kg body weight/min. Right panel presents glucose infusion adjusted for lean body mass. “x” represents basal hepatic production rate (reprint with permission). An age-associated decrease in glucose utilization was demonstrated with no change in maximal tissue responsiveness or maximal glucose uptake. The insulin-glucose dose-response curve shifts to the right with age (left panel). The half-maximal glucose uptake occurred when plasma insulin levels were 54 uU/mL in the young and 113 uU/mL in the old. This association held significance after accounting for lean body mass (right panel).
Figure 4:
Figure 4:
Bimodal time course of the endogenous plasma insulin response during 2h hyperglycemic clamps at four different hyperglycemic plateaus: 54, 98, 142, 230 mg/dL above basal glucose levels. Top panel: young participants; middle panel: middle age participants; bottom panel: old participants (reprint with permission). There is a first-phase insulin secretion that occurs during the first 10 min with a peak response at ~4 min; then, plasma insulin level falls reaching a nadir at ~ 10 min; next, the second insulin secretion phase begins and insulin levels increase linearly until a plateau is reached. Within each age group, higher glucose doses corresponded with statistically higher insulin responses at all levels but differences in insulin responses among the age groups were not significantly different.
Figure 5:
Figure 5:
Increase average daily per capita food consumption, prevalence of obesity and diabetes over the past 60 years in the United States (graphs drawn using data from the CDC and USDA). ,
Figure 6:
Figure 6:
A model of aging, body composition changes and insulin resistance that links the possible dysregulation of physiological pathways leading to obesity and diabetes, both a form of accelerated aging and risk factors for CVD, to chronic excessive food consumption. The changes in body composition that are intrinsically connected with the biology of aging together with over indulgence in food and the types of food modify gut microbiota. Changes in gut microbiota, together with excess food intake alter intestinal permeability which lead to absorption/infiltration of different types of molecules from the gut lumen including lipopolysaccharides (LPS), large molecules from the outer membrane of gram-negative bacteria. The excess calories and LPS may then lead to chronic inflammation and an upregulated endocannabinoid system, and, over time, increasing the amount of senescent cells and adipose tissue dysfunction. Excessive adipose accumulation then leads to insulin resistance and, in some people, eventually to diabetes. Diabetes and obesity are both forms of accelerated aging and independent risk factors for CVD. (Illustration Credit: Ben Smith).

References

    1. West LA, Cole S, Goodkind D and He W. 65+ in the United States: 2010. 2014.
    1. He W, Goodkind D and Kowal P. An Aging World: 2015; International Population Reports. 2016.
    1. Savji N, Rockman CB, Skolnick AH, Guo Y, Adelman MA, Riles T and Berger JS. Association between advanced age and vascular disease in different arterial territories: a population database of over 3.6 million subjects. Journal of the American College of Cardiology. 2013;61:1736–43. - PubMed
    1. Centers for Disease Control and Prevention. Long-term Trends in Diabetes, 2017 Atlanta, GA: Centers for Disease Control and Prevention, U.S. Dept of Health and Human Services; 2017 2017.
    1. Centers for Disease Control and Prevention. National Diabetes Statistics Report, 2017 Atlanta, GA: Centers for Disease Control and Prevention, U.S. Dept of Health and Human Services; 2017.

Publication types

MeSH terms