. 2018 Oct 24;19(1):770.
doi: 10.1186/s12864-018-5112-0.

Genomic comparison of Trypanosoma conorhini and Trypanosoma rangeli to Trypanosoma cruzi strains of high and low virulence

Affiliations

Genomic comparison of Trypanosoma conorhini and Trypanosoma rangeli to Trypanosoma cruzi strains of high and low virulence

Katie R Bradwell et al. BMC Genomics. .

Abstract

Background: Trypanosoma conorhini and Trypanosoma rangeli, like Trypanosoma cruzi, are kinetoplastid protist parasites of mammals displaying divergent hosts, geographic ranges and lifestyles. Largely nonpathogenic T. rangeli and T. conorhini represent clades that are phylogenetically closely related to the T. cruzi and T. cruzi-like taxa and provide insights into the evolution of pathogenicity in those parasites. T. rangeli, like T. cruzi is endemic in many Latin American countries, whereas T. conorhini is tropicopolitan. T. rangeli and T. conorhini are exclusively extracellular, while T. cruzi has an intracellular stage in the mammalian host.

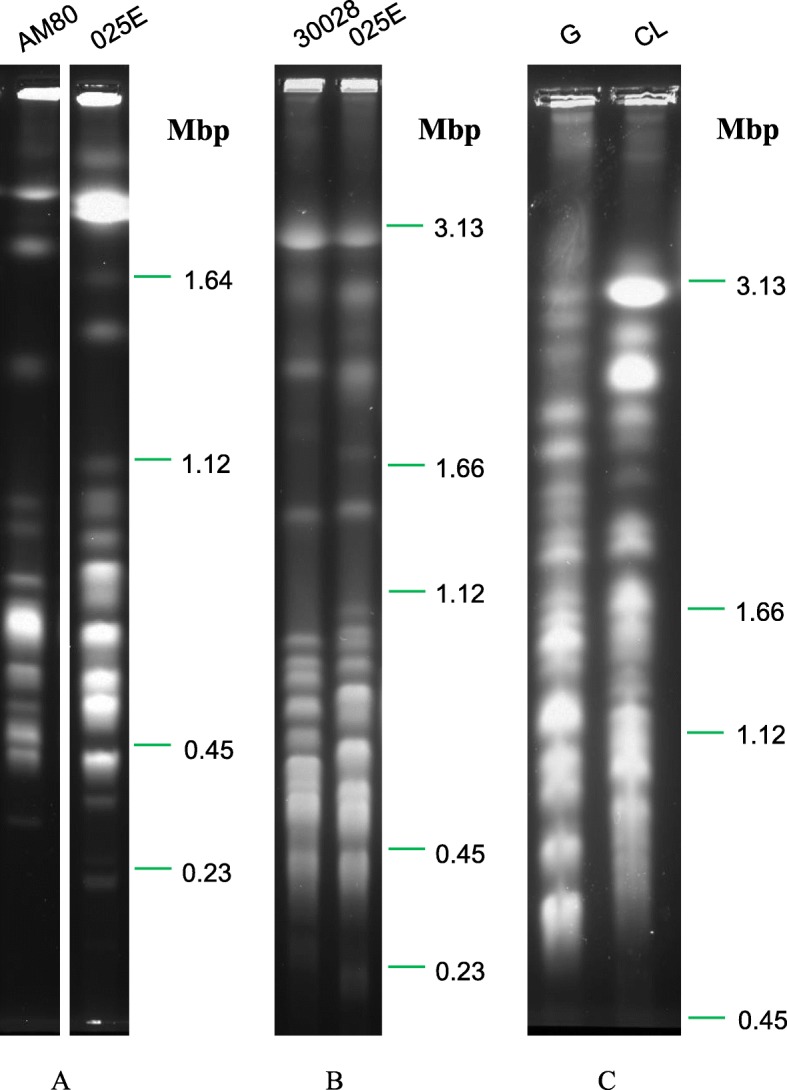
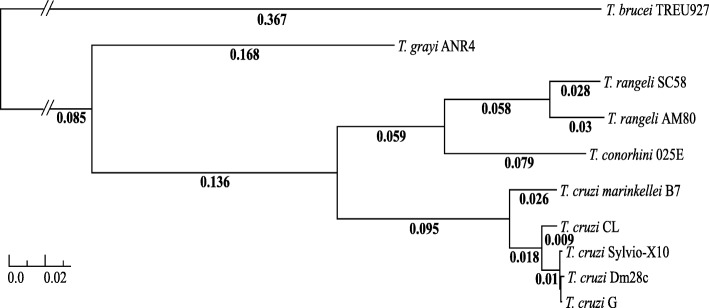
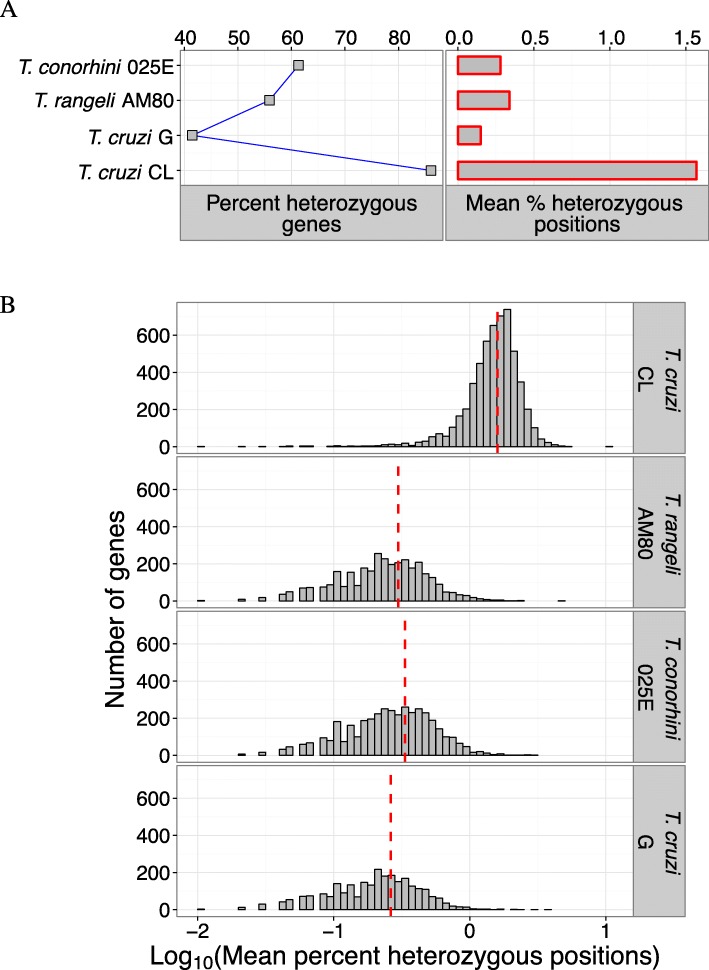
Results: Here we provide the first comprehensive sequence analysis of T. rangeli AM80 and T. conorhini 025E, and provide a comparison of their genomes to those of T. cruzi G and T. cruzi CL, respectively members of T. cruzi lineages TcI and TcVI. We report de novo assembled genome sequences of the low-virulent T. cruzi G, T. rangeli AM80, and T. conorhini 025E ranging from ~ 21-25 Mbp, with ~ 10,000 to 13,000 genes, and for the highly virulent and hybrid T. cruzi CL we present a ~ 65 Mbp in-house assembled haplotyped genome with ~ 12,500 genes per haplotype. Single copy orthologs of the two T. cruzi strains exhibited ~ 97% amino acid identity, and ~ 78% identity to proteins of T. rangeli or T. conorhini. Proteins of the latter two organisms exhibited ~ 84% identity. T. cruzi CL exhibited the highest heterozygosity. T. rangeli and T. conorhini displayed greater metabolic capabilities for utilization of complex carbohydrates, and contained fewer retrotransposons and multigene family copies, i.e. trans-sialidases, mucins, DGF-1, and MASP, compared to T. cruzi.

Conclusions: Our analyses of the T. rangeli and T. conorhini genomes closely reflected their phylogenetic proximity to the T. cruzi clade, and were largely consistent with their divergent life cycles. Our results provide a greater context for understanding the life cycles, host range expansion, immunity evasion, and pathogenesis of these trypanosomatids.

Keywords: Comparative genomics; Genome sequencing; Trypanosomatids.


Conflict of interest statement

Ethics approval and consent to participate

Not applicable.

Consent for publication

Not applicable.

Competing interests

The authors declare that they have no completing interests.

Publisher’s Note

Springer Nature remains neutral with regard to jurisdictional claims in published maps and institutional affiliations.

Figures

Fig. 1
Fig. 1
Karyotypes from three PFGE runs. 1% Megabase agarose gels (Bio-Rad) were loaded with agarose plugs bearing lysates of ~ 1 × 107 epimastigotes of each trypanosomatid strain for electrophoresis at 13.5 °C using the CHEF DR III System (Bio-Rad). Run conditions used for karyotyping each species were based empirically on their individual distributions of chromosome sizes. For separation of smaller chromosome size ranges, we used the following program - Block 1: 5 V/cm, 20–200 s, 18 h, 120°. Block 2: 3 V/cm, 200–300 s, 32 h, 120°. Block 3: 1.5 V/cm 500–1100 s, 12 h, 120°. The program used for separation of the largest chromosome size ranges was as follows - Block 1: 2 V/cm, 1500 s, 12 h, 98°. Block 2: 2 V/cm, 1800 s, 12 h, 106°. Block 3: 3 V/cm, 500 s, 38 h, 106°. Block 4: 5 V/cm, 20–200 s, 23 h, 120°. Block 5: 3 V/cm, 200–400 s, 34 h, 120°. (a) T. rangeli AM80 vs. T. conorhini 025E using Saccharomyces cerevisiae chromosome size-markers (Bio-Rad). (b) T. conorhini 30028 vs. T. conorhini 025E. (c) T. cruzi G vs. T. cruzi CL. Schizosaccharomyces pombe, Hansenula wingei and Saccharomyces cerevisiae chromosomes (Bio-Rad) were used as markers for (b) and (c)
Fig. 2
Fig. 2
Maximum Likelihood tree from 139 aligned and concatenated amino acid sequences. Support values are calculated from 1000 bootstrap replicates, all bootstrap values were 100% and thus not displayed. Scale bar indicates mean number of substitutions per site. A break in the branch to T. brucei was used to aid visualization since the branch was too long to display
Fig. 3
Fig. 3
Sequence diversity and functional enrichment across clustered genes. Called genes from each species were clustered using OrthoFinder v.0.7.1. This yielded 23,337 clusters, shown here using draw.quad.venn from the VennDiagram package of Rstudio v.3.0.2, together with percent hits to TriTrypDB v.24, KOG or PFAM databases in parentheses. Circles with solid lines indicate singleton genes (no paralogs or orthologs, i.e. classified as a ‘cluster of one’ for this analysis), ovals with dashed lines represent clusters of genes that have orthologs and paralogs
Fig. 4
Fig. 4
Multigene family copy numbers. Selected major multigene families shown are amastin, β-galactofuranosyl transferase (GALFT), surface protease GP63, retrotransposon hot spot (RHS) protein, mucin-associated surface protein (MASP), trans-sialidase (TS), and dispersed gene family protein 1 (DGF-1). Centers of plots represent 1 copy (0 in log10) and successive concentric circle values are shown by the log10 scale bar on the left
Fig. 5
Fig. 5
Heterozygosity of single copy orthologs. (a) Summary values from 6394 shared single copy ortholog genes. Percent heterozygous genes indicate percentage of genes with at least one heterozygous position, mean percent heterozygous positions were calculated by dividing the number of heterozygous sites by the total number of positions. (b) Histogram showing the distribution of heterozygosity values among heterozygous genes. Red vertical dashed lines represent the mean values

Similar articles

Cited by

References

    1. Lukeš J, Skalický T, Týč J, Votýpka J, Yurchenko V. Evolution of parasitism in kinetoplastid flagellates. Mol Biochem Parasitol. 2014;195:115–122. doi: 10.1016/j.molbiopara.2014.05.007. - DOI - PubMed
    1. Clayton CE. Life without transcriptional control? From fly to man and back again. EMBO J. 2002;21:1881–1888. doi: 10.1093/emboj/21.8.1881. - DOI - PMC - PubMed
    1. Mulligan CJ, Szathmáry EJE. The peopling of the Americas and the origin of the Beringian occupation model. Am J Phys Anthropol. 2017;162:403–408. doi: 10.1002/ajpa.23152. - DOI - PubMed
    1. Fernandes MC, Andrews NW. Host cell invasion by Trypanosoma cruzi: a unique strategy that promotes persistence. FEMS Microbiol Rev. 2012;36:734–747. doi: 10.1111/j.1574-6976.2012.00333.x. - DOI - PMC - PubMed
    1. Garcia ES, Ratcliffe NA, Whitten MM, Gonzalez MS, Azambuja P. Exploring the role of insect host factors in the dynamics of Trypanosoma cruzi-Rhodnius prolixus interactions. J Insect Physiol. 2007;53:11–21. doi: 10.1016/j.jinsphys.2006.10.006. - DOI - PubMed

MeSH terms