

Surface damage of bovine articular cartilage-off-bone: the effect of variations in underlying substrate and frequency
- PMID: 30355307
- PMCID: PMC6201575
- DOI: 10.1186/s12891-018-2305-2
Surface damage of bovine articular cartilage-off-bone: the effect of variations in underlying substrate and frequency
Abstract
Background: Changes in bone mineral density have been implicated with the onset of osteoarthritis, but its role in inducing failure of articular cartilage mechanically is unclear. This study aimed to determine the effect of substrate density, as the underlying bone, on the surface damage of cartilage-off-bone, at frequencies associated with gait, and above.
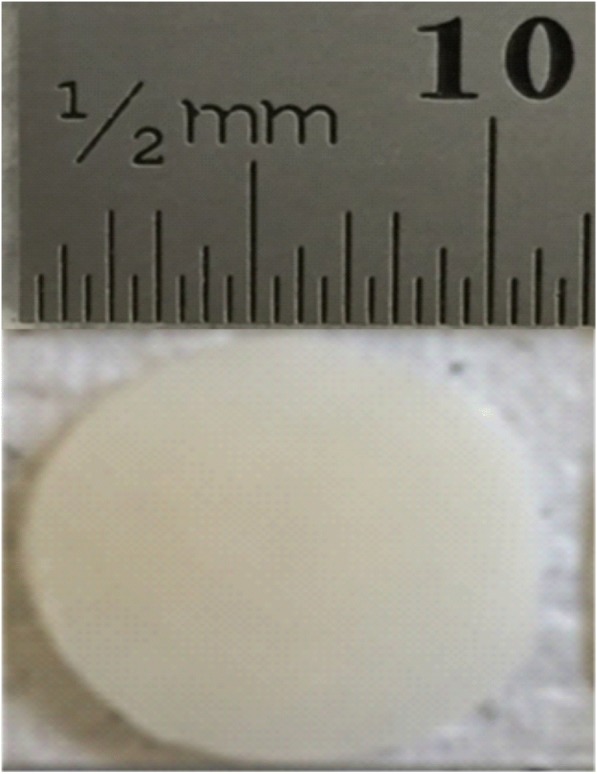
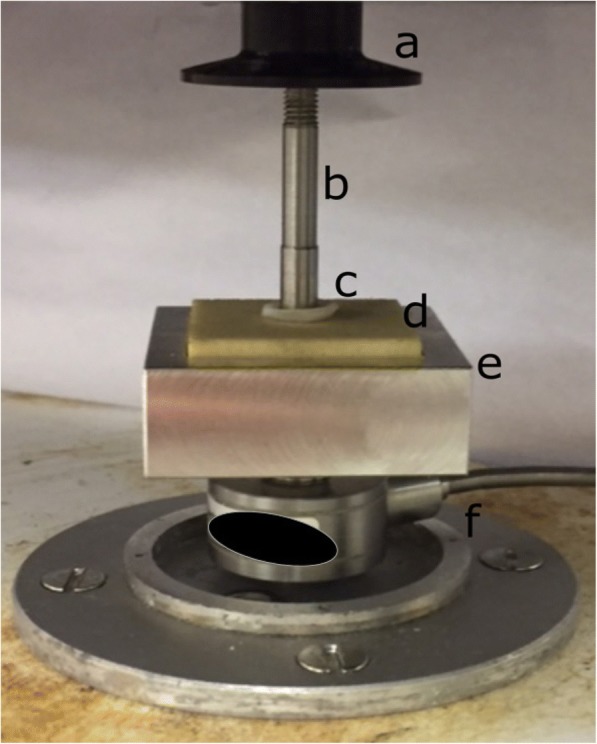
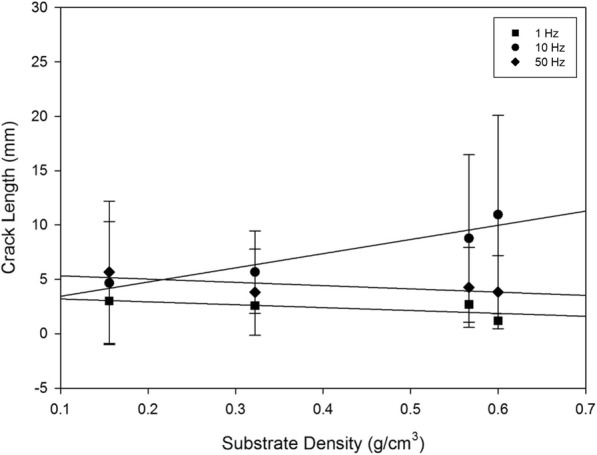
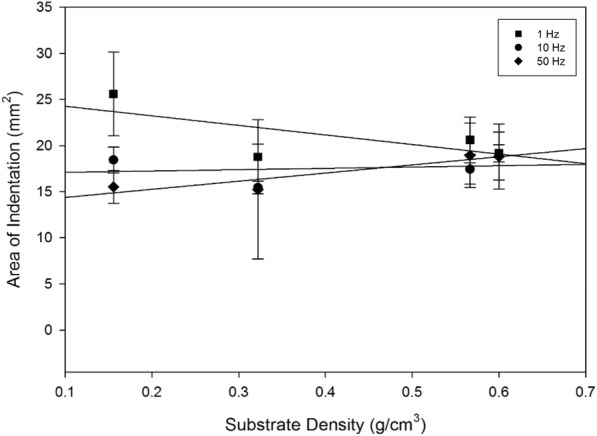
Methods: Bovine articular cartilage samples were tested off-bone to assess induced damage with an indenter under a compressive sinusoidal load range of 5-50 N at frequencies of 1, 10 and 50 Hz, corresponding to normal and above normal gait respectively, for up to 10,000 cycles. Cartilage samples were tested on four underlying substrates with densities of 0.1556, 0.3222, 0.5667 and 0.6000 g/cm3. India ink was applied to identify damage as cracks, measured across their length using ImageJ software. Linear regression was performed to identify if statistical significance existed between substrate density, and surface damage of articular cartilage-off-bone, at all three frequencies investigated (p < 0.05).
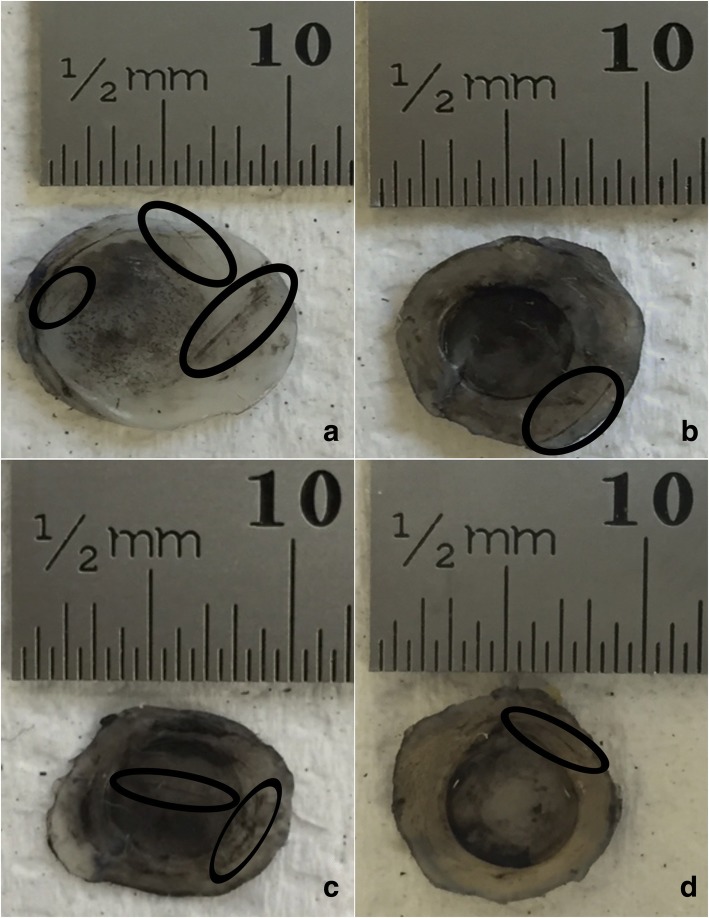
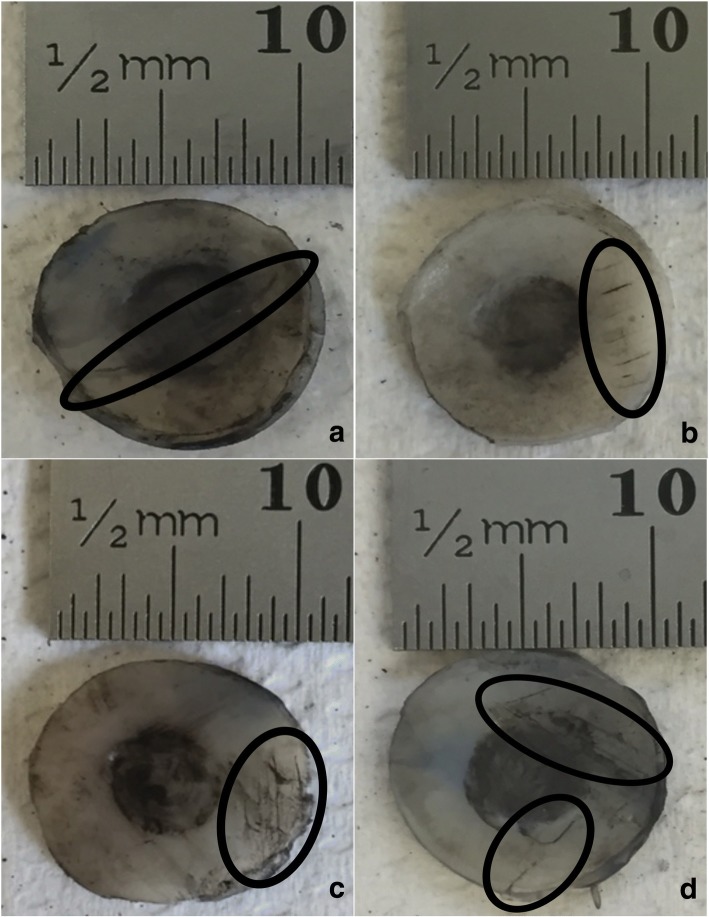
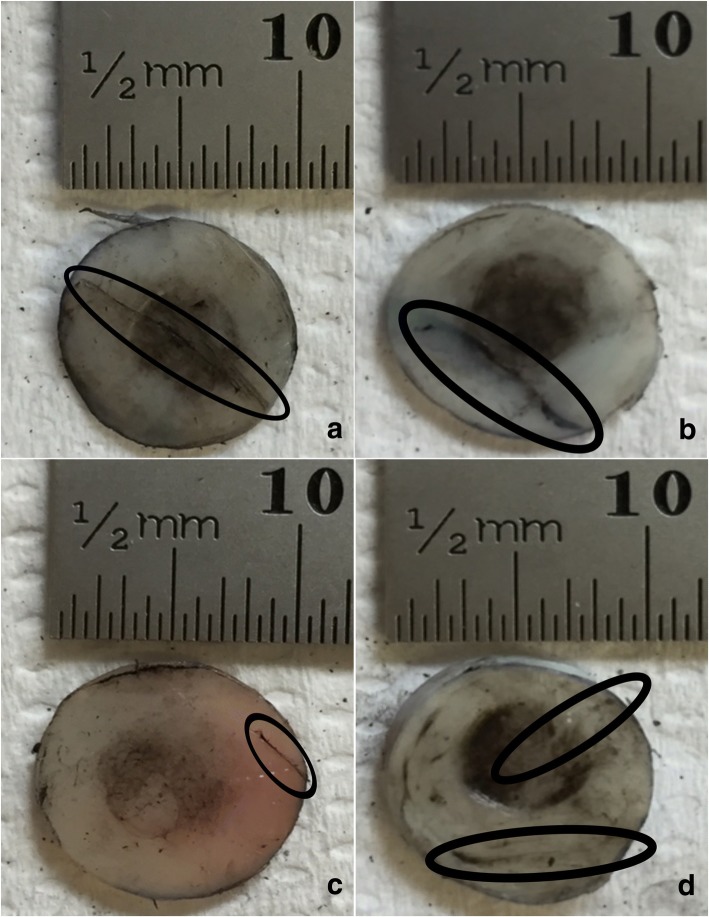
Results: Surface damage significantly increased (p < 0.05) with substrate density at 10 Hz of applied frequency. Crack length at this frequency reached the maximum of 10.95 ± 9.12 mm (mean ± standard deviation), across all four substrates tested. Frequencies applied at 1 and 50 Hz failed to show a significant increase (p > 0.05) in surface damage with an increase in substrate density, at which the maximum mean crack length were 3.01 ± 3.41 mm and 5.65 ± 6.54 mm, respectively. Crack formation at all frequencies tended to form at the periphery of the cartilage specimen, with multiple straight-line cracking observed at 10 Hz, in comparison to single straight-line configurations produced at 1 and 50 Hz.
Conclusions: The effect of substrate density on the surface damage of articular cartilage-off-bone is multi-factorial, with an above-normal gait frequency. At 1 Hz cartilage damage is not associated with substrate density, however at 10 Hz, it is. This study has implications on the effects of the factors that contribute to the onset of osteoarthritis.
Keywords: Articular cartilage; Bone mineral density; Damage; Frequency; Mechanical loading; Osteoarthritis.
Conflict of interest statement
Ethics approval and consent to participate
Not applicable.
Consent for publication
Not applicable.
Competing interests
The authors declare that they have no competing interests.
Publisher’s Note
Springer Nature remains neutral with regard to jurisdictional claims in published maps and institutional affiliations.
Figures
Similar articles
-
Effect of the variation of loading frequency on surface failure of bovine articular cartilage.Osteoarthritis Cartilage. 2015 Dec;23(12):2252-2258. doi: 10.1016/j.joca.2015.06.002. Epub 2015 Jun 12. Osteoarthritis Cartilage. 2015. PMID: 26074363
-
Viscoelastic properties of bovine articular cartilage attached to subchondral bone at high frequencies.BMC Musculoskelet Disord. 2009 Jun 4;10:61. doi: 10.1186/1471-2474-10-61. BMC Musculoskelet Disord. 2009. PMID: 19497105 Free PMC article.
-
Fatigue strength of bovine articular cartilage-on-bone under three-point bending: the effect of loading frequency.BMC Musculoskelet Disord. 2017 Apr 4;18(1):142. doi: 10.1186/s12891-017-1510-8. BMC Musculoskelet Disord. 2017. PMID: 28376781 Free PMC article.
-
Effect of frequency on crack growth in articular cartilage.J Mech Behav Biomed Mater. 2018 Jan;77:40-46. doi: 10.1016/j.jmbbm.2017.08.036. Epub 2017 Sep 1. J Mech Behav Biomed Mater. 2018. PMID: 28888932 Free PMC article.
-
Modeling knee osteoarthritis pathophysiology using an integrated joint system (IJS): a systematic review of relationships among cartilage thickness, gait mechanics, and subchondral bone mineral density.Osteoarthritis Cartilage. 2018 Nov;26(11):1425-1437. doi: 10.1016/j.joca.2018.06.017. Epub 2018 Jul 26. Osteoarthritis Cartilage. 2018. PMID: 30056214
Cited by
-
Development and experimental validation of a dynamic numerical model for human articular cartilage.Proc Inst Mech Eng H. 2023 Jul;237(7):879-889. doi: 10.1177/09544119231180901. Epub 2023 Jun 22. Proc Inst Mech Eng H. 2023. PMID: 37345411 Free PMC article.
-
Analysis of hydration and subchondral bone density on the viscoelastic properties of bovine articular cartilage.BMC Musculoskelet Disord. 2022 Mar 8;23(1):228. doi: 10.1186/s12891-022-05169-0. BMC Musculoskelet Disord. 2022. PMID: 35260135 Free PMC article.
References
-
- Philp AM, Davis ET, Jones SW. Developing anti-inflammatory therapeutics for patients with osteoarthritis. Rheumatology. 2017. 10.1093/rheumatology/kew278. - PubMed
MeSH terms
Grants and funding
LinkOut - more resources
Full Text Sources
Medical
