. 2018 Oct 24;11(1):62.
doi: 10.1186/s13072-018-0232-y.

Non-canonical Drosophila X chromosome dosage compensation and repressive topologically associated domains

Affiliations

Non-canonical Drosophila X chromosome dosage compensation and repressive topologically associated domains

Hangnoh Lee et al. Epigenetics Chromatin. .

Abstract

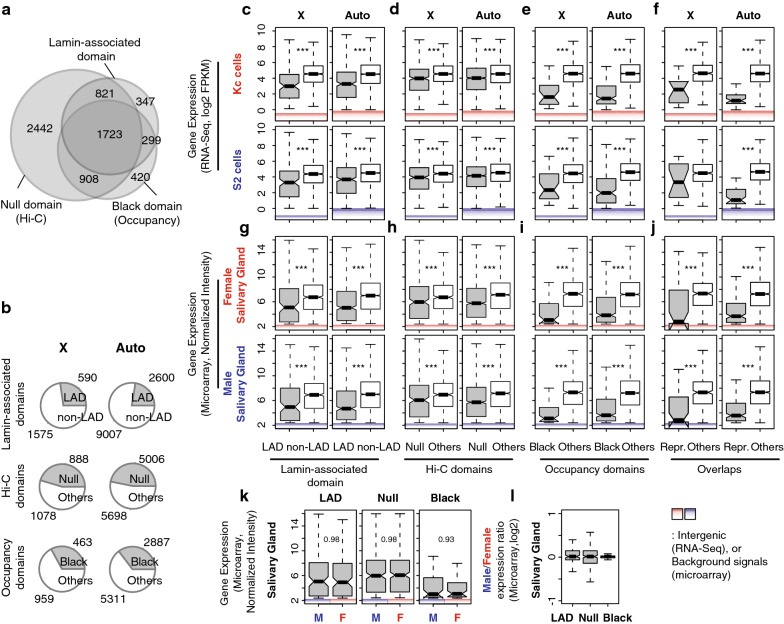
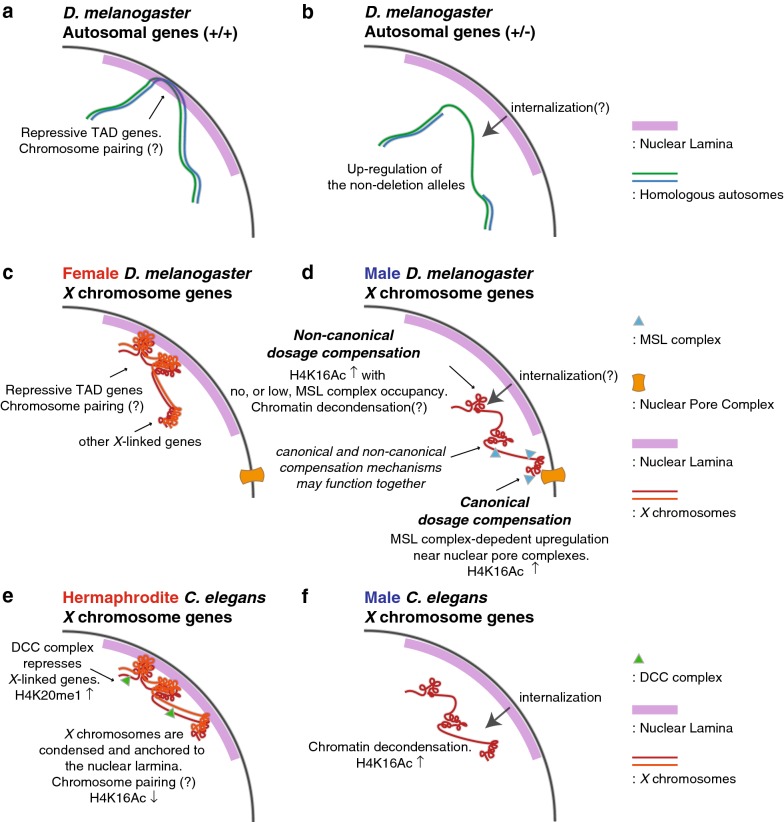
Background: In animals with XY sex chromosomes, X-linked genes from a single X chromosome in males are imbalanced relative to autosomal genes. To minimize the impact of genic imbalance in male Drosophila, there is a dosage compensation complex (MSL) that equilibrates X-linked gene expression with the autosomes. There are other potential contributions to dosage compensation. Hemizygous autosomal genes located in repressive chromatin domains are often derepressed. If this homolog-dependent repression occurs on the X, which has no pairing partner, then derepression could contribute to male dosage compensation.

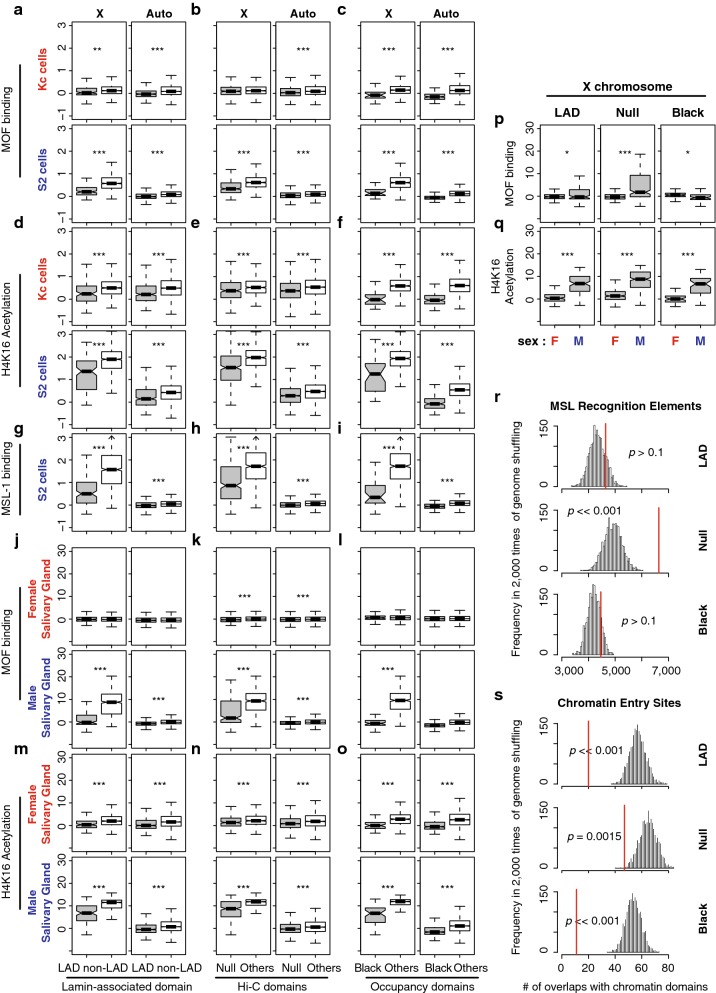
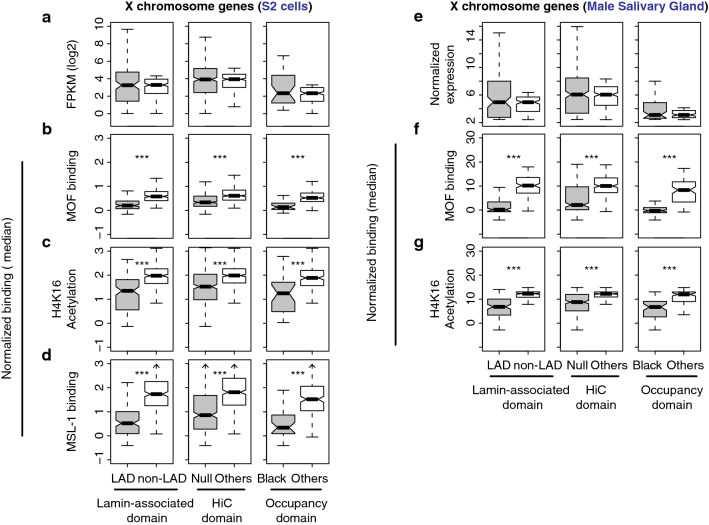
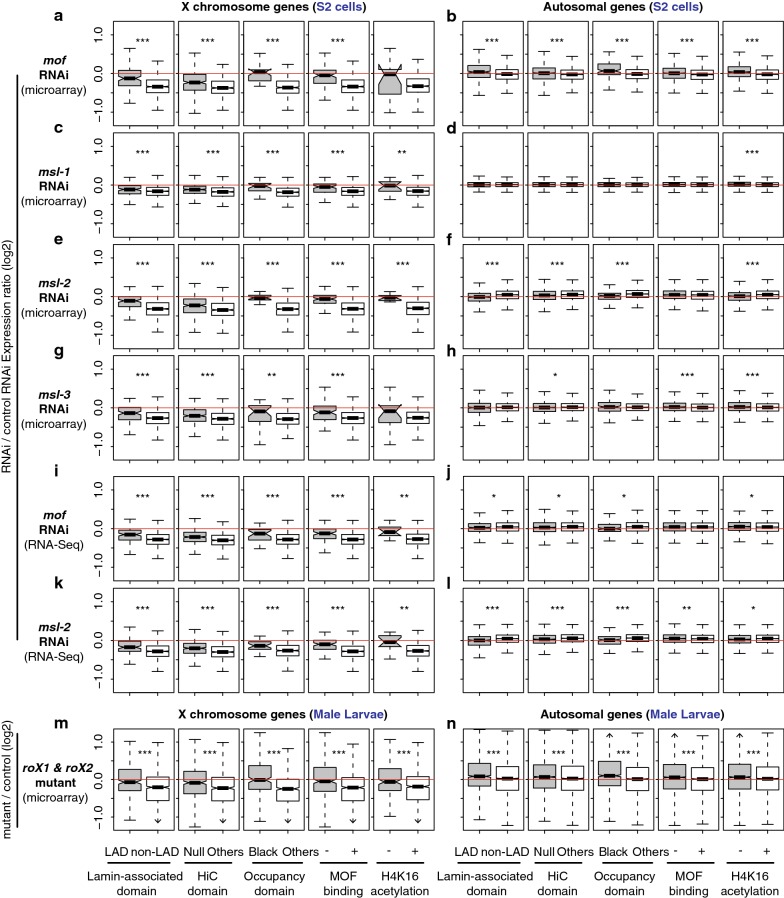
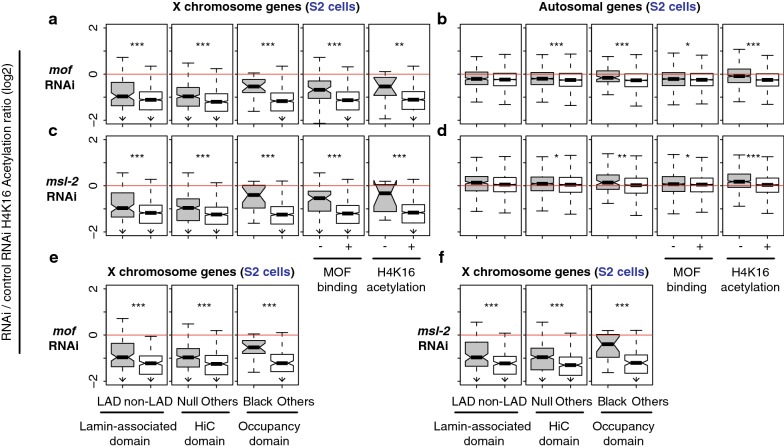
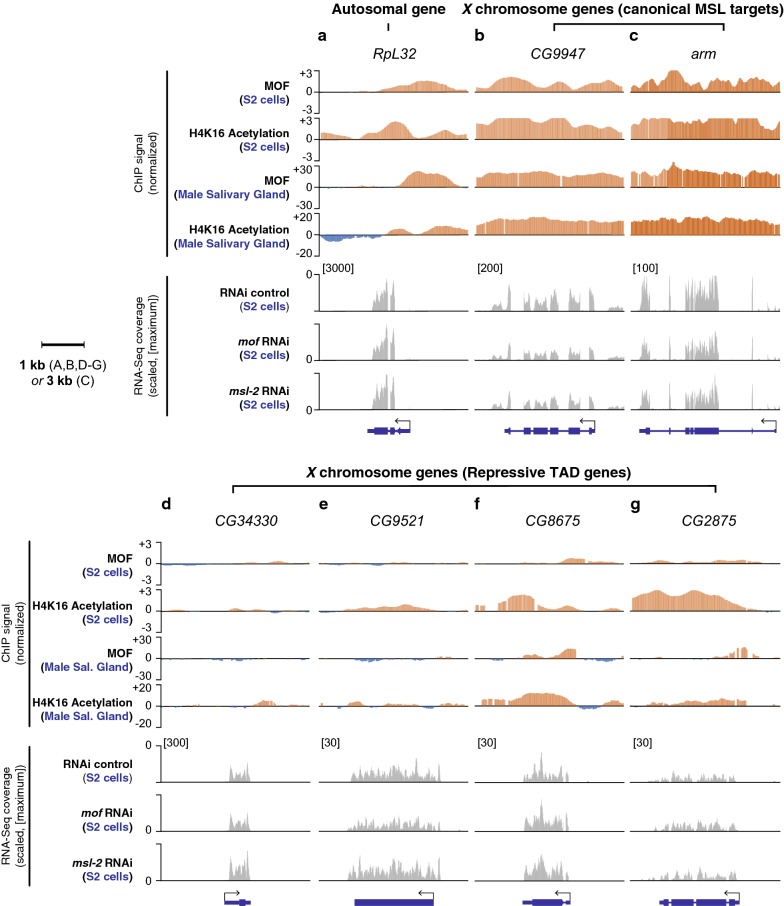
Results: We asked whether different chromatin states or topological associations correlate with X chromosome dosage compensation, especially in regions with little MSL occupancy. Our analyses demonstrated that male X chromosome genes that are located in repressive chromatin states are depleted of MSL occupancy; however, they show dosage compensation. The genes in these repressive regions were also less sensitive to knockdown of MSL components.

Conclusions: Our results suggest that this non-canonical dosage compensation is due to the same transacting derepression that occurs on autosomes. This mechanism would facilitate immediate compensation during the evolution of sex chromosomes from autosomes. This mechanism is similar to that of C. elegans, where enhanced recruitment of X chromosomes to the nuclear lamina dampens X chromosome expression as part of the dosage compensation response in XX individuals.

Keywords: Dosage compensation; Drosophila melanogaster; Lamina-associated domain; MSL complex; Topologically associated domain.


Figures

Fig. 1
Fig. 1
Repressive TAD genes display lower gene expression levels and are dosage compensated in male cells. a Venn diagram displays overlap among the three repressive TADs that are described in this study. b Pie charts demonstrate the proportion of repressive TAD genes (gray) versus non-repressive TAD genes (white) in Drosophila genome. In a and b, only protein-coding polyA+ genes are counted. The numbers do not directly indicate numbers of “expressed” genes in each TAD. cj Gene expression levels from the repressive TAD genes (gray) and non-repressive TAD genes (white) based on LAD (c, g), Hi-C (d, h), chromatin occupancy studies (e, i) and their overlaps (f, j). The top two rows show RNA-Seq results from Drosophila cell lines (unit: log2 FPKM, cf), and the bottom two rows are from a microarray study done with larval salivary glands (unit: normalized signal intensity, ej). Intergenic signals from the 99th percentiles and below in RNA-Seq analyses, as well as background signals from the 99th percentiles and below in the microarray result, are indicated. k Comparisons of X chromosome gene expression levels from the repressive TADs between female and male salivary glands. l Comparisons of male X chromosome genes from the repressive TADs to the same gene in females. Boxplots indicate the distribution of gene expression levels above expression cutoffs. Middle lines in box display medians of each distribution. Top of the box. 75th percentile. Bottom of the box. 25th percentile. Whiskers indicate the maximum, or minimum, observation within 1.5 times of the box height from the top, or the bottom of the box, respectively. Notches show 95% confidence interval for the medians. ***p < 0.001 from Mann–Whitney U test. The same format and test have been used for all boxplots appeared in this study
Fig. 2
Fig. 2
Repressive TAD genes have a limited binding of MSL complex. ai Chromatin immunoprecipitation (ChIP) results from MOF binding (ac), Histone H4K16 acetylation (df) and MSL-1 binding (gi) are summarized as boxplots for Drosophila cell lines (Kc and S2). Gene-level ChIP signals are separately shown based on LAD (a, d, g), Hi-C (b, e, h) and chromatin occupancy (c, f, i) study results. jo ChIP results from the third instar larval salivary glands. **p < 0.01, ***p < 0.001. No asterisk indicates p > 0.05. p, q Direct comparisons of MOF binding (p) and H4K16Ac enrichment (q) between female and male salivary glands from jo. r, s The histogram represents expected numbers of overlaps between repressive TADs and MRE (r), or CES (s). We performed random shuffling of the X chromosome genome 2000 times and demonstrated the frequencies of the number of overlaps. Red lines: the actual number of overlaps between LADs and MREs or CES’s. p values are from permutation tests
Fig. 3
Fig. 3
Lower occupancy of MOF and H4K16Ac levels in the X-linked genes within repressive TAD compared to non-repressive TAD genes with similar expression levels. a Boxplots display gene expression levels from S2 cells in FPKMs. The X-linked repressive TAD genes (gray) and genes from non-repressive TADs (white) were compared; for the latter, highly expressed genes were removed to equalize the medians. bc MOF occupancy, H4K16Ac level or MSL-1 binding of the genes in (a). e X chromosome gene expression levels from male salivary glands where the median expression of non-repressive TAD genes is matched to that of the repressive TAD genes as in (a). f, g MOF occupancy and H4K16Ac levels for the genes in (e)
Fig. 4
Fig. 4
Different responses from the repressive versus non-repressive TAD genes upon knockdown or mutation of MSL complex components. Boxplots represent gene expression changes in log2 scale from depletion of MSL components in Drosophila S2 cells (al) or roX mutation in male larvae (mn). Plots are based on four independent studies [23, 47, 54, 88], which used either microarray (ah and mn) or RNA-Seq technology (il). a, b Differential gene expression from mof knockdown cells. Changes from the repressive TADs (left three columns, LAD, Null and Black) as well as MOF binding, or Histone H4K16 acetylation regions are presented. c–h Results from msl-1, msl-2, or msl-3 knockdown. i, j Results from mof knockdown, measured by RNA-Seq analysis. k, l msl-2 knockdown. m, n Results from roX1 and roX2 null mutant larvae, measured by microarrays. a, c, e, g, i, k, m Changes from X chromosome genes. b, d, f, h, j, l, n Changes from autosomal genes. *p < 0.05, **p < 0.01, ***p < 0.001
Fig. 5
Fig. 5
H4K16Ac levels change less within the repressive TADs when MSL components are depleted. Boxplots show changes in H4K16Ac levels upon the RNAi-mediated knockdown of mof (ab) or msl-2 (cd). a, b Results from mof knockdown. c, d Results from msl-2 knockdown. e, f Changes in H4K16Ac as in A and B, but highly expressed genes within non-repressive TADs were filtered out to match their expression median to that of the repressive TAD genes as in Fig. 3. a, c, e, f Results from X-linked genes. b, d Results from autosomal genes
Fig. 6
Fig. 6
Repressive TAD genes that are less sensitive to msl or mof knockdown lack MOF enrichment at their gene bodies. Top four panels demonstrate normalized ChIP signals of MOF and H4K16Ac from S2 cells as well as male salivary glands. The bottom three panels display RNA-Seq read coverages from our re-analysis of Zhang et al. [23]. The plots are scaled based on their maximum coverage from one of the three samples: control RNAi, mof RNAi and msl-2 RNAi (indicated in the square brackets). Note that there is no sample-to-sample normalization because the total number of reads is similar across the three samples; 7.2, 7.5 and 8.1 million mapped reads for the control, mof RNAi and msl-2 RNAi samples, respectively. a An autosomal gene (RpL32). b, c Canonical MSL targets genes. CG9947 (B) and arm (c). de Repressive target genes that are compensated via the non-canonical dosage compensation. CG34430 (d), CG9521 (e), CG8675 (f) and CG2875 (g)
Fig. 7
Fig. 7
Hypothetical models demonstrating the parallelism among dosage compensation of autosomal dosage compensation in hemizygous D. melanogaster, and X chromosome dosage compensation in C. elegans and D. melanogaster. a, b A proposal of derepression-mediated compensation of one-dose autosomal genes in hemizygous D. melanogaster based on our previous study [25]. c, d A model of X chromosome dosage compensation in d. melanogaster based on the current study as well as other references [, , , , , –93]. e, f A model of X chromosome dosage compensation in C. elegans based on the references [, –35, 38, 39, 94]

Similar articles

Cited by

References

    1. Birchler JA, Veitia RA. Gene balance hypothesis: connecting issues of dosage sensitivity across biological disciplines. Proc Natl Acad Sci USA. 2012;109:14746–14753. doi: 10.1073/pnas.1207726109. - DOI - PMC - PubMed
    1. Sheltzer JM, Amon A. The aneuploidy paradox: costs and benefits of an incorrect karyotype. Trends Genet. 2011;27:446–453. doi: 10.1016/j.tig.2011.07.003. - DOI - PMC - PubMed
    1. Ercan S. Mechanisms of X chromosome dosage compensation. J Genomics. 2015;3:1–19. doi: 10.7150/jgen.10404. - DOI - PMC - PubMed
    1. Disteche CM. Dosage compensation of the sex chromosomes. Annu Rev Genet. 2012;46:537–560. doi: 10.1146/annurev-genet-110711-155454. - DOI - PMC - PubMed
    1. Ferrari F, Alekseyenko AA, Park PJ, Kuroda MI. Transcriptional control of a whole chromosome: emerging models for dosage compensation. Nat Struct Mol Biol. 2014;21:118–125. doi: 10.1038/nsmb.2763. - DOI - PMC - PubMed

Publication types

LinkOut - more resources