. 2018 Oct 25:7:e38539.
doi: 10.7554/eLife.38539.

INAVA-ARNO complexes bridge mucosal barrier function with inflammatory signaling

Affiliations

INAVA-ARNO complexes bridge mucosal barrier function with inflammatory signaling

Phi Luong et al. Elife. .

Abstract

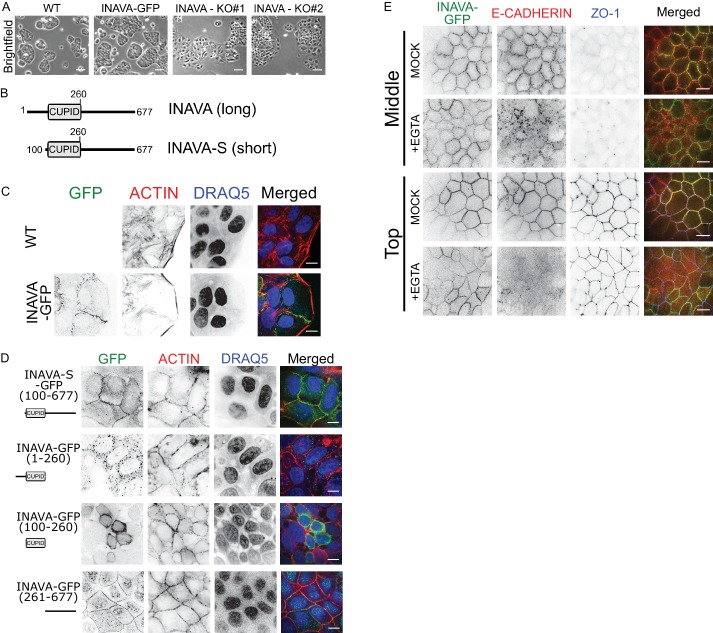
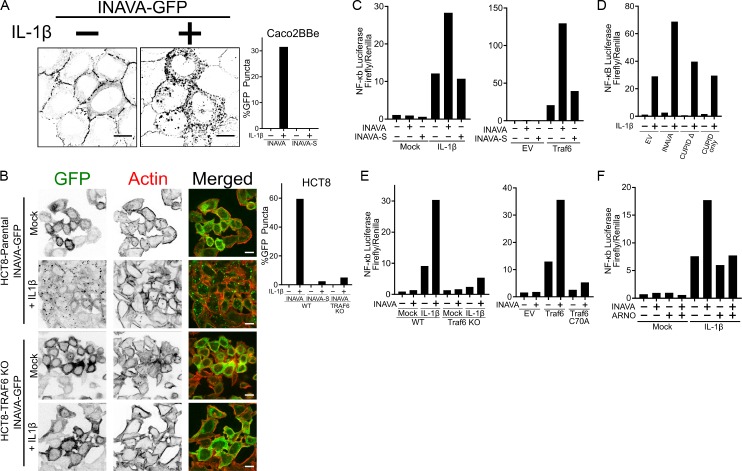
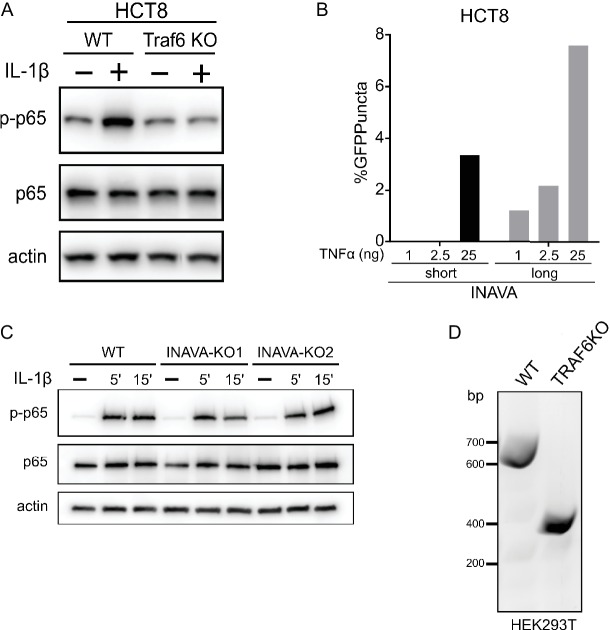
Homeostasis at mucosal surfaces requires cross-talk between the environment and barrier epithelial cells. Disruption of barrier function typifies mucosal disease. Here we elucidate a bifunctional role in coordinating this cross-talk for the inflammatory bowel disease risk-gene INAVA. Both activities require INAVA's DUF3338 domain (renamed CUPID). CUPID stably binds the cytohesin ARF-GEF ARNO to effect lateral membrane F-actin assembly underlying cell-cell junctions and barrier function. Unexpectedly, when bound to CUPID, ARNO affects F-actin dynamics in the absence of its canonical activity as a guanine nucleotide-exchange factor. Upon exposure to IL-1β, INAVA relocates to form cytosolic puncta, where CUPID amplifies TRAF6-dependent polyubiquitination and inflammatory signaling. In this case, ARNO binding to CUPID negatively-regulates polyubiquitination and the inflammatory response. INAVA and ARNO act similarly in primary human macrophages responding to IL-1β and to NOD2 agonists. Thus, INAVA-CUPID exhibits dual functions, coordinated directly by ARNO, that bridge epithelial barrier function with extracellular signals and inflammation.

Keywords: ARNO; IL-1b; TRAF6; actin assembly; biochemistry; cell biology; chemical biology; epithelial barrier; human; inflammatory bowel disease.


Conflict of interest statement

PL, MH, JY, TZ, TF, JT, SH, CL, HW, CA, WL No competing interests declared, XJ is affiliated with Novartis. The author has no other competing interests to declare

Figures

Figure 1.
Figure 1.. INAVA localizes to cell-cell junctions.
(A) Domain architecture of the long and short INAVA isoforms.(B) Brightfield images of Caco2BBe WT, INAVA-GFP over-expressing, and INAVA CRISPR knockout cells grown 2 days on coverslips. Scalebar = 200 μm. (C) Localization of stably expressed long isoform INAVA-GFP in Caco2BBe grown on coverslips. Cells stained with F-actin (TRITC-phalloidin) and nuclei (DRAQ5). (D) Localization of stably expressed GFP tagged INAVA constructs in Caco2BBe cells.(E) Localization of Caco2BBe polarized epithelial monolayers stably expressing INAVA-GFP on 2-D transwells. Cells were treated for 5 min with 6 mM EGTA and then immediately fixed with 4% paraformaldehyde and stained for E-cadherin (adherens junction, red) and ZO-1 (tight junction, blue). Scalebar 10 μm (see also Figure 1—figure supplement 1I,J).
Figure 1—figure supplement 1.
Figure 1—figure supplement 1.. INAVA is important for barrier function in epithelial Caco2BBe cells.
(A) Verification of Caco2BBe INAVA knockdown by qPCR. (B) Genomic DNA PCR of INAVA locus in Caco2BBe WT and INAVA exon deleted CRISPR knockout lines. (C) Top, brightfield images of control or INAVA stable knockdown Caco2BBe grown 2 days sparsely on coverslips. Scalebar = 200 μm. Bottom, confocal images of the above cells stained for F-actin (phalloidin-TRITIC). Scalebar = 10 μm. (D) Permeability assay with 4 kDa FITC-Dextran in control or INAVA knockdown Caco2BBe cells. Cells were cultured on 2-D transwell inserts in triplicate for 3 days and treated apically with 4 kDa FITC-Dextran for 2 hr. Basal chambers were collected and measured for fluorescence. Data representative of two independent experiments, (n = 2). (E) As in (D) but with INAVA CRISPR knockout cells in triplicate. Data representative of two independent experiments. (F) Transepithelial electrical resistance (TEER) of Caco2BBe WT, INAVA knockout, and INAVA-GFP, ARNO expressing lines grown on 2-D transwell inserts for 3 days. Representative data from two independent experiments are shown. (G) Relative TEER measurements of Caco2BBe WT and INAVA-GFP stably expressing cells before and after overnight low calcium (50 μM) treatment, Data representative of two independent experiments. Error bars ± SEM. (H) Confocal images of INAVA-S expressing cells grown sparsely on coverslips for 2 days. (I and J) Confocal images of Caco2BBe cells expressing INAVA-GFP grown on 2-D transwells for 2 weeks. (I) Anti-E-cadherin (adherens junction) and (J) anti-ZO-1 (tight junctions) are cell junction markers. c, TRITC-phalloidin was used to stain F-actin. Scalebar = 10 μm.
Figure 2.
Figure 2.. INAVA recruits ARNO to cell-cell junctions to promote GEF-independent actin assembly.
(A) GST pulldowns with recombinant GST-INAVA-CUPID domain and His-MBP-CC (coiled-coil) of cytohesin members (see also Figure 2—figure supplement 1C). (B) Immunoblot of Caco2BBe stably transduced with lentiviral vector driving myc-ARNO and myc-GRP1 expression under constitutive CMV promoter. Cells were additionally transduced with lentivirus expressing HA-GFP-INAVA or treated with phorbol-12-myristate-13-acetate (PMA). (C) Confocal microscopy images of Caco2BBe stably expressing doxycycline inducible myc-ARNO alone or with constitutively expressed INAVA-GFP. Scalebar = 10 μm. (D) Confocal images of coculture of Caco2BBe WT and stably expressing INAVA-GFP with myc-ARNO. Cells were stained with (E) Quantification of peak fluorescence intensity of cell-cell junction F-actin line scans as in (F), from Caco2BBe WT or Caco2BBe stably expressing INAVA-GFP (top), myc-ARNO (middle), or INAVA-GFP coexpressed with myc-ARNO (bottom). Right panel shows representative profiles of F-actin line scans. (F) F-actin line scans with Caco2BBe cocultured with Caco2BBe co-expressing INAVA-GFP and mutant ARNO constructs including GEF mutant (E156K), ARF6-GTP mutant (K366A), PIP2 mutant (K268A). Error bars indicate ± SEM. *p<0.05, †p<0.0001, NS not significant (two-tailed Student’s t-test), n = 8–10. (G) Cartoon display domain architecture of INAVA and ARNO and three ARNO activity states. Inactive ARNO is autoinhibited and cytosolically localized. The GEF dependent positive feedback mechanism of ARNO promotes robust levels of trafficking and actin assembly at the plasma membrane. In the context of a polarized epithelial cells this positive feedback mechanism disrupts barrier integrity that leads to epithelial breakdown and cell spreading. In contrast, CUPID domain mediated INAVA-ARNO complex permits non-canonical GEF independent function that allow fine control of lateral actin to maintain barrier homeostasis.
Figure 2—figure supplement 1.
Figure 2—figure supplement 1.. Cytohesins interact with INAVA to Promote GEF Independent Actin Assembly.
(A) Protein interaction Platform (PIP) Assay in Yeast. ARNO full length, CC-SEC7 and CC domain constructs were fused to YFP, and INAVA was fused to μNS, and transformed in yeast. Yeast were mated and induced with galactose for 4 hr and imaged. Empty vector μNS was used as negative control. (B) As in (A) but with b, PIP assay with INAVA and full length Cytohesin 1, or GRP1. (C) GST pulldown control with recombinant GST and His-MBP tagged coiled-coil (CC) region of Cytohesin 1, ARNO, or GRP1. (D) Recombinant ARNO CC-SEC7 alone or complexed with GST-INAVA-CUPID (1 μM) were incubated with MANT-GTP (25 μM) and ΔN17ARF1-GDP (40 μM) for 15 min at 25°C in duplicate. Guanine exchange reactions were measured by fluorescence at ex/em 355/445 nm. Background from control samples with MANT-GTP and ΔN17ARF1-GDP was subtracted. GEF assays with Cytohesin 1, GRP1, or Cytohesin 4 CC-SEC7 with or without GST-INAVA-CUPID. Data representative of 3 independent experiments. Error bars ± SD. (E) Immunoblot of endogenous ARNO and actin in Caco2BBe wildtype and cells expressing INAVA (anti-GFP). ImageJ was used to quantify relative band intensity. (F) As in (E) but with INAVA knockout lines. (G) MDMs (n = 6) were transfected with empty vector (EV) or WT HA-INAVA, and Myc-ARNO at the indicated concentrations. Summary graph with mean fluorescent intensity (MFI) values of ARNO expression (as detected by Myc antibody using intracellular flow cytometry)+SEM (similar results seen in an additional n = 6). Tx, treatment. ††, p<1×10⁻⁵. (H) Confocal images of Caco2BBe expressing INAVA-GFP-CUPID (aa 100–261) with ARNO. Cells were stained with anti-myc (ARNO) and TRITC-phalloidin (F-actin). (I) As in (H) but with MCF7 cells stably expressing INAVA-GFP. (J) As in (I) but with MCF7 cells expressing doxycycline induced ARNO. (K) As in (I) but with MCF7 cells stably coexpressing INAVA-GFP with ARNO wild type, GEF mutant (E156K), ARF6-GTP mutant (K336A), or PIP2 mutant (K268A). Scalebar = 10 μM.
Figure 3.
Figure 3.. INAVA is an activator of IL-1β signaling and is inhibited by ARNO.
(A and B) Confocal images of (A) Caco2BBe and (B) HCT8 or HCT8 TRAF6 KO cells stably expressing INAVA-GFP long isoform treated with or without 10 ng/ml IL-1β for 30 min. Graph display quantification of %GFP positive puncta of long and short INAVA, n = 73–125 cells. Scalebar = 10 μm (see also Figure 3—figure supplement 1A,B). (C) NF-κB reporter assays in HEK293T transfected with INAVA long or short INAVA-S and stimulated with 10 ng/ml IL-1β for 4 hr, left, or co-transfected with TRAF6, right graph. Reporter data is average of duplicates and representative of three independent experiments. (D) As in (C) but with long INAVA isoform, INAVA without CUPID domain and CUPID only. (E) As in (C) but with TRAF6 knockout, left graph and TRAF6 ligase mutant C70A, right graph (see also Figure 3—figure supplement 1C). (F) As in (C) but with stably expressed ARNO.
Figure 3—figure supplement 1.
Figure 3—figure supplement 1.. INAVA-GFP puncta formation is relatively less in HCT8 cells stimulated with TNFα.
(A) Verification of HCT8 TRAF6 knockout cells. Immunoblot of p65 activation in HCT8 wildtype and TRAF6 knockout cells treated with IL-1β (10 ng/ml) for 15 min. (B) Quantification of %positive GFP puncta of stably expressed INAVA-GFP and INAVA-S-GFP with TNFα stimulation at 1 ng/ml, 2.5 ng/ml and 25 ng/ml for 30 min, n = 70–85 cells. (C) Immunoblot of p65 activation in Caco2BBE wildtype and INAVA KO lines. Cells were mock treated or stimulated with IL-1β (10 ng/ml) for 5 and 15 min. (D) Verification of HEK293T TRAF6 exon deleted knockout cells by genomic DNA PCR.
Figure 4.
Figure 4.. IL-1β-initiated NFκB and MAPK signaling and cytokine secretion is decreased in MDMs from INAVA rs7554511 CC risk carriers.
(A–C) MDMs from rs7554511 AA (INAVA high-expressing) and CC (INAVA low-expressing) (n = 10/genotype) carriers were treated with 10 ng/ml IL-1β. (A) Summary graph of INAVA expression as assessed by flow cytometry. Mean fluorescent intensity (MFI) + SEM. (B) Summary graphs of fold MFI of the indicated phospho-kinases + SEM. (C) Mean cytokine secretion at 24h + SEM. Significance is compared to IL-1β-treated, rs7554511 AA carrier MDMs. (D–G) MDMs from rs7554511 CC homozygote (low-expressing) INAVA carriers were transfected with empty vector (EV) or the indicated HA-INAVA constructs. Cells were treated with (D and F) 10 ng/ml IL-1β or (E and G) 100 μg/ml MDP. (D and E) Summary graphs of MFI fold change of the indicated phospho-proteins at 15min + SEM (n = 6, similar results seen in an additional n = 10 for (E)). (F and G) Mean cytokine secretion at 24 hr + SEM (n = 6, similar results seen in an additional n = 10 for (G)) (see also Figure 4—figure supplement 1A-D). (H and I) As in (D and F) but with Myc-ARNO vector at the indicated concentrations. (H) Summary graphs with MFI fold change of indicated phospho-proteins at 15 min +SEM. (I) Mean TNF secretion at 24 hr + SEM. Significance is compared to: treated, EV-transfected cells for (D–G), and treated cells without ARNO transfection (EV) for each respective condition for (H and I). Tx, treatment; EV, empty vector, NS, not significant; **, p<0.01; ***, p<0.001; †, p<1×10⁻⁴; ††, p<1×10⁻⁵.
Figure 4—figure supplement 1.
Figure 4—figure supplement 1.. ARNO inhibits INAVA-dependent NOD2-induced signaling and cytokine secretion.
(A–D) MDMs from rs7554511 CC homozygote (low-expressing) INAVA carriers were transfected with empty vector (EV) or the indicated HA-INAVA constructs. (A) Representative flow cytometry of INAVA constructs with mean fluorescent intensity (MFI) values as indicated. (B) Summary graph of INAVA expression (as detected by HA antibody) with MFI +SEM (n = 6, similar results seen in an additional n = 10). (C) Cells were stained with annexin V (BD Biosciences). Percent dead cells + SEM. UV stimulation at 50–100 J/m2 served as a positive control. (D) Representative flow cytometry for Figure 4D with MFI values as indicated. (E–I) MDMs (n = 6) from rs7554511 CC homozygote (low-expressing) INAVA carriers were transfected with empty vector (EV) or HA-INAVA, and Myc-ARNO vector at the indicated concentrations. (E and F) Cells were left untreated or treated with 10 ng/ml IL-1β or 100 μg/ml MDP for 24 hr. (E) Representative flow cytometry with MFI values as indicated, and (F) summary graphs with MFI values of ARNO expression (as detected by Myc antibody)+SEM (similar results seen in an additional n = 6 for MDP-treated conditions). (G) Cells were stained with annexin V. Percent dead cells + SEM. UV stimulation at 50–100 J/m2 served as a positive control. (H–I) Cells were treated with 100 μg/ml MDP. (H) Summary graphs with fold MFI of indicated phospho-kinases at 15 min +SEM. (I) Mean TNF secretion at 24 hr + SEM. Significance is compared to treated cells without ARNO transfection (EV) for each respective condition for (H and I). Tx, treatment; EV, empty vector; NS, not significant; **, p<0.01; ***, p<0.001; †, p<1×10⁻⁴; ††, p<1×10⁻⁵.
Figure 5.
Figure 5.. INAVA enhances TRAF6 dependent polyubiquitination in cells and in vitro.
(A) HEK293T cells were transfected with HA-Ubiquitin and with or without myc-TRAF6. Whole cell lysates were prepared in RIPA buffer with protease inhibitors and analyzed by immunoblot for HA (ubiquitin), anti-TRAF6, and GFP (INAVA). Actin served as loading control. (B) HEK293T cells were transfected HA-Ubiquitin and indicated constructs. Whole cell lysate was prepared as above and analyzed by immunoblot for anti-myc (myc-INAVA 74 kDa, myc-ARNO 47 kDa), anti-TRAF6, and actin as loading control. (C) Cell-free reconstitution of polyubiquitination requires recombinant E1 (UBE1), E2 (UBC13/UEV1a), E3 (TRAF6-RING aa50-211), wild type Ubiquitin and pseudo-substrate UbiquitinΔ2G-HA. Reactions were incubated at 25°C for 2 hr and analyzed by immunoblot with anti-HA to detect ubiquitination on the pseudo-substrate. (D) In vitro ubiquitination reaction with recombinant MBP-INAVA-CUPID and ARNO CC-SEC7 along with E1 (UBE1), E2 (UBC13/UEV1a), E3 (TRAF6-RING domain aa 50–211), and pseudo-substrate UbiquitinΔ2G-HA. Reactions were incubated at 25°C for 2 hr and analyzed by immunoblot with HA to detect ubiquitination on the pseudo-substrate. (E) In vitro ubiquitination reaction as in (D) except with only Ubc13 as E2.

References

    1. Aksentijevich I, Masters SL, Ferguson PJ, Dancey P, Frenkel J, van Royen-Kerkhoff A, Laxer R, Tedgård U, Cowen EW, Pham TH, Booty M, Estes JD, Sandler NG, Plass N, Stone DL, Turner ML, Hill S, Butman JA, Schneider R, Babyn P, El-Shanti HI, Pope E, Barron K, Bing X, Laurence A, Lee CC, Chapelle D, Clarke GI, Ohson K, Nicholson M, Gadina M, Yang B, Korman BD, Gregersen PK, van Hagen PM, Hak AE, Huizing M, Rahman P, Douek DC, Remmers EF, Kastner DL, Goldbach-Mansky R. An autoinflammatory disease with deficiency of the interleukin-1-receptor antagonist. New England Journal of Medicine. 2009;360:2426–2437. doi: 10.1056/NEJMoa0807865. - DOI - PMC - PubMed
    1. Ashwood P, Harvey R, Verjee T, Wolstencroft R, Thompson RP, Powell JJ. Functional interactions between mucosal IL-1, IL-ra and TGF-beta 1 in ulcerative colitis. Inflammation Research : Official Journal of the European Histamine Research Society ... [Et Al.] 2004;53:53–59. doi: 10.1007/s00011-003-1219-z. - DOI - PubMed
    1. Baker JM, Boyce FM. High-throughput functional screening using a homemade dual-glow luciferase assay. Journal of Visualized Experiments. 2014 doi: 10.3791/50282. - DOI - PMC - PubMed
    1. Cao Z, Xiong J, Takeuchi M, Kurama T, Goeddel DV. TRAF6 is a signal transducer for interleukin-1. Nature. 1996;383:443–446. doi: 10.1038/383443a0. - DOI - PubMed
    1. Cappola TP, Li M, He J, Ky B, Gilmore J, Qu L, Keating B, Reilly M, Kim CE, Glessner J, Frackelton E, Hakonarson H, Syed F, Hindes A, Matkovich SJ, Cresci S, Dorn GW. Common variants in HSPB7 and FRMD4B associated with advanced heart failure. Circulation. Cardiovascular Genetics. 2010;3:147–154. doi: 10.1161/CIRCGENETICS.109.898395. - DOI - PMC - PubMed

Publication types

MeSH terms