. 2018 Oct 25:7:e37925.
doi: 10.7554/eLife.37925.

Multiple tumor suppressors regulate a HIF-dependent negative feedback loop via ISGF3 in human clear cell renal cancer

Affiliations

Multiple tumor suppressors regulate a HIF-dependent negative feedback loop via ISGF3 in human clear cell renal cancer

Lili Liao et al. Elife. .

Erratum in

Abstract

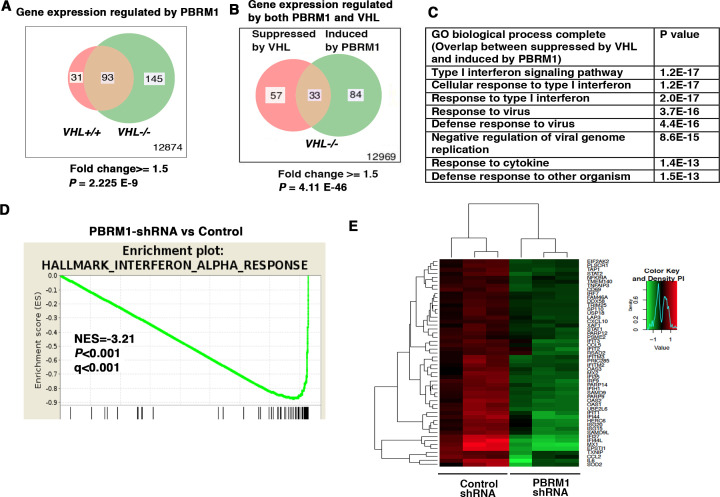
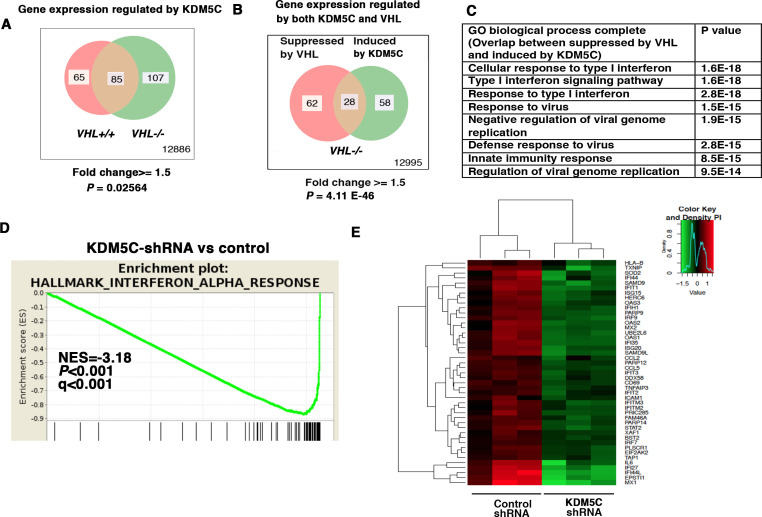
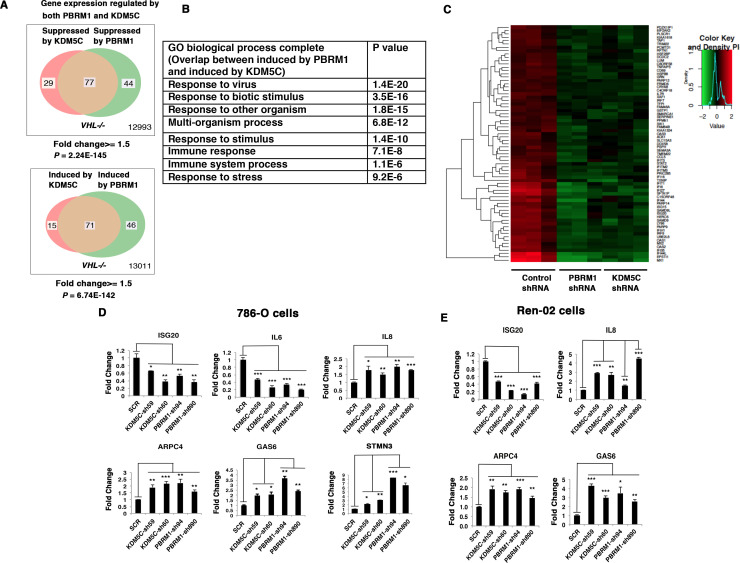
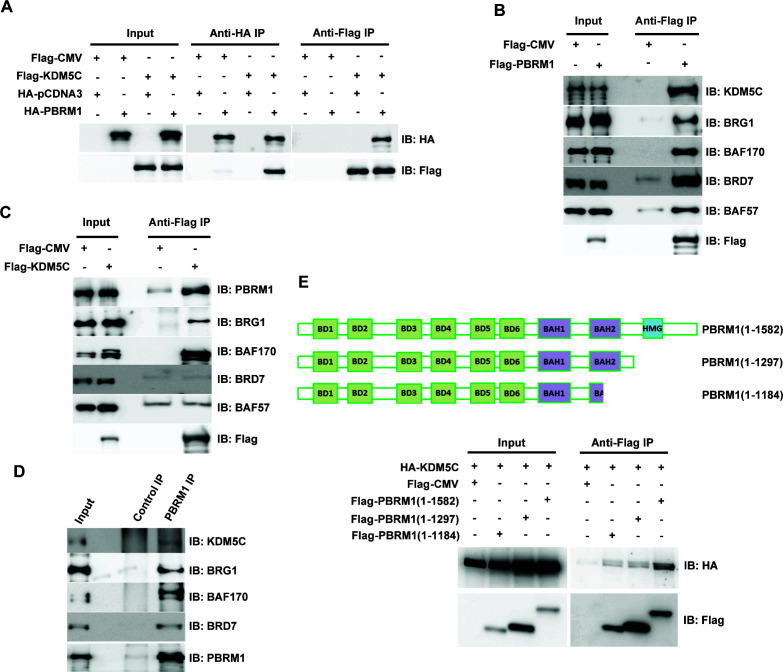
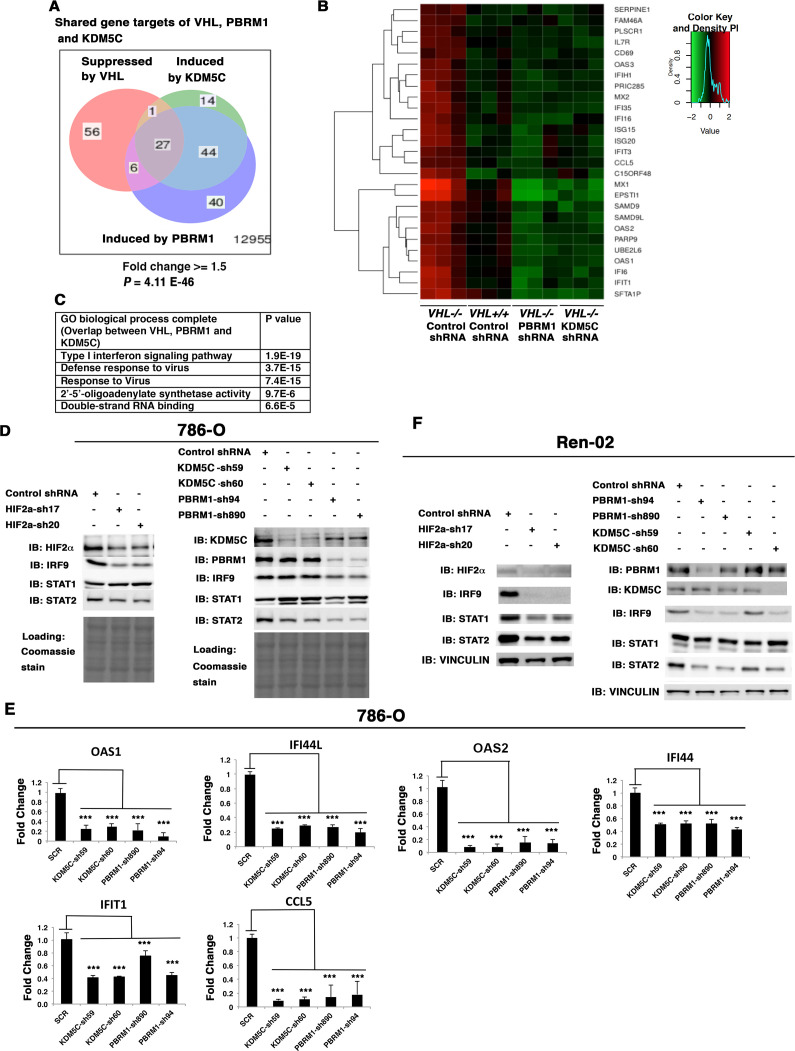
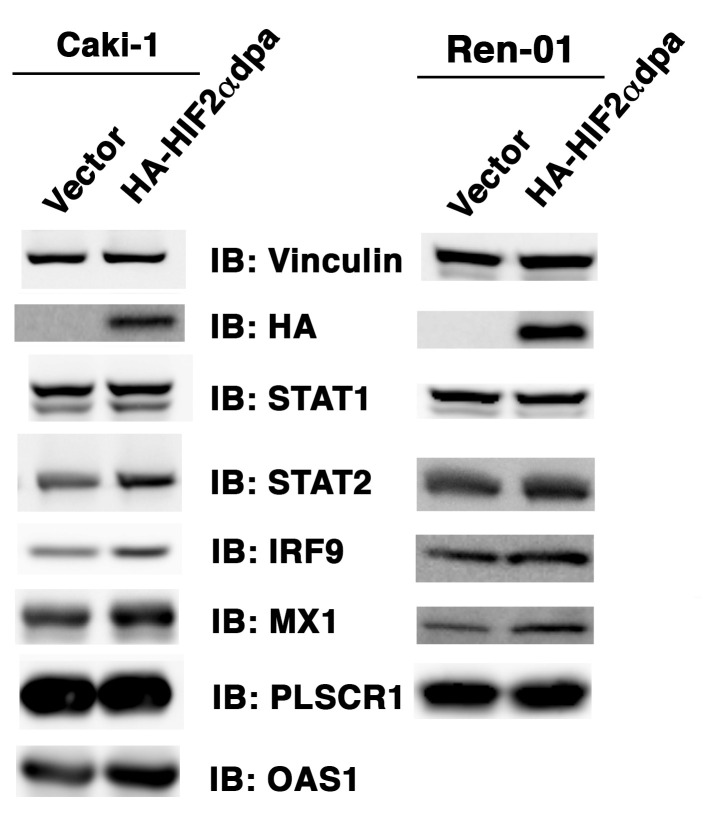
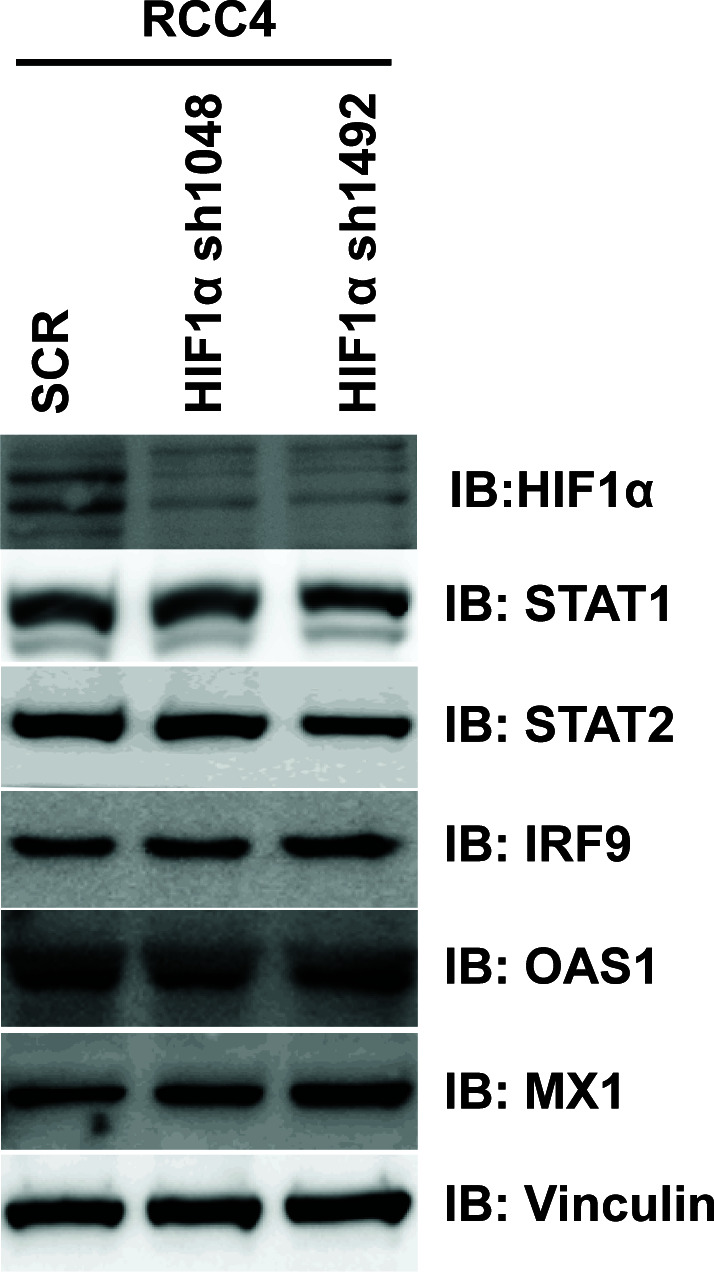
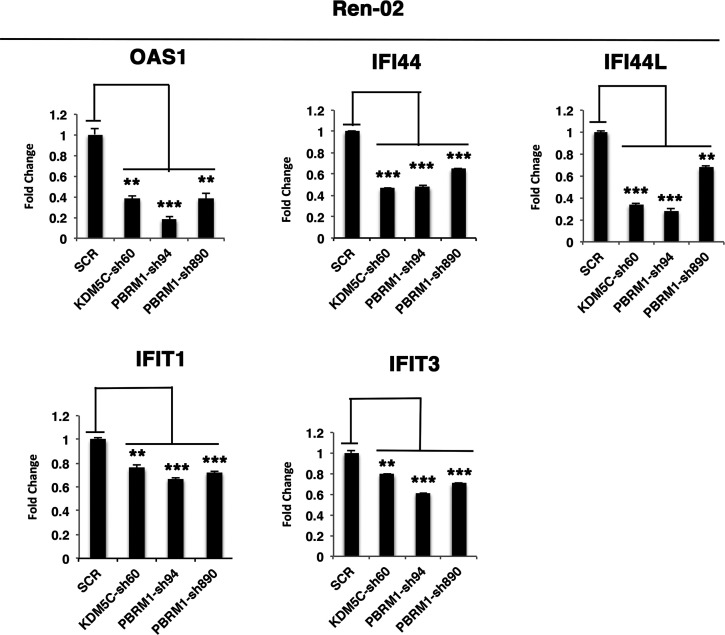
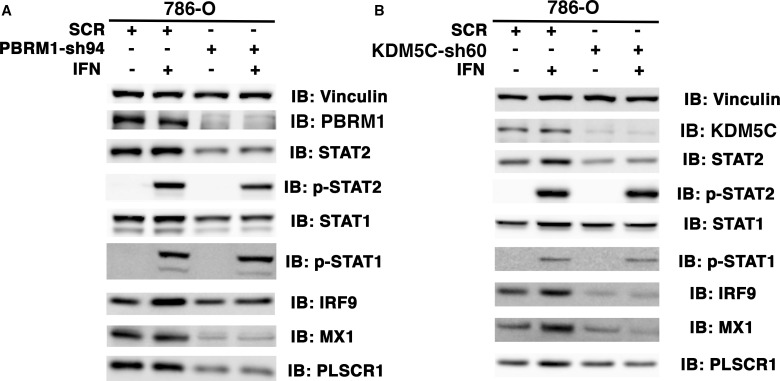
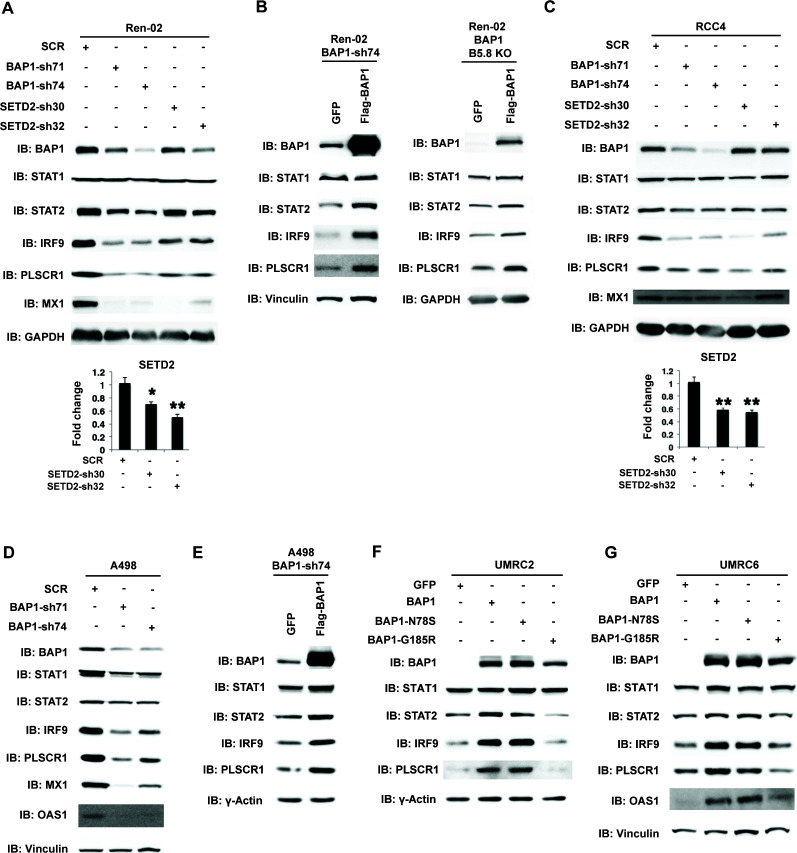
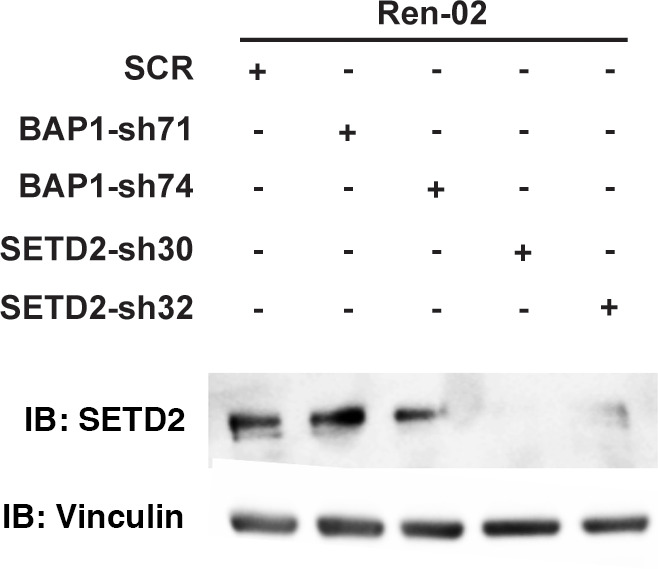
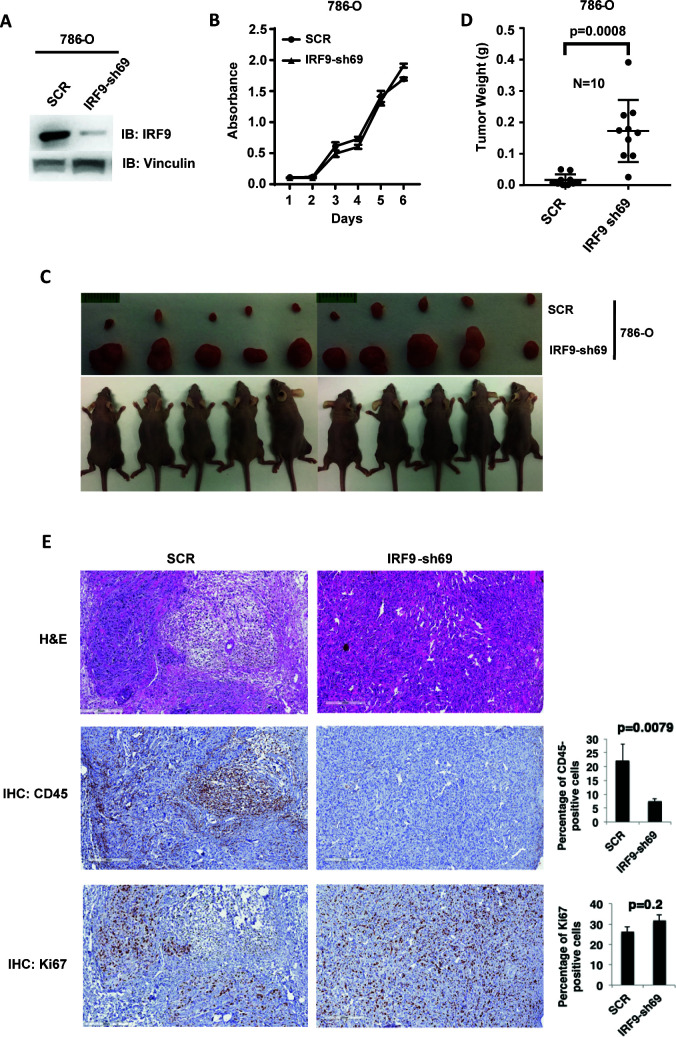
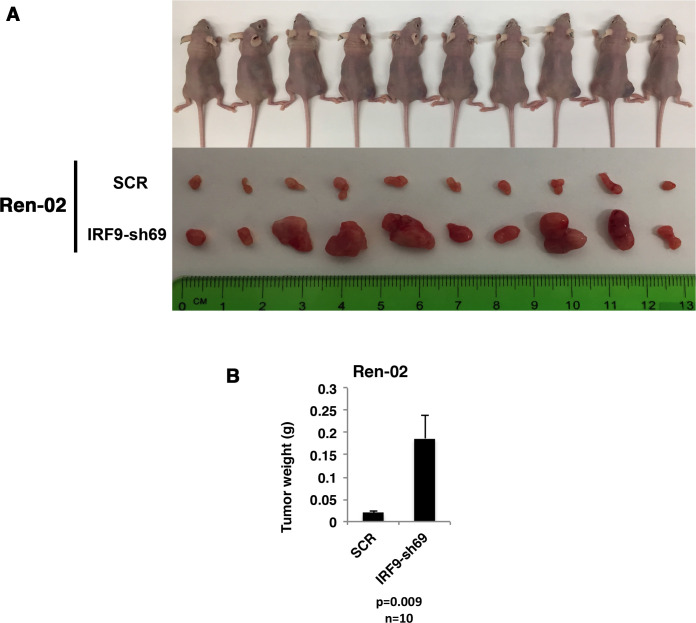
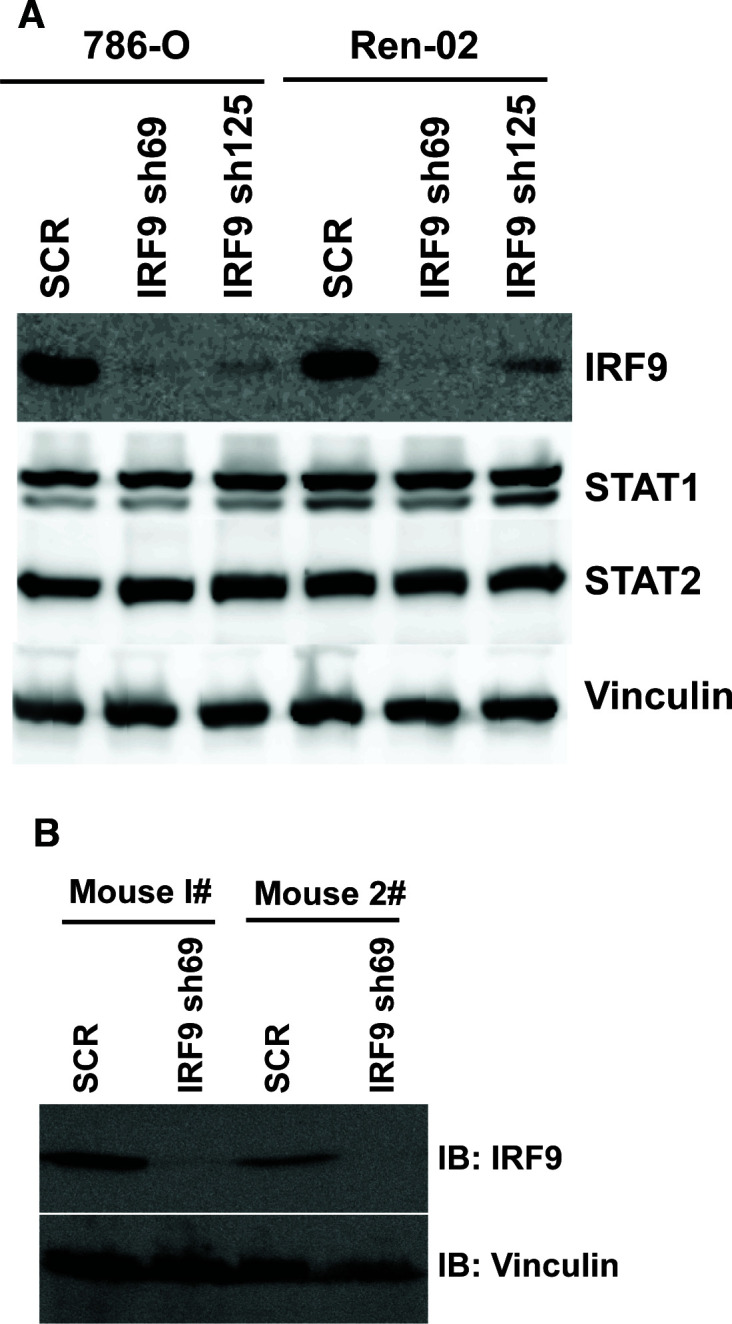
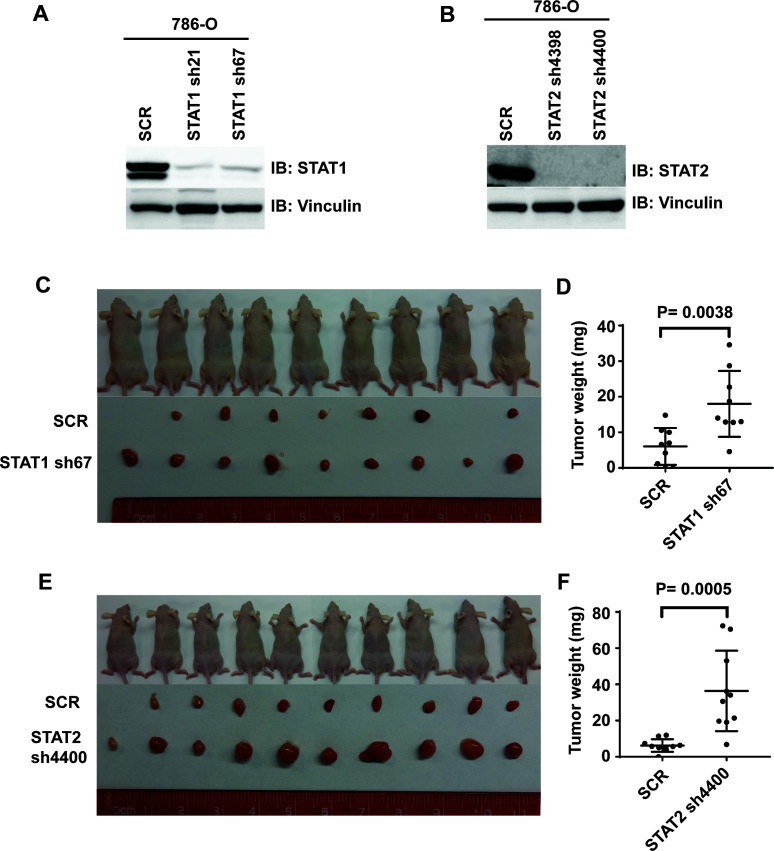
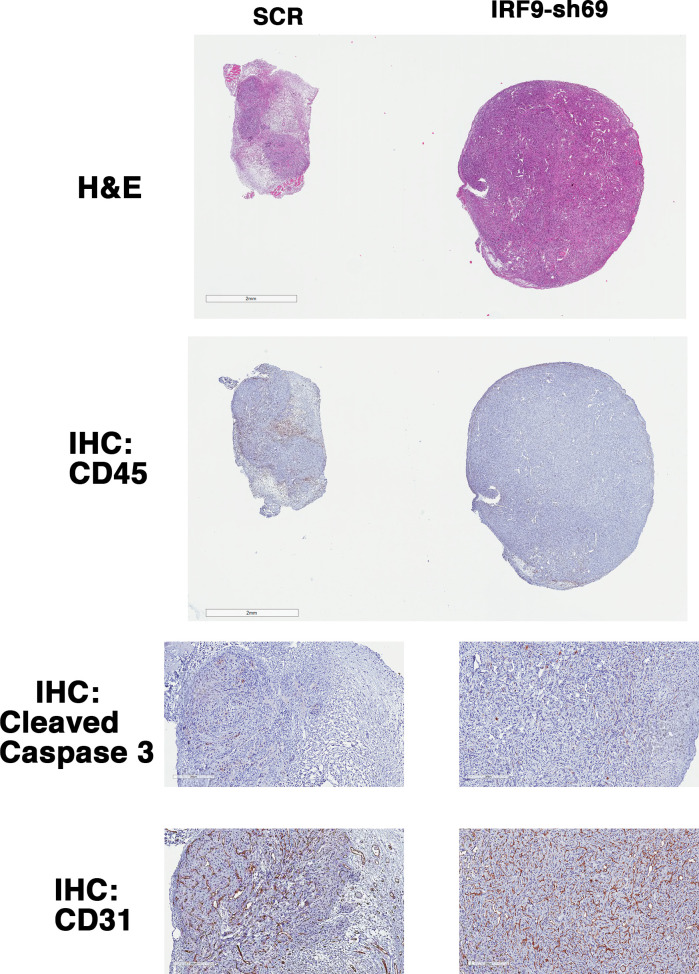
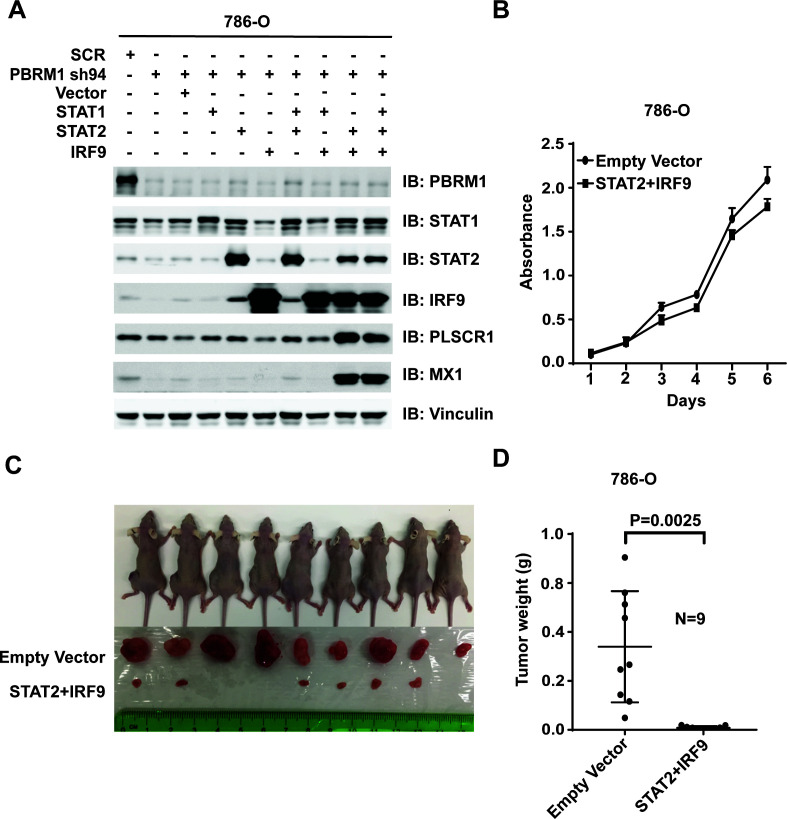
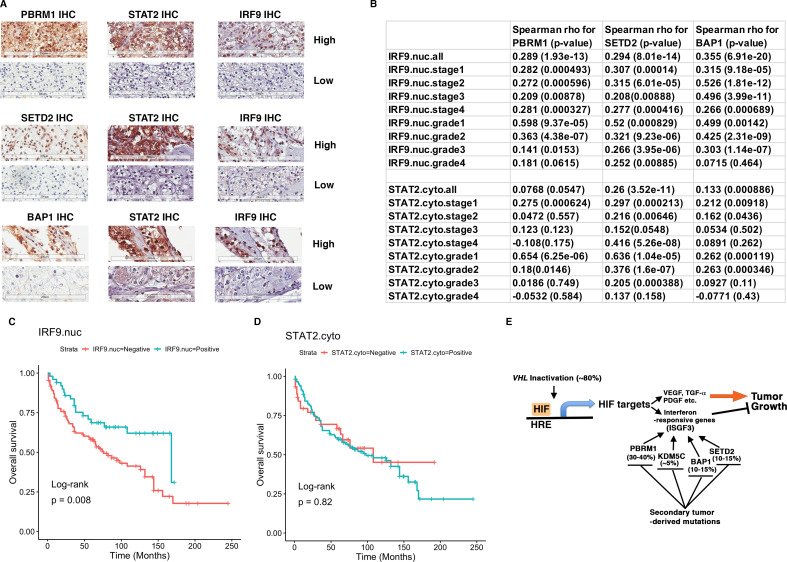
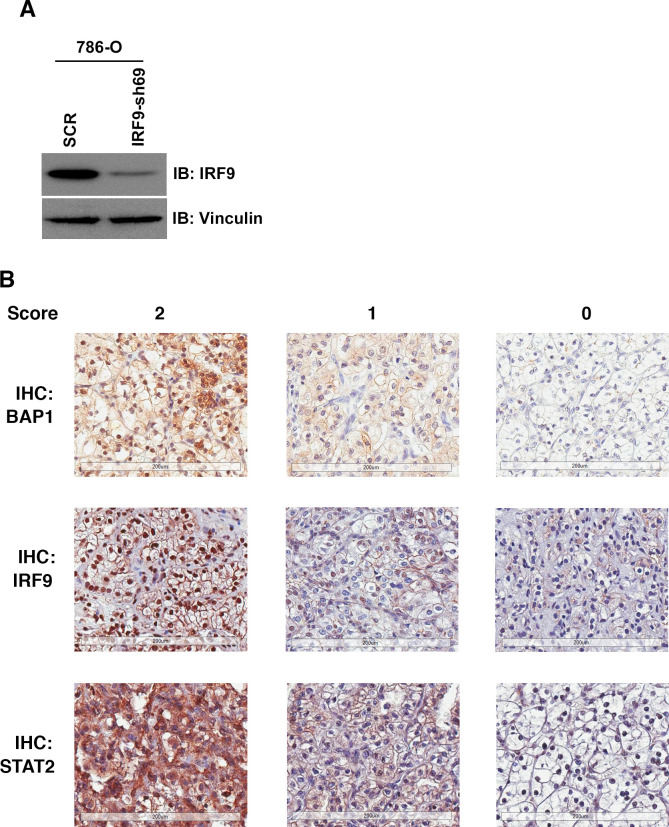
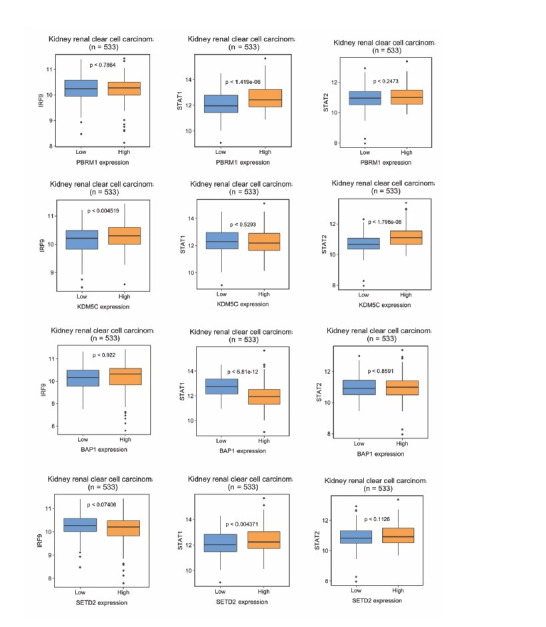
Whereas VHL inactivation is a primary event in clear cell renal cell carcinoma (ccRCC), the precise mechanism(s) of how this interacts with the secondary mutations in tumor suppressor genes, including PBRM1, KDM5C/JARID1C, SETD2, and/or BAP1, remains unclear. Gene expression analyses reveal that VHL, PBRM1, or KDM5C share a common regulation of interferon response expression signature. Loss of HIF2α, PBRM1, or KDM5C in VHL-/-cells reduces the expression of interferon stimulated gene factor 3 (ISGF3), a transcription factor that regulates the interferon signature. Moreover, loss of SETD2 or BAP1 also reduces the ISGF3 level. Finally, ISGF3 is strongly tumor-suppressive in a xenograft model as its loss significantly enhances tumor growth. Conversely, reactivation of ISGF3 retards tumor growth by PBRM1-deficient ccRCC cells. Thus after VHL inactivation, HIF induces ISGF3, which is reversed by the loss of secondary tumor suppressors, suggesting that this is a key negative feedback loop in ccRCC.

Keywords: BAP1; ISGF3; KDM5C; PBRM1; VHL; cancer biology; chromosomes; gene expression; human; kidney cancer.


Conflict of interest statement

LL, ZL, LL, WC, EC, JN, XN, WJ, ZZ, WC, GJ, ED, JT, RU, YW, GS, JS, SP, YX, QY, HY No competing interests declared

Figures

Figure 1.
Figure 1.. IFN-responsive genes were downregulated by VHL and upregulated by PBRM1.
(A) Venn diagram showing that PBRM1 loss had greater impact on transcriptome in VHL-/- cells than that in VHL+/+ cells; (B) Venn diagram showing the overlap of genes downregulated by VHL and upregulated by PBRM1 in 786-O cells. P-values were calculated with hypogeometric probability. (C) Enriched gene ontology (GO) analysis of genes regulated both by VHL and PBRM1. (D) GSEA analysis of genes upregulated by PBRM1. (E) Heatmap showing the expression of IFN-responsive genes after PBRM1 knockdown.
Figure 2.
Figure 2.. IFN-responsive genes were downregulated by VHL and upregulated by KDM5C.
(A) Venn diagram showing that KDM5C loss had greater impact on transcriptome in VHL-/- cells than that in VHL+/+ cells; (B) Venn diagram showing the overlap of genes downregulated by VHL and upregulated by KDM5C in 786-O cells. P-values were calculated with hypogeometric probability. (C) Enriched gene ontology (GO) analysis of genes regulated both by VHL and KDM5C. (D) GSEA analysis of genes upregulated by KDM5C. (E) Heatmap showing the expression of IFN-responsive genes after KDM5C knockdown.
Figure 3.
Figure 3.. Suppression of KDM5C or PBRM1 had similar impact on gene expression in ccRCC cells.
(A) Venn diagrams showing the overlaps of genes whose expression are affected by PBRM1 or KDM5C losses in 786-O. The p-value significance of the overlap in a Venn diagram was calculated using hypergeometric test in R; (B) Enriched gene ontology (GO) analysis of genes regulated both by PBRM1 and KDM5C; (C) Heat map of shared gene targets by PBRM1 and KDM5C; (D-E) Examination of mRNA expression of individual genes by RT-qPCR in 786-O (D) and Ren-02 (E) after PBRM1 or KDM5C was suppressed by shRNA. The p-value significance in the bar graph was calculated with two-tailed student t test. *p<0.05; **p<0.01; ***p<0.001. analysis of the shared genes that are suppressed by PBRM1 or KDM5C did not reveal any significantly impacted pathway, but the shared induced genes showed that ‘response to virus’ was significantly enriched (Figure 3B). The heat map shows the commonly affected genes (Figure 3C). To confirm that the transcriptional response was not the result of the off-target effects of a single shRNA, we suppressed the expression of PBRM1 or KDM5C with two shRNA constructs each. Then, we measured the expression of selected IFN-responsive genes with RT-PCR, and found that the transcriptional changes in IL6, ISG20, IL8, ARPC4, GAS6, and STMN3 were consistent (Figure 3D). To ensure that our observation is not confined to just one cell line, we performed similar experiments in Ren-02 cells, another VHL-/- ccRCC cell line. Again, the suppression of PBRM1 or KDM5C with different shRNA constructs produced consistent transcriptional changes (Figure 3E), suggesting that PBRM1 loss or KDM5C loss elicits similar transcriptional responses.
Figure 4.
Figure 4.. PBRM1 interacts with KDM5C.
(A) The indicated plasmids were transfected into HEK293T cells. Immunoprecipitations were performed followed by immunoblots with the indicated antibodies. Flag-PBRM1 (B) or Flag-KDM5C (C) was transfected into HEK293T cells. Immunoprecipitations were performed followed by immunoblots with the indicated antibodies. (D) HEK293T cell lysate was immunoprecipitated with indicated antibodies followed by immunoblots with the indicated antibodies. (E) A schematic diagram of PBRM1 constructs used for KDM5C interaction analysis (top). The indicated plasmids were transfected into HEK293T cells. Immunoprecipitations were performed followed by immunoblots with the indicated antibodies (bottom).
Figure 5.
Figure 5.. HIF, PBRM1 and KDM5C are required for the expression and activity of ISGF3.
A Venn diagram showing the overlaps of genes whose expression was affected by VHL, PBRM1 or KDM5C losses in 786-O cells. The p-value significance of the overlap in a venn diagram was calculated using hypergeometric test in R; (B) Heat map of shared gene targets by VHL, PBRM1 and KDM5C; (C) Enriched gene ontology (GO) analysis of genes regulated both by VHL, PBRM1 and KDM5C; (D) Western blots with the indicated antibodies in 786-O cell SDS-solubilized whole cell lysates with HIF2α, PBRM1 or KDM5C suppressed by shRNA; (E) Examination of mRNA expression of individual genes by RT-qPCR in 786-O cells after PBRM1 or KDM5C suppression by shRNA; (F) Western blots with the indicated antibodies in Ren-02 cell SDS-solubilized whole cell lysates with HIF2α, PBRM1 or KDM5C suppressed by shRNA. The p-value significance in the bar graph was calculated with two-tailed student t test. *p<0.05; **p<0.01; ***p<0.001.
Figure 5—figure supplement 1.
Figure 5—figure supplement 1.. Over-expression of HIF2α in VHL+/+ccRCC cells increases ISGF3 levels and activity.
Empty vector or HA-HIF2αdpa (a stable and constitutively active HIF2α mutant) was transiently transfected into VHL-proficient Caki-1 or Ren-01 ccRCC cells. The SDS cellular lysates were subjected to SDS-PAGE then blotted with the indicated antibodies.
Figure 5—figure supplement 2.
Figure 5—figure supplement 2.. Suppression of HIF1α does not reduce ISGF3 protein level or function in RCC4 cells.
HIF1α was stably suppressed by shRNA constructs in RCC4 cells and the lysates were immunoblotted with indicated antibodies.
Figure 5—figure supplement 3.
Figure 5—figure supplement 3.. The reduced expression of ISGF3 targets in Ren-02 cells after suppression of PBRM1 or KDM5C.
Examination of mRNA expression of individual genes by RT-qPCR in Ren-02 cells after PBRM1 or KDM5C suppression by shRNA. The p-value significance in the bar graph was calculated with two-tailed student t test. *p<0.05; **p<0.01; ***p<0.001.
Figure 5—figure supplement 4.
Figure 5—figure supplement 4.. The ISGF3 is mostly unphosphorylated in 786-O ccRCC cells.
786-O cells expressing SCR, PBRM1-sh94 (A) or KDM5C-sh60 (B) were mock treated or treated with interferon alpha for two hours. The SDS cellular lysates were subjected to SDS-PAGE then blotted with the indicated antibodies.
Figure 6.
Figure 6.. BAP1 and SETD2 are required for the expression and activity of ISGF3.
SDS-solubilized whole cell lysates of Ren-02 cells expressing control shRNA or shRNA against BAP1 or SETD2 were blotted with the indicated antibodies.(B) Control vector expressing GFP or BAP1 were stably transfected into Ren-02 cells expressing BAP1-sh74 (left). The BAP1 plasmid carries silent mutations against BAP1-sh74 to cancel the effect of shRNA. Control vector expressing GFP or BAP1 were transiently transfected into a Ren-02 clone with BAP1 knocked out by CRISPR/Cas9 (right). The SDS-solubilized whole cell lysates were blotted with the indicated antibodies. C-D) SDS-solubilized whole cell lysates of RCC4 cells (C) or A498 cells (D) expressing the indicated shRNA constructs were blotted with the indicated antibodies. The knockdown efficiency of SETD2 was measured with RT-PCR in panels A and C. (E). Control vector expressing GFP or BAP1 with silent mutations were stably transfected into A498 cells expressing BAP1-sh74. BAP1-null UMRC2 (F) or UMRC6 (G) ccRCC cells were stably transfected with indicated plasmids. The SDS-solubilized whole cell lysates were blotted with the indicated antibodies.
Figure 6—figure supplement 1.
Figure 6—figure supplement 1.. Suppression of SETD2 expression by western blot.
Lysates from Ren-02 cells stably expressed indicated shRNA constructs were immunoblotted with indicated antibodies.
Figure 7.
Figure 7.. Suppression of IRF9, a key component of ISGF3, led to enhanced tumor growth and significantly less tumor-infiltrating immune cells.
(A) SDS-solubilized whole cell lysates of 786-O cells expressing control shRNA or shRNA against IRF9 were blotted with indicated antibodies; (B) The growth rate of the indicated cell lines measured by WST-1 assay; (C) Pictures of mice and xenografted tumors and (D) Quantification of tumor weights originating from same number of cancer cells described in (A) in athymic nude mice. The p-value was calculated with two-tailed student t test; (E) H&E or immunohistochemistry stains of slides from the representative pair five tumors. The percentages of CD45- or Ki67-positive cancer cells in the tumors were quantified with analytic programs in Aperio software. The p-values were calculated with Mann Whitney-Wilcoxon.
Figure 7—figure supplement 1.
Figure 7—figure supplement 1.. Suppression of IRF9 significantly enhanced tumor growth by Ren-02 cells.
VHL-deficient ccRCC cells Ren-02 were stably infected with SCR or IRF9-sh69. (A) Pictures of mice and xenografted tumors and (B) Quantification of tumor weights originating from same number of cancer cells in athymic nude mice.
Figure 7—figure supplement 2.
Figure 7—figure supplement 2.. Stable suppression of IRF9 in ccRCC cells and xenograft tumors.
(A) The IRF9 was suppressed by shRNA in 786-O or Ren-02 cells. The lysates were examined with indicated antibodies. (B) Lysates were made from two pairs of tumors described in Figure 7C (derived from 786-O cells) and immunoblotted with indicated antibodies.
Figure 7—figure supplement 3.
Figure 7—figure supplement 3.. Suppression of STAT1 or STAT2 promotes tumor growth.
STAT1 (A) and STA2 (B) were stably suppressed by shRNA in 786-O cells. Control cells and STAT1 or STAT2-suppressed cells were subjected to xenograft analysis. (C) and (E) Pictures of mice and xenografted tumors. (D) and (F) Quantification of tumor weights originating from the same number of cancer cells in nude mice.
Figure 7—figure supplement 4.
Figure 7—figure supplement 4.. IRF9 loss does not lead to significant changes in apoptosis or blood vessel density.
Representative 786-O xenograft tumors expressing SCR or IRF9-sh69 were subjected to H&E or immunohistochemistry analyses with indicated antibodies.
Figure 8.
Figure 8.. Over-expression of IRF9 and STAT2 restored ISGF3 function and retarded tumor growth of 786-O cells with PBRM1 suppressed.
(A) 786-O cells were infected with the indicated viral vectors. SDS-solubilized whole cell lysates were blotted with the indicated antibodies. (B) Cellular growth of indicated cell lines measured by WST-1 assay; (C) Pictures of mice and xenografted tumors and (D) Quantification of tumor weights originating from the same number of cancer cells expressing either an empty vector or STAT2 plus IRF9 in athymic nude mice. The p-value was calculated with two-tailed student t test.
Figure 9.
Figure 9.. IRF9 and STAT2 expression significantly correlated with the expression of PBRM1, SETD2, or BAP1 in ccRCC tumors.
(A) 20x IHC images of representative ccRCC foci stained with indicated antibodies. (B) Spearman correlation coefficient, rho, and p-value of nuclear (nuc) IRF9 or cytoplasmic (cyto) IHC signals with those of PBRM1, SETD2 or BAP1. The analysis was performed with either all the foci or the foci within each tumor stage or tumor grade. (C) Kaplan-Meier curves of patient overall survival based on the positive or negative IHC signal of nuclear IRF9 and (D) cytoplasmic STAT2. Statistical significance calculated using the log-rank test. (E) A schematic diagram showing how HIF and secondary tumor suppressors converge on ISGF3 to regulate tumor growth in ccRCC. HIF activates ISGF3 that suppresses tumor growth. PBRM1, KDM5C, SETD2 and BAP1 all support the function of ISGF3. Mutations in any of them relieve the tumor suppressive function of HIF2α.
Figure 9—figure supplement 1.
Figure 9—figure supplement 1.. ISGF3 subunits correlate positively with immune cell markers and negatively with cancer cell markers in the TCGA dataset.
Correlations between IRF9, STAT1 or STAT2 with immune and tumor cell markers within the TCGA dataset. N = 534; PTPRC, CD45; CD247, T-Cell Receptor T3 Zeta Chain; CD3G, T-Cell Receptor T3 Gamma Chain; CDH1, E-cadherin.
Figure 9—figure supplement 2.
Figure 9—figure supplement 2.. STAT2 and IRF9 protein levels are significantly higher in immune cells than that in kidney cells.
IHC images of STAT2 (A) and IRF9 (B) stained human tissue samples from kidney, renal cell carcinoma, lymph node, spleen, and lung. For each antibody, the top is the macroscopic image of the slide, and the bottom shows the 20x image of each tissue.
Figure 9—figure supplement 3.
Figure 9—figure supplement 3.. IHC staining of ccRCC tumors with BAP1, IRF9 or STAT2 antibodies.
(A) 786-O cells were infected with the indicated shRNA constructs and the lysates were immunoblotted with indicated antibodies. (B) Representative images of foci from the TMA that were stained with indicated antibodies. Scoring: 2:>=50% of cancer cells stained positive; 1: 5–49% of cancer cells stained positive; 0:<5% of cancer cells stained positive.
Author response image 1.
Author response image 1.. The correlations between ISGF3 subunits and PBRM1, KDM5C, BAP1 or SEDT2 in the TCGA dataset.
Correlations between IRF9, STAT1 or STAT2 with indicated genes within the TCGA dataset. N = 533.

Comment in

References

    1. Abdel-Rahman MH, Pilarski R, Cebulla CM, Massengill JB, Christopher BN, Boru G, Hovland P, Davidorf FH. Germline BAP1 mutation predisposes to Uveal Melanoma, lung adenocarcinoma, Meningioma, and other cancers. Journal of Medical Genetics. 2011;48:856–859. doi: 10.1136/jmedgenet-2011-100156. - DOI - PMC - PubMed
    1. Abernathy A. U.S. Food and Drug Administration (FDA) Accepts Bristol-Myers Squibb’s Application for Opdivo (nivolumab) Plus Yervoy (ipilimumab) in Intermediate- and Poor-Risk Patients with Advanced Renal Cell Carcinoma and Grants Priority Review. [December 13, 2017];2017 https://investors.bms.com/iframes/press-releases/press-release-details/2...
    1. Avalle L, Pensa S, Regis G, Novelli F, Poli V. STAT1 and STAT3 in tumorigenesis: a matter of balance. Jak-Stat. 2012;72:65–72. doi: 10.4161/jkst.20045. - DOI - PMC - PubMed
    1. Barski A, Cuddapah S, Cui K, Roh TY, Schones DE, Wang Z, Wei G, Chepelev I, Zhao K. High-resolution profiling of histone methylations in the human genome. Cell. 2007;129:823–837. doi: 10.1016/j.cell.2007.05.009. - DOI - PubMed
    1. Benci JL, Xu B, Qiu Y, Wu TJ, Dada H, Twyman-Saint Victor C, Cucolo L, Lee DSM, Pauken KE, Huang AC, Gangadhar TC, Amaravadi RK, Schuchter LM, Feldman MD, Ishwaran H, Vonderheide RH, Maity A, Wherry EJ, Minn AJ. Tumor interferon signaling regulates a multigenic resistance program to immune checkpoint blockade. Cell. 2016;167:1540–1554. doi: 10.1016/j.cell.2016.11.022. - DOI - PMC - PubMed

Publication types

MeSH terms

Substances

LinkOut - more resources