. 2018 Oct 23;25(4):1002-1017.e4.
doi: 10.1016/j.celrep.2018.09.086.

Sox9-Meis1 Inactivation Is Required for Adipogenesis, Advancing Pref-1+ to PDGFRα+ Cells

Affiliations

Sox9-Meis1 Inactivation Is Required for Adipogenesis, Advancing Pref-1+ to PDGFRα+ Cells

Olga Gulyaeva et al. Cell Rep. .

Abstract

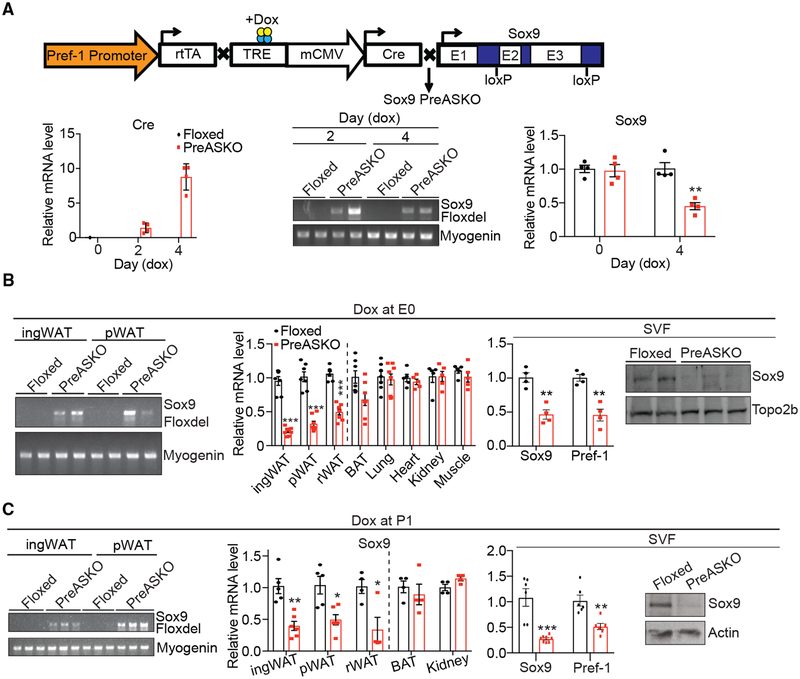
Adipocytes arise from the commitment and differentiation of adipose precursors in white adipose tissue (WAT). In studying adipogenesis, precursor markers, including Pref-1 and PDGFRα, are used to isolate precursors from stromal vascular fractions of WAT, but the relation among the markers is not known. Here, we used the Pref-1 promoter-rtTA system in mice for labeling Pref-1+ cells and for inducible inactivation of the Pref-1 target Sox9. We show the requirement of Sox9 for the maintenance of Pref-1+ proliferative, early precursors. Upon Sox9 inactivation, these Pref-1+ cells become PDGFRα+ cells that express early adipogenic markers. Thus, we show that Pref-1+ cells precede PDGFRα+ cells in the adipogenic pathway and that Sox9 inactivation is required for WAT growth and expansion. Furthermore, we show that in maintaining early adipose precursors, Sox9 activates Meis1, which prevents adipogenic differentiation. Our study also demonstrates the Pref-1 promoter-rtTA system for inducible gene inactivation in early adipose precursor populations.

Keywords: Meis1; PDGFRα; Pref-1; Sox9; adipocyte differentiation; adipose precursors.


Conflict of interest statement

DECLARATION OF INTERESTS

The authors declare no competing financial interests.

Figures

Figure 1.
Figure 1.. Conditional Ablation of Sox9 in Pref-1+ Cells In Vivo
(A) Top: scheme of generation of PreASKO mice. Bottom left: qRT-PCR for Cre in primary ingWAT SVF cells cultured with Dox for 2 and 4 days. Bottom center and right: Sox9 Floxdel PCR using genomic DNA and qRT-PCR for Sox9 in the same cells (N = 4). (B) Left: Sox9 Floxdel PCR using genomic DNA from ingWAT and pWAT. The predicted >10-kb fragment in the absence of Cre-mediated recombination did not produce PCR product due to a limited PCR extension time. Center: qRT-PCR for Sox9 in various tissues of floxed and PreASKO mice fed Dox since E0 (N = 7–8 for fat tissues and N = 5 for control tissues). Right and far right: qRT-PCR and immunoblotting for Sox9 in WAT SVFs of mice fed Dox at E0 (N = 3–4). (C) Left: Sox9 Floxdel PCR using genomic DNA from ingWAT and pWAT. qRT-PCR for Sox9 in various tissues (center) and in ingWAT SVF (right), and immunoblotting for Sox9 in ingWAT SVF (far right) of floxed or PreASKO mice fed Dox at P1 (N = 4–6 and N = 6–8 for tissues and SVFs, respectively). *p < 0.05, **p < 0.01, ***p < 0.001. The error bars represent SEM. See also Figure S1.
Figure 2.
Figure 2.. Requirement of Sox9 Inactivation in Pref-1+ Cells for Adipogenesis In Vitro
(A) qRT-PCR (top left) and immunoblotting (top center) during differentiation and immunostaining at day 0 (top right) for Sox9 in cultured ingWAT SVF after 4 days of Dox treatment (N = 4). Bright field and oil red O (ORO) pictures of these cells at day 7 of differentiation and ORO pictures of the whole dish at day 4 (bottom left). qRT-PCR (N = 4) for various adipogenic genes at day 8 (bottom center) and for FABP4 during differentiation (bottom right). (B) Left: immunoblotting at day 0 for Sox9 in Scr and KO (clonal) 3T3–L1 lines that were grown from a single cell. Center: ORO pictures of these cells at days 7 and 11 of differentiation with rosiglitazone. qRT-PCR (right) (N = 3) and immunoblotting (bottom right) for adipogenic markers at day 11 of differentiation (cells from Figure 2B, bottom right, were treated with rosiglitazone). (C) Left: qRT-PCR (N = 3) (top) and immunoblotting (bottom) for Sox9 at day 0 in clonal Scr and KO cells transduced with adenovirus expressing GFP or Sox9. Center: ORO pictures of KO cells transduced with adeno (Ad)-GFP or Ad-Sox9 at day 8 of differentiation. Right: qRT-PCR (N = 3) for various markers during adipocyte differentiation in these cells. Significance depicted for KO + Sox9 versus KO + GFP. (D) Far left: confocal fluorescent image of implants containing Sox9 KO cells overexpressing GFP or Sox9 at 10 days post-implantation into SCID mice stained with LipidTOX and DAPI (whole mount). Left: average lipid droplet diameter obtained from pictures shown in Figure 2D, far left (N = 444–1,019 lipid droplets analyzed from 4 different implants). qRT-PCR for Sox9 (right) and various adipogenic markers (far right) in these implants (N = 5). Scale bar, 20 μm for all images, except immunostaining in Figure 2A, top, where scale bar represents 100 μm. *p < 0.05, **p < 0.01, ***p < 0.001. The error bars represent SEM. See also Figure S2.
Figure 3.
Figure 3.. Requirement of Sox9 Inactivation in Pref-1+ Cells for Adipogenesis In Vivo
(A) Left: representative image of 11-week-old female mice. Center and right: body weight in female (N = 8) and male mice (N = 8–7 for floxed and PreASKO mice, respectively). (B) Weight determined by EchoMRI (top left) and representative image and tissue weight, expressed as a percentage of body weight (BW) (top right and bottom) in 11-week-old female mice (N = 8). (C) Left: H&E staining of slides from ingWAT and pWAT of 11-week-old female mice. Scale bar, 100 μm. Right: average cell size and cell size distribution in these cells (N = 90–230 cells analyzed). (D) qRT-PCR and immunoblotting for adipogenic markers in ingWAT of 11-week-old female mice (N = 6). (E) Left: representative image of 22-week-old male mice. Right: body weight of male mice (N = 8–11). (F) Left: weight determined by EchoMRI (N = 6–10) in 22-week-old male mice. Right: representative image of tissues from these mice. (G) Left: CT scan image of transverse section of mice from Figure 3E, left. Right: whole-mount images of ingWAT, stained with LipidTOX Green and DAPI, from 22-week-old male mice. Scale bar, 50 μm. (H) GTT (left) performed on 14-week-old male mice and ITT (center) on 17-week-old male mice (N = 8–11), and TAG content in the liver of 22-week-old male mice (N = 8). Dox administration at E0 (A–D) and P1 (E–H). *p < 0.05, **p < 0.01, ***p < 0.001. The error bars represent SEM. See also Figure S3.
Figure 4.
Figure 4.. Sox9 Ablation Depletes the Pool of Pref-1+ Cells by Progressing Them to Become PDGFRα+ Cells Expressing Early Apidogenic Markers
(A) Top: PreASKO-GFP mice were generated by crossing PreASKO mice (Pref-1-rtTA, TRE-Cre, Sox9 floxed) with TRE-GFP mice for fluorescent labeling of rtTA+ (therefore, Pref-1+) cells with Sox9 ablation. Pref-rtTA/TRE-GFP/Sox9 floxed mice were used as controls (referred to as floxed-GFP). Middle: FACS plots (left) and quantification of average cell number of GFP+ cells (right) in ingWAT SVF cells from 3-week-old males fed Dox at P1 (N = 3 independent experiments). Bottom: representative image of Pref-1, Na+/K+ pump, and DAPI immunostaining and quantification in ingWAT from mice, as in Figure 3A, left (N = 5). Scale bar, 20 μm. (B) Top left: qRT-PCR for Sox9 and Pref-1 in GFP+ cells. Center and right: RNA-seq heatmap of differentially expressed genes (>2-fold) between GFP+ floxed-GFP and PreASKO-GFP ingWAT SVF cells from 3-week-old males fed Dox at P1 (N = 6). Middle and bottom: qRT-PCR verification of selected genes (N = 4). (C) Top: FACS plots for no antibody control or PDGFRα antibody used to stain ingWAT SVF cells from 6-week-old female mice (N = 5). Middle left: qRT-PCR for PDGFRα in sorted populations from ingWAT SVF of 3-week-old floxed and PreASKO males (N = 3). Middle right: average quantification of PDGFRα+ cells in ingWAT from 3- to 11.5-week-old female and male mice (N = 4 on average) from 5 independent experiments. Bottom: immunostaining images and their quantification from ingWAT sections stained with PDGFRα antibody from mice, as in Figure 3A, left. Scale bar, 20 μm (N = 5). (D) Top left: qRT-PCR for Sox9 in sorted populations from ingWAT SVF of 3-week-old floxed and PreASKO males (N = 3). Center and right: RNA-seq heatmap of differentially expressed genes (>2-fold) between floxed and PreASKO PDGFRα+ ingWAT SVF cells. Bottom left: qRT-PCR verification of selected genes (N = 3). Unless otherwise noted, all mice were fed Dox at P1. *p < 0.05, **p < 0.01, ***p < 0.001. developm, development; diff, differentiation; prolif, proliferation; SC, stem cell. The error bars represent SEM. See also Figure S4.
Figure 5.
Figure 5.. Sox9 Maintains Highly Proliferative Pref-1+: CD24+ Adipose Precursors that Are Earlier than PDGFRα+ Cells
(A) Overlap of >2-fold downregulated (left) or upregulated (right) genes between RNA-seq from GFP+ and PDGFRα+ cells in the absence of Sox9. (B) Top left: EdU incorporation into various Lin populations of ingWAT SVF sorted for GFP and CD24 in 4-week-old female floxed-GFP mice (N = 6). Top center: qRT-PCR for Pref-1, Sox9, and PDGFRα in various sorted populations from ingWAT SVF of 5-week-old floxed-GFP and PreASKO-GFP mice of both genders (N = 3). Bottom: qRT-PCR for C/EBPβ/δ in cells described at top left. (C) EdU incorporation (left) and qRT-PCR (right) in SVF cells sorted for GFP and PDGFRα isolated from ingWAT of 4-week-old floxed-GFP male mice (N = 3). Significance is depicted for all populations versus GFP+: PDGFRα cells. Bottom: qRT-PCR for CD24, Sox9, and C/EBPβ in various Lin populations sorted for GFP and PDGFRα in 5-week-old floxed-GFP and PreASKO-GFP mice of both genders (N = 3). Mice in B and C were fed Dox at E0. *p < 0.05, **p < 0.01, ***p < 0.001. Black or gray bars represent populations from floxed-GFP mice. The error bars represent SEM. See also Figure S5.
Figure 6.
Figure 6.. Sox9 Binds and Activates Meis1 in Early Adipose Precursors
(A) Left: representation of Sox9 binding in the reference to TSS of associated genes from Sox9 ChIP-seq in 3T3–L1 cells. Right: top 2 motifs enriched in Sox9 peaks and their corresponding p values. (B) Top: overlap (75 common genes) between 1,220 genes >2-fold downregulated in GFP+ RNA-seq in the absence of Sox9 and 3,142 targets of Sox9 from ChIP-seq in 3T3–L1 cells. Bottom: 17/75 genes >30% downregulated in RNA-seq from PDGFRα+ cells in the absence of Sox9, of which 3 were transcription factors (TFs). (C) qRT-PCR for various genes during the differentiation of 3T3–L1 cells (N = 3). (D) Left: ChIP-qPCR for Meis1 and ChIP-PCR for other genes identified from ChIP-seq. Right: Sox9 peak and peaks for various histone modifications from ChIP-seq in 3T3–L1 cells. (E) qRT-PCR for Meis1 in Scr and 3T3–L1 KO cells (single clones) at confluence (N = 6). (F) Left: qRT-PCR for various genes in fractionated adipocytes or SVFs of WAT from wild-type mice (N = 4). (G) qRT-PCR for various genes in Lin and Lin+ sorted ingWAT SVF populations of 4-week-old wild-type male mice (N = 4). (H) qRT-PCR for Meis1 and GFP in sorted populations from Figure 5C, bottom. *p < 0.05, **p < 0.01, ***p < 0.001. The error bars represent SEM. See also Figure S6.
Figure 7.
Figure 7.. Meis1 Contributes to Sox9-Mediated Inhibition of Adipogenesis
(A) Left: qRT-PCR for Meis1 in Scr or Sox9 KO 3T3–L1 cells overexpressing empty vector (EV) control or Meis1 at confluence (N = 4). Right: qRT-PCR for various adipogenic genes in these cells at day 2 of adipogenic differentiation (N = 3). Significance depicted for Meis1 overexpression versus EV control. (B) Top left: qRT-PCR and immunoblotting for Meis1 levels in confluent 3T3–L1 cells transfected with Scr or siRNA targeting Meis1 (N = 6). Top right: ORO pictures of 3T3–L1 cells from above after 3 and 6 days of adipogenic differentiation. Bottom: qRT-PCR for various adipogenic markers during differentiation from these cells (N = 3). (C) ChIP-qPCR for Meis1 binding at various regions of early adipogenic genes (N = 3). *p < 0.05, **p < 0.01, ***p < 0.001. The error bars represent SEM. See also Figure S6.

References

    1. Akiyama H, Chaboissier M-C, Martin JF, Schedl A, and de Crombrugghe B (2002). The transcription factor Sox9 has essential roles in successive steps of the chondrocyte differentiation pathway and is required for expression of Sox5 and Sox6. Genes Dev. 16, 2813–2828. - PMC - PubMed
    1. Akiyama H, Lyons JP, Mori-Akiyama Y, Yang X, Zhang R, Zhang Z, Deng JM, Taketo MM, Nakamura T, Behringer RR, et al. (2004). Interactions between Sox9 and b-catenin control chondrocyte differentiation. Genes Dev. 18, 1072–1087. - PMC - PubMed
    1. Azcoitia V, Aracil M, Martínez-A C, and Torres M (2005). The homeodomain protein Meis1 is essential for definitive hematopoiesis and vascular patterning in the mouse embryo. Dev. Biol 280, 307–320. - PubMed
    1. Bailey TL, and Elkan C (1994). Fitting a mixture model by expectation maximization to discover motifs in biopolymers. Proc. Int. Conf. Intell. Syst. Mol. Biol 2, 28–36. - PubMed
    1. Berry R, and Rodeheffer MS (2013). Characterization of the adipocyte cellular lineage in vivo. Nat. Cell Biol 15, 302–308. - PMC - PubMed

Publication types

Substances