. 2018 Oct 23;25(4):1018-1026.e4.
doi: 10.1016/j.celrep.2018.09.074.

Oncogenic R132 IDH1 Mutations Limit NADPH for De Novo Lipogenesis through (D)2-Hydroxyglutarate Production in Fibrosarcoma Sells

Affiliations

Oncogenic R132 IDH1 Mutations Limit NADPH for De Novo Lipogenesis through (D)2-Hydroxyglutarate Production in Fibrosarcoma Sells

Mehmet G Badur et al. Cell Rep. .

Erratum in

Abstract

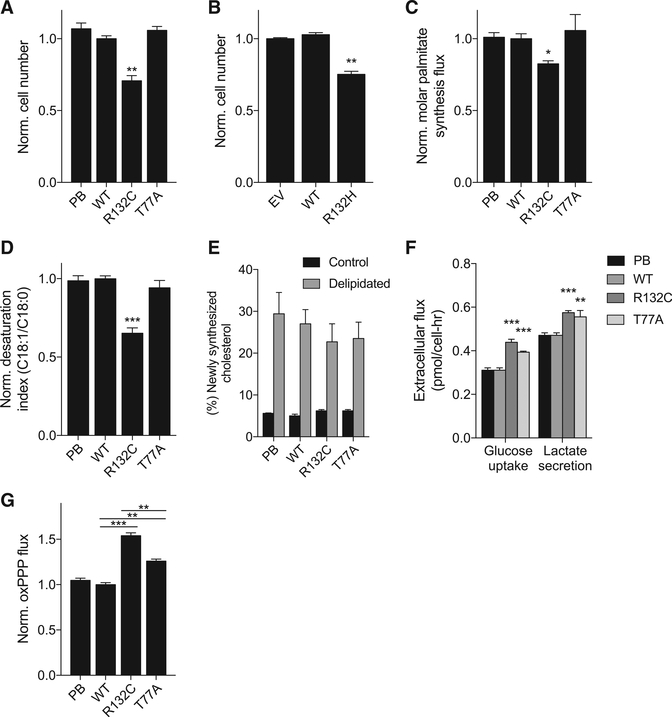
Neomorphic mutations in NADP-dependent isocitrate dehydrogenases (IDH1 and IDH2) contribute to tumorigenesis in several cancers. Although significant research has focused on the hypermethylation phenotypes associated with (D)2-hydroxyglutarate (D2HG) accumulation, the metabolic consequences of these mutations may also provide therapeutic opportunities. Here we apply flux-based approaches to genetically engineered cell lines with an endogenous IDH1 mutation to examine the metabolic impacts of increased D2HG production and altered IDH flux as a function of IDH1 mutation or expression. D2HG synthesis in IDH1-mutant cells consumes NADPH at rates similar to de novo lipogenesis. IDH1-mutant cells exhibit increased dependence on exogenous lipid sources for in vitro growth, as removal of medium lipids slows growth more dramatically in IDH1-mutant cells compared with those expressing wild-type or enzymatically inactive alleles. NADPH regeneration may be limiting for lipogenesis and potentially redox homeostasis in IDH1-mutant cells, highlighting critical links between cellular biosynthesis and redox metabolism.

Keywords: 2-hydroxyglutrate (2HG); IDH1; IDH2; NADPH; cancer; deuterium; metabolic flux analysis; metabolism; redox metabolism.


Conflict of interest statement

DECLARATION OF INTERESTS

C.M.M. has previously consulted for Agios Pharmaceuticals.

Figures

Figure 1.
Figure 1.. Metabolic Characterization of Isogenic IDH1-Expressing HT1080 Cell Lines
(A) Depiction of enzymatic activity present in each cell line. (B) Relative intracellular abundance of glycolytic intermediates, TCA cycle metabolites, and amino acids (n = 6). Normalized to PB. (C) Atom transition map of [U-13C5]glutamine for reductive and oxidative metabolism. Glutaminase and transamination of glutamate to aKG require concomitant amination of keto-acids (KA) to amino acids (AA) (e.g., Asp, Ala, Pro, Ser). Oxidative TCA flux leads to M+4 citrate. Reductive carboxylation of aKG leads to the M+5 citrate and subsequently M+3 aspartate. (D) Percentage of M+5 citrate from [U-13C5]glutamine in normoxia and hypoxia. (E) Percentage of M+3 aspartate from [U-13C5]glutamine in normoxia and hypoxia. In (B), (D), and (E), data are plotted as mean ± SEM. Unless indicated, all data represent biological triplicates. See also Figure S1.
Figure 2.
Figure 2.. Tracing NAD(P)H Regeneration and 2HG Production in HT1080-IDH1 Cell Lines
(A) Atom transition map of [4-2H]glucose. The tracer labels cytosolic NADH through GAPDH, leading to downstream labeling through lactate dehydrogenase (LDH), malate dehydrogenase (MDH), and glycerol-3-phosphate dehydrogenase (Gly3PDH). (B) Percentage M+1 label from [4-2H]glucose is not altered by IDH1 status. (C) Relative intracellular abundance of 2-hydroxyglutarate is increased in R132C cells. (D) Percentage M+1 2HG label from [4-2H]glucose and [3-2H]glucose. (E) Depiction of L2HG and D2HG production by NAD(P)H. In (B)–(D), data are plotted as mean ± SEM. Unless indicated, all data represent biological triplicates.
Figure 3.
Figure 3.. D2HG Production and Secretion Increase NADPH Demands in IDH1+/R132C Cells
(A) NADPH consumption fluxes by lipid synthesis and 2HG production in fibrosarcoma panel. (B) Atom transition map of [3-2H]glucose. (C) Contribution of oxPPP to cytosolic NADPH in fibrosarcoma panel. (D) 2HG abundance in parental HT1080 cells upon treatment with 10 mM AGI-5198. (E) Contribution of oxPPP to cytosolic NADPH in parental HT1080 cells with 10 mM AGI-5198. (F) Contribution of oxPPP to cytosolic NADPH in non-native IDH1-R132H engineered HCT116 cells. In (A), (C), (E), and (F), data are plotted as mean ± 95% confidence interval (CI). *Statistical significance by non-overlapping confidence intervals. In (D), data are plotted as mean ± SEM. Unless indicated, all data represent biological triplicates. See also Figure S2.
Figure 4.
Figure 4.. D2HG Production Limits NADPH for DNL in Lipid-Deficient Conditions
(A) Normalized cell number of fibrosarcoma panelafter 48 hr in delipidated conditions. (B) Normalized cell number of HOG panel ectopically expressing IDH1 after 96 hr in delipidated conditions. (C) Normalized molar palmitate synthesis flux infibrosarcoma panel. (D) Normalized desaturation index (C18:1/C18:0) in fibrosarcoma panel. (E) Percentage newly synthesized cholesterol after24 hr in control or delipidated conditions in fibrosarcoma panel. (F) Extracellular glucose uptake and lactate effluxin fibrosarcoma panel. (G) Normalized oxPPP flux in delipidated conditions in fibrosarcoma panel. In (A)–(D), (F), and (G), data are plotted as mean ± SEM. In (E), data are plotted as mean ± 95% CI. Unless indicated, all data represent biological triplicates. See also Figures S3 and S4.

References

    1. Ackerman D, and Simon MC (2014). Hypoxia, lipids, and cancer: surviving the harsh tumor microenvironment. Trends Cell Biol. 24, 472–478. - PMC - PubMed
    1. Badur MG, and Metallo CM (2018). Reverse engineering the cancer metabolic network using flux analysis to understand drivers of human disease. Metab. Eng 45, 95–108. - PMC - PubMed
    1. Badur MG, Zhang H, and Metallo CM (2015). Enzymatic passaging of human embryonic stem cells alters central carbon metabolism and glycan abundance. Biotechnol. J 10, 1600–1611. - PMC - PubMed
    1. Cantor JR, Abu-Remaileh M, Kanarek N, Freinkman E, Gao X, Louissaint A Jr., Lewis CA, and Sabatini DM (2017). Physiologic medium rewires cellular metabolism and reveals uric acid as an endogenous inhibitor of UMP synthase. Cell 169, 258–272.e17. - PMC - PubMed
    1. Carbonneau M, M Gagnè L, Lalonde ME, Germain MA, Motorina A, Guiot MC, Secco B, Vincent EE, Tumber A, Hulea L, et al. (2016). The oncometabolite 2-hydroxyglutarate activates the mTOR signalling pathway. Nat. Commun 7, 12700. - PMC - PubMed

Publication types