. 2018 Oct 23;25(4):893-908.e7.
doi: 10.1016/j.celrep.2018.09.087.

Completeness of HIV-1 Envelope Glycan Shield at Transmission Determines Neutralization Breadth

Affiliations

Completeness of HIV-1 Envelope Glycan Shield at Transmission Determines Neutralization Breadth

Kshitij Wagh et al. Cell Rep. .

Abstract

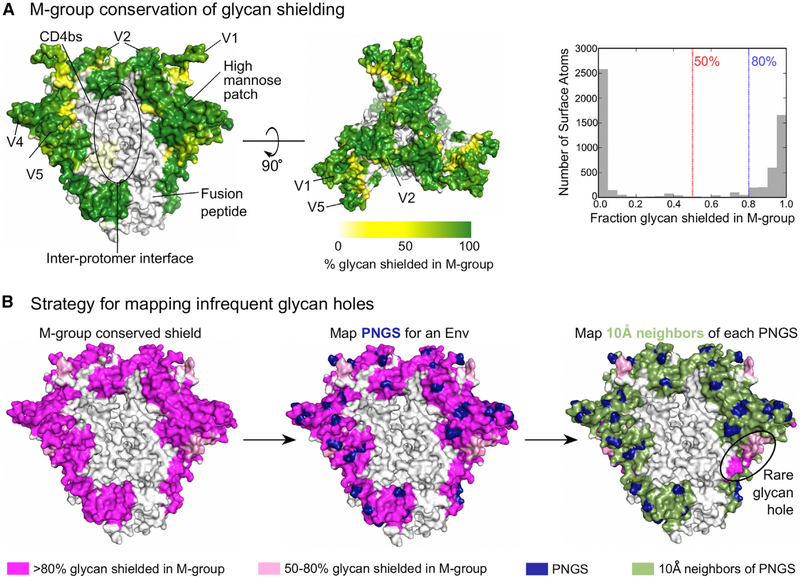
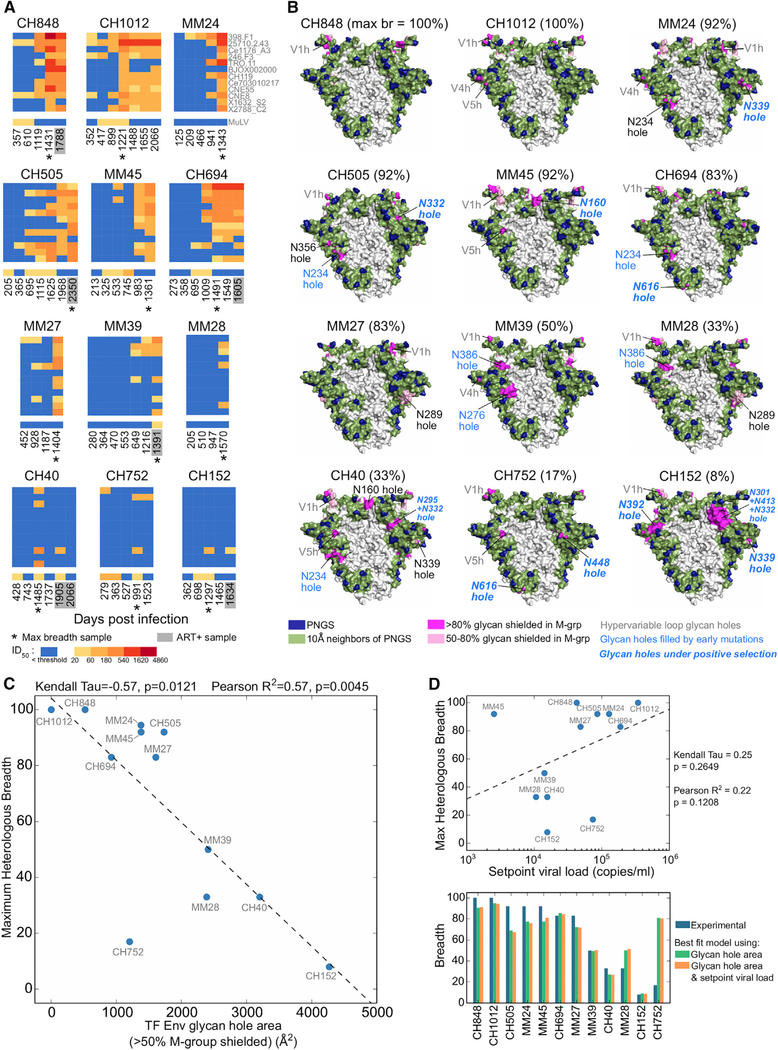
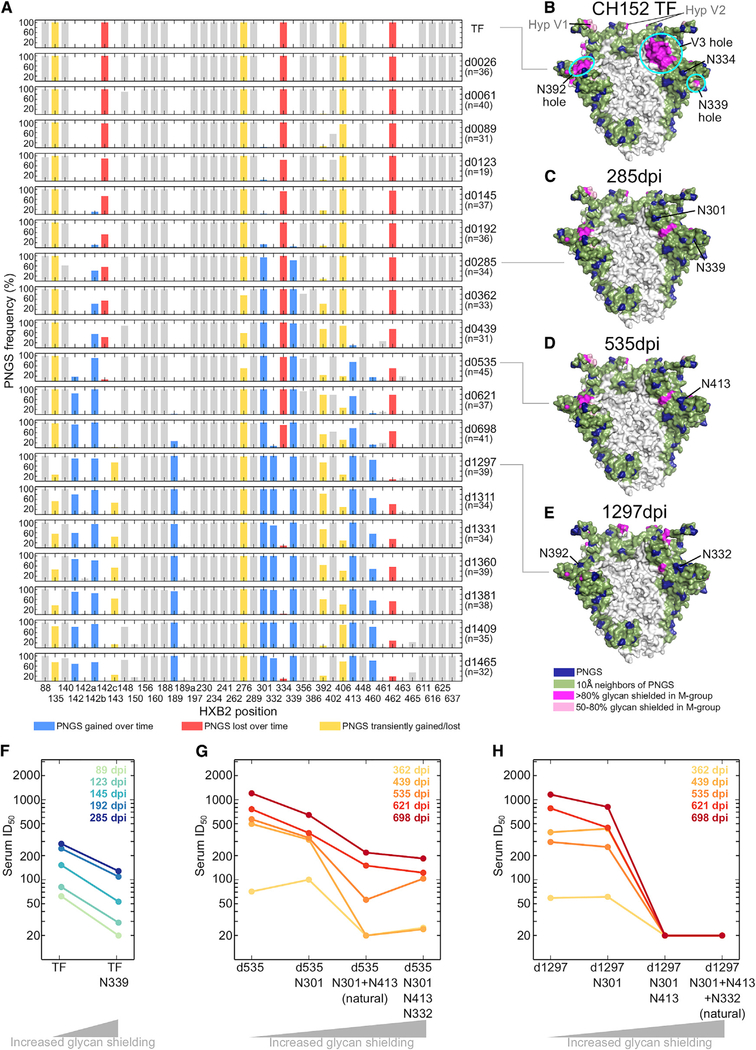
Densely arranged N-linked glycans shield the HIV-1 envelope (Env) trimer from antibody recognition. Strain-specific breaches in this shield (glycan holes) can be targets of vaccine-induced neutralizing antibodies that lack breadth. To understand the interplay between glycan holes and neutralization breadth in HIV-1 infection, we developed a sequence- and structure-based approach to identify glycan holes for individual Env sequences that are shielded in most M-group viruses. Applying this approach to 12 longitudinally followed individuals, we found that transmitted viruses with more intact glycan shields correlated with development of greater neutralization breadth. Within 2 years, glycan acquisition filled most glycan holes present at transmission, indicating escape from hole-targeting neutralizing antibodies. Glycan hole filling generally preceded the time to first detectable breadth, although time intervals varied across hosts. Thus, completely glycan-shielded viruses were associated with accelerated neutralization breadth development, suggesting that Env immunogens with intact glycan shields may be preferred components of AIDS vaccines.

Keywords: HIV-1 envelope; glycan shield; neutralizing antibodies; transmitted founder; vaccine design.


Conflict of interest statement

DECLARATION OF INTERESTS

The authors declare no competing interests.

Figures

Figure 1.
Figure 1.. Conservation of the Glycan Shield in M-Group Viruses and Glycan Shield Mapping Strategy
(A) The percentage of M-group Envs in which a given protein surface region is glycan shielded is depicted using a white-yellow-green color gradient. Env regions of interest are indicated. The white area labeled as the inter-protomer interface in the left panel is a cleft (Video S1) with low glycan coverage (Stewart-Jones et al., 2016). The right panel shows the distribution of glycan shield conservation in M-group Envs for surface-exposed atoms. (B)Glycan shield mapping strategy. The starting point is the Env trimer color coded according M-group glycan shield conservation with the <50%, 50%–80%, and >80% conserved regions by white, pink, and magenta, respectively (left). The PNGS positions (blue) for a given sequence are first mapped onto this structure (middle). Next, trimer surface regions within a 10-Å radius of each PNGS are mapped as green (right). This approach automatically highlights infrequent glycan holes.
Figure 2.
Figure 2.. Validation of Glycan Shield Mapping Strategy
(A) Predicted glycan shields for trimeric Env immunogens. PNGSs are indicated by dark blue and glycan shielded regions in green. Strain-specific breaches in the glycan shields are highlighted in magenta (regions shielded in >80% M-group Envs) or pink (shielded in 50%–80% M-group Envs). The table summarizes the results from epitope mapping of autologous NAb responses from Klasse et al. (2016) and Crooks et al. (2015), with the number of animals with reduced activity against glycan knockin mutants and the total number of animals with autologous neutralization activity reported. (B)Predicted glycan shielding (left) of the four PNGS-deleted BG505 variant BG505-Δgly4 from Zhou et al. (2017) is shown in black, and the alterations to the glycan shielded area due to the addition of each of the four deleted PNGSs are shown in green (PNGSs at N197 added), cyan (N363), red (N462), and orange (N276). The panel to the right shows the correlation between the glycan hole area and geometric mean Log10 ID50 neutralization titers against the indicated Envs using sera from BG505-Δgly4-immunized guinea pigs.
Figure 3.
Figure 3.. The Size of the TF Glycan Holes at Transmission Is Negatively Correlated with Maximum Heterologous Neutralization Breadth
(A) Heatmaps of plasma ID50 neutralization titers against the 12-virus global panel (deCamp et al., 2014) color coded by potency. Lack of neutralization is shown in blue. MuLV ID50 titers are controls. Asterisks indicate the earliest time point of maximum breadth. Gray boxes indicate anti-retroviral therapy (ART) positive plasma samples, tested using ART-resistant pseudoviruses. See Table S3 for ID50 values. (B) Predicted glycan shields for the TF Envs of the 12 individuals studied. The percentage of maximum breadth developed for each individual is shown in brackets. Colors are as in Figure 1B. Absent PNGSs leading to glycan holes are indicated; those filled during infection are highlighted in blue (see Figures 4, 5, and 6). TF glycan holes with significant positive selection signatures (Table S5; Figure S6) are in bold italics. Glycan holes in hypervariable loops, which cannot be predicted reliably, are labeled gray. (C) Correlation between maximum heterologous plasma breadth and the TF glycan hole area, using the >50% M-group conserved glycan shield threshold (hypervariable loop glycan holes excluded). For MM24 and MM45, data points were overlapping and are separated along the y-axis for clarity. (D) Top: correlation between maximum plasma breadth and setpoint viral load. Bottom: comparison of maximum plasma breadth (blue bars) with best-fit values using a model with TF glycan hole area alone (green) and a model that includes both the TF glycan hole area and setpoint viral load (orange).
Figure 4.
Figure 4.. Evolution of the Env Glycan Shield in an Individual Who Failed to Develop Heterologous Neutralization Breadth
(A) Losses and gains of PNGSs in CH152 longitudinal sequences. The frequencies of PNGSs within Env sequences from each time point are indicated; the time point (e.g., “d0026” is 26 dpi) and number of sequences are indicated on the right. All PNGSs that reached at least 10% frequency at any one time point are included. PNGS changes are color coded: blue indicates a gain, red a loss, and yellow transient changes. Gray indicates PNGSs that did not change substantially. (B–E) Glycan shields of CH152 Envs at transmission (TF) and subsequent time points. For the latter, PNGSs present in >50% of Env sequences from the time point were used to generate a consensus glycan shield for the respective time point. Colors as in Figure 1B. (F)ID50 neutralization titers of wild-type and mutant (N339 containing) CH152 TF Envs by 89- to 285-dpi plasmas. (G)ID50 titers of wild-type and mutant day 535 CH152 Envs by 1- to 2-year plasmas. (H) As in (G), but with a day 1,297 Env. See Table S4 for autologous ID50 titers.
Figure 5.
Figure 5.. Glycan Shield Evolution in Individuals Who Developed Modest Heterologous Neutralization Breadth
(A–D) Glycan shield evolution for individuals MM39 (A), MM28 (B), CH40 (C), and CH752 (D). Glycan shields are shown for Envs at transmission (TF) and for subsequent time points using consensus PNGSs at the time point; colors as in Figure 1B. Plots on the right depict the fraction of sequences with a particular PNGSs at each time point in each subject; all non-hypervariable loop PNGSs with frequency changes are shown. Dark and light blue curves show PNGS acquisitions, yellow and red curves PNGS losses, and gray curves unfilled glycan holes over time.
Figure 6.
Figure 6.. Glycan Shield Evolution in Individuals Who Developed Substantial Heterologous Neutralization Breadth
(A–G) Same as Figure 5 except for individuals MM45 (A), MM27 (B), MM24 (C), CH1012 (D), CH505 (E), CH848 (F), and CH694 (G).
Figure 7.
Figure 7.. Kinetics of the Env Glycan Hole Area and Development of Heterologous Breadth
(A) Data for low-breadth individuals. (B) Data for high-breadth individuals.For each subject, the consensus glycan hole area (red; using the >50% M-group conserved glycan shield) is shown in relation to neutralization breadth (blue bars; percentage of neutralization of 12-member global panel) over time (days postinfection).

References

    1. Andrabi R, Voss JE, Liang CH, Briney B, McCoy LE, Wu CY, Wong CH, Poignard P, and Burton DR (2015). Identification of common features in prototype broadly neutralizing antibodies to HIV envelope V2 apex to facilitate vaccine design. Immunity 43, 959–973. - PMC - PubMed
    1. Andrabi R, Su CY, Liang CH, Shivatare SS, Briney B, Voss JE, Nawazi SK, Wu CY, Wong CH, and Burton DR (2017). Glycans function as anchors for antibodies and help drive HIV broadly neutralizing antibody development. Immunity 47, 524–537. - PMC - PubMed
    1. Bar KJ, Tsao CY, Iyer SS, Decker JM, Yang Y, Bonsignori M, Chen X, Hwang KK, Montefiori DC, Liao HX, et al. (2012). Early low-titer neutralizing antibodies impede HIV-1 replication and select for virus escape. PLoS Pathog. 8, e1002721. - PMC - PubMed
    1. Barbian HJ, Decker JM, Bibollet-Ruche F, Galimidi RP, West AP Jr., Learn GH, Parrish NF, Iyer SS, Li Y, Pace CS, et al. (2015). Neutralization properties of simian immunodeficiency viruses infecting chimpanzees and gorillas. MBio 6, Published online April 21, 2015. 10.1128/mBio.00296-15. - DOI - PMC - PubMed
    1. Behrens AJ, and Crispin M (2017). Structural principles controlling HIV envelope glycosylation. Curr. Opin. Struct. Biol 44, 125–133. - PMC - PubMed

Publication types

MeSH terms

Substances

LinkOut - more resources