. 2018 Oct 23;25(4):974-987.e4.
doi: 10.1016/j.celrep.2018.09.085.

AKAP150 Palmitoylation Regulates Synaptic Incorporation of Ca2+-Permeable AMPA Receptors to Control LTP

Affiliations

AKAP150 Palmitoylation Regulates Synaptic Incorporation of Ca2+-Permeable AMPA Receptors to Control LTP

Alicia M Purkey et al. Cell Rep. .

Abstract

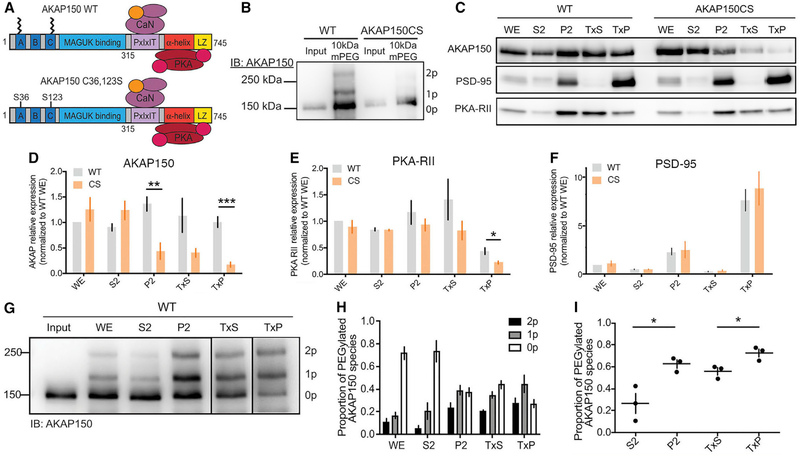
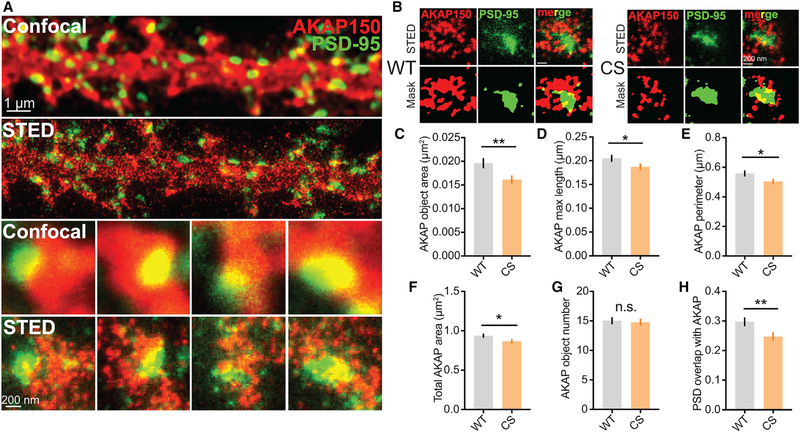
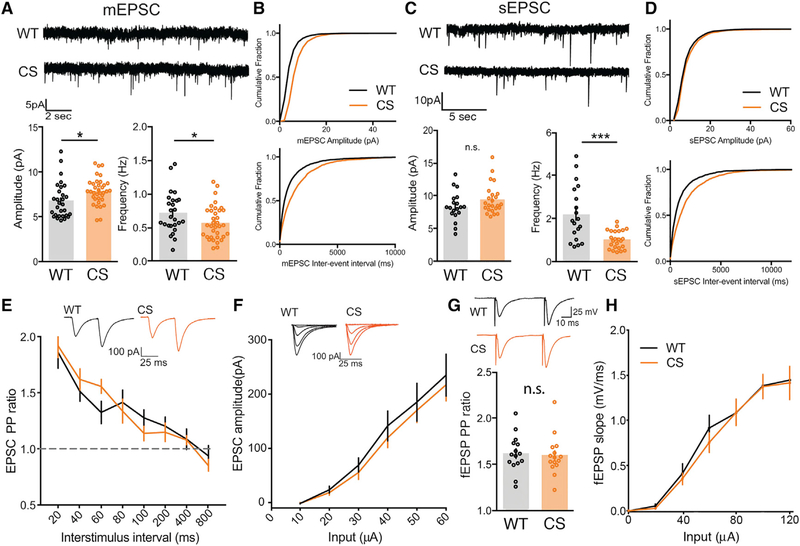
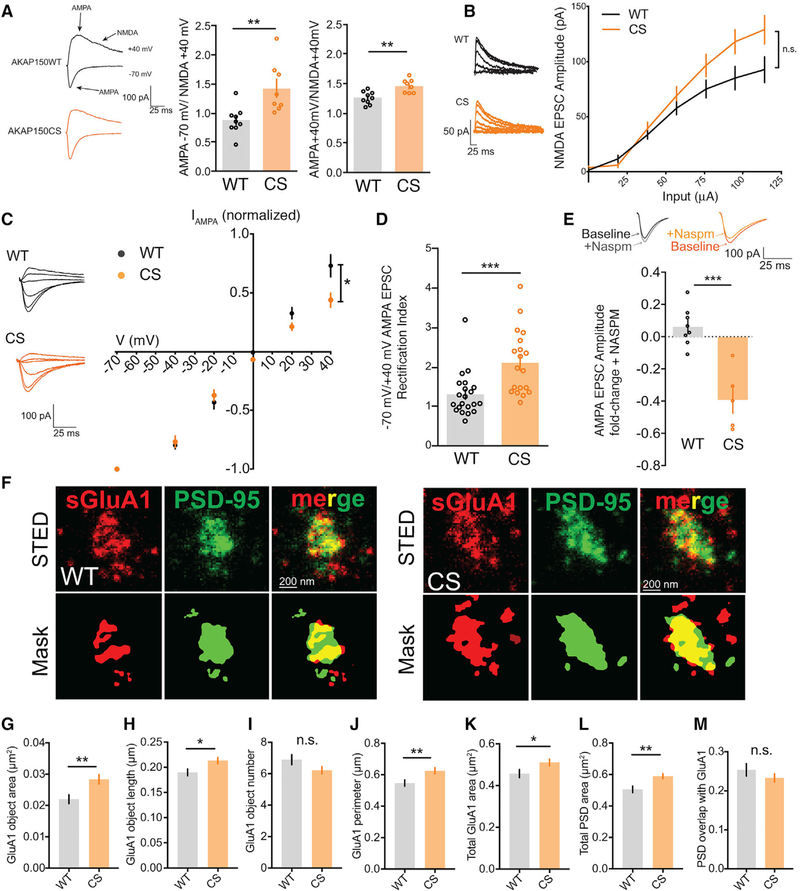
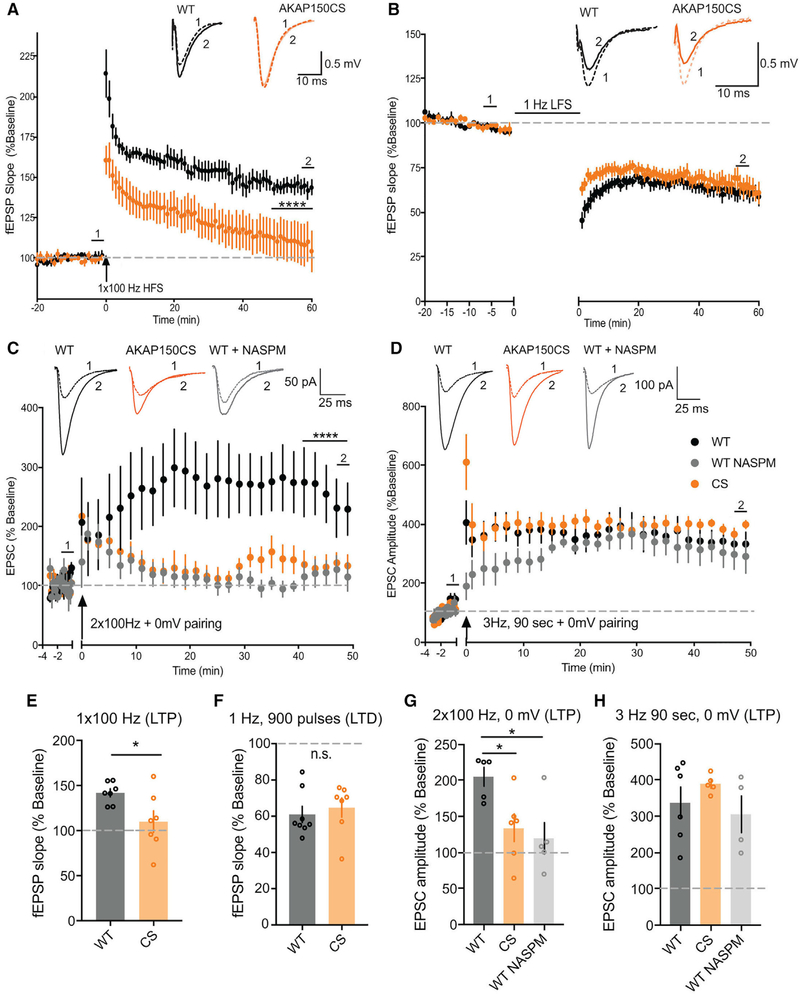
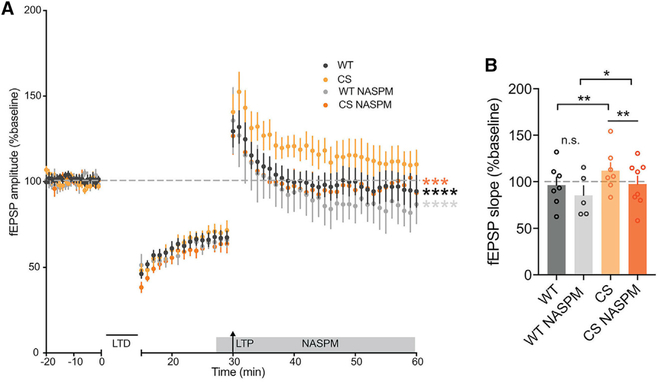
Ca2+-permeable AMPA-type glutamate receptors (CP-AMPARs) containing GluA1 but lacking GluA2 subunits contribute to multiple forms of synaptic plasticity, including long-term potentiation (LTP), but mechanisms regulating CP-AMPARs are poorly understood. A-kinase anchoring protein (AKAP) 150 scaffolds kinases and phosphatases to regulate GluA1 phosphorylation and trafficking, and trafficking of AKAP150 itself is modulated by palmitoylation on two Cys residues. Here, we developed a palmitoylation-deficient knockin mouse to show that AKAP150 palmitoylation regulates CP-AMPAR incorporation at hippocampal synapses. Using biochemical, super-resolution imaging, and electrophysiological approaches, we found that palmitoylation promotes AKAP150 localization to recycling endosomes and the postsynaptic density (PSD) to limit CP-AMPAR basal synaptic incorporation. In addition, we found that AKAP150 palmitoylation is required for LTP induced by weaker stimulation that recruits CP-AMPARs to synapses but not stronger stimulation that recruits GluA2-containing AMPARs. Thus, AKAP150 palmitoylation controls its subcellular localization to maintain proper basal and activity-dependent regulation of synaptic AMPAR subunit composition.

Keywords: AKAP; LTD; LTP; PKA; PSD; calcineurin; calcium-permeable AMPA receptor; palmityolation.


Conflict of interest statement

DECLARATION OF INTERESTS

The authors declare no competing interests.

Figures

Figure 1.
Figure 1.. AKAP150 and PKA-RII Levels Are Reduced in PSD-Enriched Fractions from AKAPCS Palmitoylation-Deficient Mice
(A) Schematic of AKAP150 highlighting binding partners and functional domains. AKAP150 is palmitoylated at Cys 36 and 123, and these residues are mutated to Ser to create the AKAPCS palmitoylation-deficient mutant mouse. (B) APEGS assay showing that AKAP150 WT, but not CS, is palmitoylated in lysates from mouse brain. (C) Subcellular fractionation and western blotting from WT and CS P21 mouse hippocampus for AKAP150, PSD-95, and PKA-RIIβ. P2, crude synaptosomes; S2, cytosol and light membranes; TxP, triton-insoluble sub-fraction of P2 = PSD-enriched fraction; TxS, triton-soluble sub-fraction of P2; WE, whole extract. (D–F) Quantification of subcellular fractionation from (C) normalized to WT WE levels showing (D) decreased AKAP150 protein levels in P2 and TxP fractions from CS mice (P2: WT 1.36 ± 0.14, CS 0.44 ± 0.16, unpaired t test **p = 0.0033; TxP: WT 1.00 ± 0.10, CS 0.17 ± 0.05, unpaired t test ***p = 0.00028; WT n = 5, CS n = 4), (E) decreased PKA-RIIβ protein levels in TxP fractions from CS mice (WT 0.44 ± 0.063, CS = 0.22 ± 0.029, unpaired t test *p = 0.036; n = 3), but (F) no change in fractionation of PSD-95 in CS versus WT mice. (G) AKAP150 APEGS assay of subcellular fractions from WT mouse forebrain. (H) Quantification of the proportion of AKAP150 in the unpalmitoylated lower MW band and the mono- and di-palmitoylated higher MW bands across the subcellular fractions in (G). (I) Quantification of the total proportion of palmitoylated AKAP150 (mono- plus di-) revealing significantly more palmitoylated AKAP150 in P2 versus S2 and TxP versus TxS (S2 0.26 ± 0.16, P2 0.63 ± 0.065, unpaired t test *p = 0.022; TxS 0.56 ± 0.059, TxP 0.73 ± 0.062, unpaired t test *p = 0.028; n = 3). *p < 0.05, **p < 0.01, and ***p < 0.001 by unpaired t test. Data are reported as mean ± SEM; n = number of animals.
Figure 2.
Figure 2.. AKAP150CS Localization to the PSD Is Reduced
(A and B) Confocal and STED imaging (A) and associated segmentation object masks (B) for 14–16 day in vitro (DIV) 14–16 hippocampal cultures from WT and CS mice stained for AKAP150 (red) and PSD-95 (green). STED images show enhanced resolution and provide better sub-synaptic visualization of AKAP150 localization relative to the PSD. (C–F) Significant decrease in AKAP object area in AKAPCS cultures (C) (WT 0.01961 ± 0.0009 μm2, n = 102 spines; CS 0.01614 ± 0.0007 μm2, n = 106 spines; unpaired t test **p = 0.0043) that was accompanied by decreases in (D) AKAP object major-axis length (WT 0.205 ± 0.006 μm, CS 0.1874 ± 0.006 μm, unpaired t test *p = 0.0344), (E) total AKAP perimeter (WT 0.5585 ± 0.017 μm, CS 0.5034 ± 0.014 μm, *p = 0.0104), and (F) AKAP compartment area within spines (WT 0.9372 ± 0.019 μm2, CS 0.8662 ± 0.019 μm2, unpaired t test *p = 0.0104). (G and H) No change is seen in AKAP object number per spine (G), but (H) AKAPCS PSD localization is reduced, as indicated by a decrease in AKAP and PSD-95 object overlap (WT 0.2971 ± 0.01, CS 0.2474 ± 0.01, **p = 0.0058). *p < 0.05 and **p < 0.01 by unpaired t test. Data are reported as mean ± SEM.
Figure 3.
Figure 3.. AKAPCS Mice Exhibit Slightly Increased AMPAR mEPSC Amplitude and Decreased Frequency but Normal Evoked Basal Transmission at Hippocampal CA1 Synapses
(A and B) Representative traces for mEPSC recordings with plots of mean amplitude and frequency (A) and cumulative distribution plots of mEPSC amplitude and inter-event interval (B) for CA1 neurons in acute hippocampal slices from WT and AKAPCS mice showing a slight increase in mEPSC amplitude and a slight decrease in mEPSC frequency (A: mEPSC amplitude: WT = 6.79 ± 0.371 pA n = 29 cells, CS = 7.883 ± 0.251 pA n = 35 cells, unpaired t test *p = 0.0145; mEPSC frequency: WT = 0.72 ± 0.059 Hz, CS = 0.57 ± 0.042, unpaired t test *p = 0.0475). (C and D) Representative traces for sEPSC recording with plots of mean amplitude and frequency (C) and cumulative distribution plots of sEPSC amplitude and inter-event interval (D) for WT and CS mice showing a slight but not significant increase in sEPSC amplitude and a significant decrease in sEPSC frequency for CS mice (C: sEPSC frequency: WT 2.21 ± 0.297 Hz, n = 19 cells; CS 1.02 ± 0.0862 Hz, n = 24 cells; unpaired t test ***p = 0.0001). (E–H) No changes in SC-CA1 evoked basal AMPAR transmission are observed for CS mice in (E and G) paired-pulse ratios or (F and H) input-output curves in either whole-cell EPSC or extracellular fEPSP recordings. *p < 0.05 and ***p < 0.001 by unpaired t test. Data are reported as mean ± SEM.
Figure 4.
Figure 4.. AKAPCS Mice Have Elevated Basal CP-AMPAR Activity at CA1 Synapses
(A) Evoked SC-CA1 AMPA/NMDA EPSC ratios from WT and CS slices; AKAPCS mice show a substantial increase in −70 mV peak AMPA to +40 mV 50 ms after peak NMDA tail EPSC ratio and a smaller increase in the mixed AMPA and NMDA +40 mV peak to +40 mV 50 ms after peak NMDA tail EPSC ratio (−70 mV/+40 mV: WT 0.88 ± 0.080, n = 9 cells, CS 1.43 ± 0.15, n = 8 cells, unpaired t test **p = 0.0052; +40 mV: WT 1.26 ± 0.036, CS 1.46 ± 0.040, unpaired t test **p = 0.0017). (B) No change in evoked NMDA +40 mV EPSC input-output (I-O) relationship in AKAPCS. (C and D) Normalized AMPA EPSC I-V curve showing (C) decreased outward current at positive potentials (AMPA I-V at +40 mV: WT 0.73 ± 0.093, n = 10 cells; CS 0.45 ± 0.059, n = 9 cells; unpaired t test *p = 0.0251; normalized to −70 mV EPSC amplitude) and (D) increased −70 mV/+40 mV EPSC amplitude rectification index (RI: WT 1.30 ± 0.121, n = 21; CS 2.12 ± 0.187, n = 19; unpaired t test ***p = 0.0006) in AKAPCS slices. (E) Inhibition of 70 mV AMPA EPSC amplitude in AKAPCS but not WT slices by 20 μM CP-AMPAR blocker NASPM (WT 0.065 ± 0.042, n = 8 cells, CS −0.39 ± 0.084, n = 5 cells; unpaired t test ***p = 0.0002; fold change baseline after NASPM application). (F–I) STED imaging of cultured hippocampal neurons stained for surface GluA1 (sGluA1) and PSD-95 (F) showing for AKAPCS neurons (G) increased sGluA1 object area (WT 0.02202 ± 0.00014 μm2, n = 125 spines; CS 0.02835 ± 0.00015 μm2, n = 170 spines; unpaired t test **p = 0.0032) with (H) an increase in GluA1 object major-axis length (WT 0.19 ± 0.0067 μm, CS 0.2132 ± 0.0064 μm, *p = 0.0132) but with (I) no change in object number. (J and K) AKAPCS spines also have increased total perimeter (J) (WT 0.5472 ± 0.02 μm, CS 0.6252 ± 0.02 μm, **p = 0.0070) and (K) area occupied by sGluA1 staining in spines (WT 0.4571 ± 0.019 μm2, CS 0.5111 ± 0.016 μm2, *p = 0.0359). (L and M) The total area occupied by PSD-95 in spines is also increased in AKAPCS compared with WT (L) (WT 0.5056 ± 0.021 μm2, CS 0.5899 ± 0.016 μm2, **p = 0.0013) but with (M) no change in PSD-95 overlap with sGluA1. *p < 0.05, **p < 0.01, and ***p < 0.001 by unpaired t test. Data are reported as mean ± SEM.
Figure 5.
Figure 5.. CP-AMPAR-Dependent LTP at CA1 Synapses Is Impaired in AKAPCS Mice
(A and E) SC-CA1 fEPSP slope (normalized to baseline) recorded over time for WT and AKAPCS slices (A) and aggregate data for measurements of normalized fEPSP slope (E) (averaged over the last 10 min) showing robust 1×100 Hz 1 sec HFS induction of LTP in WT (~150%) that is significantly impaired in CS (A: ****p < 0.0001 by 2-way ANOVA over last 10 min; E: fEPSP slope for WT = 141.9 ± 4.55% n = 7 slices, CS = 110 ± 12.04% n = 7 slices, unpaired t test last 10 min *p = 0.028). (B and F) SC-CA1 fEPSP slope (normalized to baseline) recorded over time for WT and AKAPCS slices (B) and aggregate data for measurements of normalizedfEPSP slope (F) (averaged over the last 10 min of recording) showing 1 Hz, 900 pulses (15 min) robust induction of LTD (~60%) in both WT and CS. (C and G) Normalized EPSC amplitude (normalized to baseline) recorded over time (C) and aggregate data for measurements of normalized EPSC amplitude (G) (averaged over the last 10 min) showing CP-AMPAR dependent, NASPM-sensitive LTP induced by 2 × 100 Hz, 1 s HFS, 0 mV pairing in WT slices is impaired in AKAP CS slices (C: 2-way ANOVA with Tukey’s multiple comparisons test for last 10 min: WT NASPM versus WT ****p < 0.0001, WT versus CS ****p < 0.0001; G: WT = 204.9 ± 3.24% n = 5 cells, CS = 133.8 ± 9.41% n = 6 cells, WT NASPM = 119.6 ± 22.45% n = 5 cells; unpaired t test WT versus WT NASPM *p = 0.0113, WT versus CS *p = 0.0362). (D and H) Normalized EPSC amplitude (normalized to baseline) recorded over time (D) and aggregate data for measurements of normalized EPSC amplitude (H) (averaged over the last 10 min) showing CP-AMPAR independent, NASPM insensitive LTP induced by 3 Hz, 90 s, 0 mV pairing in WT slices is normal in CS slices (H: WT = 337.4 ± 44.25% n = 6 cells, WT NASPM = 305.6 ± 51.8% n = 4 cells, CS = 389.1 ± 11.25% n = 5 cells). Data reported as mean ± SEM.
Figure 6.
Figure 6.. AKAPCS Mice Can Undergo CP-AMPAR-Dependent De-depression at CA1 Synapses
(A and B) fEPSP slope (normalized to baseline) recorded over time (A) and aggregate data for measurements of normalized fEPSP slope (B) (averaged over last 10 min) showing that de-depression (induced by 1 Hz, 900 pulses LFS-LTD followed by 1 × 100 Hz, 1 s HFS-LTP 15 min later) is enhanced in CS mice (A: over last 10 min CS versus WT ****p < 0.0001 by 2-way ANOVA with Tukey’s multiple comparisons; B: WT 96.27 ± 8.537%, n = 7 slices, CS 111.8 ± 8.638%, n = 7 slices; unpaired t test CS versus WT ***p = 0.0010). CS but not WT de-depression is sensitive to CP-AMPAR blockade with NASPM (A: over last 10 min CS NASPM versus CS ***p < 0.001, WT NASPM versus CS ****p < 0.0001 by 2-way ANOVA with Tukey’s multiple comparisons; B: WT NASPM 85.42 ± 10.23%, n = 5 slices, CS NASPM 97.46 ± 8.487%, n = 8 slices; unpaired t tests WT NASPM versus WT p > 0.05 [n.s.], CS NASPMversus CS **p = 0.0016, WT NASPM versus CS NASPM *p = 0.0377). Data are reported as mean ± SEM.

Similar articles

Cited by

References

    1. Adesnik H, and Nicoll RA (2007). Conservation of glutamate receptor 2-containing AMPA receptors during long-term potentiation. J. Neurosci 27, 4598–4602. - PMC - PubMed
    1. Ahmad M, Polepalli JS, Goswami D, Yang X, Kaeser-Woo YJ, Su€dhof TC, and Malenka RC (2012). Postsynaptic complexin controls AMPA receptor exocytosis during LTP. Neuron 73, 260–267. - PMC - PubMed
    1. Aoto J, Nam CI, Poon MM, Ting P, and Chen L (2008). Synaptic signaling by all-trans retinoic acid in homeostatic synaptic plasticity. Neuron 60, 308–320. - PMC - PubMed
    1. Ashby MC, De La Rue SA, Ralph GS, Uney J, Collingridge GL, and Henley JM (2004). Removal of AMPA receptors (AMPARs) from synapses is preceded by transient endocytosis of extrasynaptic AMPARs. J. Neurosci 24, 5172–5176. - PMC - PubMed
    1. Beattie EC, Carroll RC, Yu X, Morishita W, Yasuda H, von Zastrow M, and Malenka RC (2000). Regulation of AMPA receptor endocytosis by a signaling mechanism shared with LTD. Nat. Neurosci 3, 1291–1300. - PubMed

Publication types