. 2018 Nov 13;2(21):2798-2810.
doi: 10.1182/bloodadvances.2018019950.

Driver mutations in Janus kinases in a mouse model of B-cell leukemia induced by deletion of PU.1 and Spi-B

Affiliations

Driver mutations in Janus kinases in a mouse model of B-cell leukemia induced by deletion of PU.1 and Spi-B

Carolina R Batista et al. Blood Adv. .

Abstract

Precursor B-cell acute lymphoblastic leukemia (B-ALL) is associated with recurrent mutations that occur in cancer-initiating cells. There is a need to understand how driver mutations influence clonal evolution of leukemia. The E26-transformation-specific (ETS) transcription factors PU.1 and Spi-B (encoded by Spi1 and Spib) execute a critical role in B-cell development and serve as complementary tumor suppressors. Here, we used a mouse model to conditionally delete Spi1 and Spib genes in developing B cells. These mice developed B-ALL with a median time to euthanasia of 18 weeks. We performed RNA and whole-exome sequencing (WES) on leukemias isolated from Mb1-CreΔPB mice and identified single nucleotide variants (SNVs) in Jak1, Jak3, and Ikzf3 genes, resulting in amino acid sequence changes. Jak3 mutations resulted in amino acid substitutions located in the pseudo-kinase (R653H, V670A) and in the kinase (T844M) domains. Introduction of Jak3 T844M into Spi1/Spib-deficient precursor B cells was sufficient to promote proliferation in response to low IL-7 concentrations in culture, and to promote proliferation and leukemia-like disease in transplanted mice. We conclude that mutations in Janus kinases represent secondary drivers of leukemogenesis that cooperate with Spi1/Spib deletion. This mouse model represents a useful tool to study clonal evolution in B-ALL.


Conflict of interest statement

Conflict-of-interest disclosure: The authors declare no competing financial interests.

Figures

None
Graphical abstract
Figure 1.
Figure 1.
Mb1-CreΔPB mice develop B-ALL. (A) Mb1-CreΔPB mice (ΔPB) mice developed B-ALL characterized by splenic and thymic enlargement (indicated by arrows). (B) Percentage survival of mice of the indicated genotypes: Mb1+/CreSpi1lox/lox Spib−/− (Mb1-CreΔPB; n = 43); Mb1+/CreSpi1+/+ Spib−/− mice (Mb1-CreΔB; n = 36) and Mb1+/+Spi1lox/loxSpib−/− (Mb1-CreΔB; n = 14). (C) Comparisons of enlarged spleens and thymuses extracted from Mb1-CreΔPB mice compared with control ΔB mice (Mb1+/+ Spi1lox/lox Spib−/−). (D) Spleen (left) and thymus (right) weight in grams relative to the body weight in WT and Mb1-CreΔPB mice. WT, n = 10 (spleen), 5 (thymus); Mb1-CreΔPB, n = 11 (spleen), 8 (thymus). Significance was determined using unpaired Student t test. *P ≤ .05. (E). Histologic sections (hematoxylin and eosin staining) of spleen and thymus illustrating the lymphocytic infiltration and loss of organs normal structure in Mb1-CreΔPB compared with controls Mb1ΔB (magnification ×4; scale bar represents 200 μm).
Figure 2.
Figure 2.
Most leukemias from Mb1-CreΔPB mice resemble pro-B cells and do not express either IgM or Igκ at the cell surface. (A) Representative flow cytometric analysis for the presence of CD19+ B220+ B cells in the spleen of C57BL/6 mice; 11-week-old Mb1-CreΔB mice and Mb1-CreΔPB mice (left panels); and >15-week-old Mb1-CreΔPB mice (right panel). (B) Representative flow cytometric analysis for the presence of CD19+ B220+ B cells in the thymus of C57BL/6 mice; 11-week-old Mb1-CreΔB mice, and Mb1-CreΔPB mice (left panels); and >15-week-old Mb1-CreΔPB mice (right panel). (C) Polymerase chain reaction for detection of heavy chain rearrangements (J558-JH4) in leukemia B cells prepared from the thymus of Mb1-CreΔPB mice. B cells prepared from WT mouse (C57BL/6) were used as control. The Cd79 gene was used as control for DNA quality. (D) Representative flow cytometric analysis of leukemic cells from Mb1-CreΔPB mice gated on CD19+ B220+ cells showed that leukemias expressed IL-7R on the cell surface (top and bottom). (E) Representative IL-7R+ leukemias expressing IgM and Igκ, (top, Ig+) and those not expressing IgM and Igκ (bottom, Ig). (F) Percentage of leukemias expressing IgM and Igκ (Ig+) or not expressing IgM and Igκ (Ig). (Left) Mb1-CreΔPB mice, n = 14 (spleen) and n = 8 (thymus). (Right) CD19-CreΔPB mice, n = 9 (thymus).
Figure 3.
Figure 3.
Identification of high-confidence SNVs in Mb1-CreΔPB mouse leukemias. (A-C) SNVs identified by 2 different variant caller methods, Strelka and Mutect, were combined, and overlapping SNVs were classified as high-confidence SNVs. (D) Classification of high-confidence SNVs for effect. Graph shows the number of SNVs classified according to effect. (E) Predicted biological effect of the high-confidence SNVs classified as having moderate and high effect. (F). Venn diagram showing the overlap among high-confidence SNVs identified in the 3 individual mouse leukemias.
Figure 4.
Figure 4.
Integration of WES and RNA-seq. (A-C) Scatter plot correlating the levels of gene expression in FPKM log10 and the VAF for genes in which FPKM was greater than zero. Leukemias 853, 854, and 857 are shown, respectively. (D-F). Biological pathway analysis in genes with VAF equal or greater than 20% was performed using Panther–Gene List Analysis. Diagram shows the number of genes enriched according the biological process. Enrichment for genes related to Cellular Process and Metabolic Process is shown for the 3 samples analyzed.
Figure 5.
Figure 5.
Identified mutations in conserved regions of Jak3, Jak1, and Ikzf3 genes. (A-C, left) Schematic shows the protein domains of Jak3, Jak1, and Aiolos (Ikzf3). Amino acids substitutions caused by single nucleotide variants identified in the WES in samples 853, 854, and 857 are also indicated. FERM indicates a Four-point-one, Ezrin, Radixin, Moesin homology domain. Blue bars represent zinc fingers of Aiolos protein. (A-C; right) Protein sequence alignments comparing Jak1, Jak3, and Aiolos in mouse (Mus musculus), human (Homo sapiens), rat (Rattus norvegicus), African elephant (Loxodonta africana), giant panda (Ailuropoda melanoleuca), Atlantic salmon (Salmo salar), zebrafish (Danio rerio), and tropical frog (Xenopus tropicalis) shows that amino acids that undergo substitution in consequence of a single nucleotide variation are highly conserved between the 2 species. Identical amino acids are marked with an asterisk. (D) Summary of Sanger sequencing screening for the presence of amino acids substitutions in Jak1 (V657F and V655L), Jak3 (T844M and R653H), and Aiolos (R137* and H195T) in a panel of 19 leukemias prepared from Mb1-CreΔPB mice. Filled boxes indicate samples in which mutations were identified by Sanger sequencing.
Figure 6.
Figure 6.
Jak3 mutations confer proliferation advantage to cultured pro-B cells. (A) Percentage of GFP+ cells over the course of 14 days after infection of WT fetal liver-derived pro-B cells with MSCV empty, MSCV JAK3, MSCV T844M, MSCV R653H, MSCV V670A, or MSCV V670A/T844M cultured at low IL-7 concentration (0.5% conditioned medium). Statistics were performed using repeated measures analysis of variance (ANOVA), *P ≤ .05; **P ≤ .01. (B) Absolute number of viable GFP+ cells after 4 days of culture at low IL-7 concentration. WT pro-B cells were infected as described earlier, counted, and analyzed for GFP frequency between day 8 and day 12 of culture. Data are presented as number of GFP+ cells/mL; n = 3. Statistics were performed using ANOVA with Tukey's posttest: ***P ≤ .001; ****P ≤ .0001. (C) Percentage of GFP+ cells over the course of 14 days after infection of the Spi1/Spib-deficient 660BM cell line with MSCV empty or MSCV T844M at low IL-7 concentration. Statistics were performed using repeated measures ANOVA: **P ≤ .01. (D) Absolute number of viable GFP+ cells over 6 days of culture shown in panel C. Spi1/Spib-deficient 660BM pro-B cells were infected with either MSCV empty or MSCV T844M vectors.
Figure 7.
Figure 7.
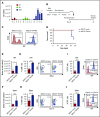
Jak3 mutations cooperate with Spi1/Spib-deficiency to confer proliferation advantage to B cells in vivo. (A) Mb1-CreΔPB bone marrow cells grow indefinitely in the presence of IL-7. Bone marrow cells were extracted from 6- to 10-week-old WT, ΔB, and ΔPB mice and cultured in IL-7 conditioned media. The number of viable cells/mL (y-axis) was determined every 4 days for 5 passages. Statistics were performed using 2-way ANOVA with Tukey's posttest: **P ≤ .01; ***P ≤ .001; ****P ≤ .0001. (B) Transplantation experiment timeline. (C) Initial infection frequencies for MSCV-empty or MSCV T844M vectors. Histograms show the frequency of GFP+ cells 48 hours after spin-infection. (D) Survival curve showing days elapsed after transplantation and the percentage of survival of NSG mice transplanted with MSCV empty or MSCV T844M-infected BM cells. Mice transplanted with MSCV empty BM cells did not show signs of illness at any point. The experiment was terminated at day 47. Significance was P ≤ .03, using the Gehan-Breslow-Wilcoxon test. (E) Number of cells isolated from bone marrow of NSG mice transplanted with bone marrow cells infected with the indicated vectors. (F) Number of cells isolated from spleen of NSG mice transplanted with bone marrow cells infected with the indicated vectors. (G-H) Increased frequencies of CD19+ cells in BM and spleen of NSG mice transplanted with MSCV T844M-infected BM cells. Bar graphs show the percentage of CD19+ cells in the bone marrow and spleen of NSG mice transplanted with MSCV empty or MSCV T844M BM cells. Representative pseudo-color plots (right) show the gating strategy and the representative proportions of CD19+ cells in the different group of mice. (I-J) High GFP+ cell frequency in BM and spleen of NSG mice transplanted with MSCV T844M-infected bone marrow cells. Bar graphs indicate the percentage of GFP+ cells (gated on CD19+ cells) within the bone marrow or spleen of NSG mice transplanted with MSCV empty or MSCV T844M. Representative histograms show the percentage of GFP+ cells in the spleen and bone marrow of NSG mice transplanted with MSCV T884M (upper) or MSCV empty (lower). For E-J, significance was determined using unpaired Student t test: *P ≤ .05; ***P ≤ .001. NS, not significant.

Similar articles

Cited by

References

    1. Siegel R, Ma J, Zou Z, Jemal A. Cancer statistics, 2014. CA Cancer J Clin. 2014;64(1):9-29. - PubMed
    1. Hunger SP, Mullighan CG. Redefining ALL classification: toward detecting high-risk ALL and implementing precision medicine. Blood. 2015;125(26):3977-3987. - PMC - PubMed
    1. Inaba H, Greaves M, Mullighan CG. Acute lymphoblastic leukaemia. Lancet. 2013;381(9881):1943-1955. - PMC - PubMed
    1. Pui CH, Robison LL, Look AT. Acute lymphoblastic leukaemia. Lancet. 2008;371(9617):1030-1043. - PubMed
    1. Buchner M, Swaminathan S, Chen Z, Müschen M. Mechanisms of pre-B-cell receptor checkpoint control and its oncogenic subversion in acute lymphoblastic leukemia. Immunol Rev. 2015;263(1):192-209. - PubMed

Publication types

MeSH terms