. 2018 Dec;28(12):1826-1840.
doi: 10.1101/gr.235861.118. Epub 2018 Oct 24.

Ranking noncanonical 5' splice site usage by genome-wide RNA-seq analysis and splicing reporter assays

Affiliations

Ranking noncanonical 5' splice site usage by genome-wide RNA-seq analysis and splicing reporter assays

Steffen Erkelenz et al. Genome Res. 2018 Dec.

Abstract

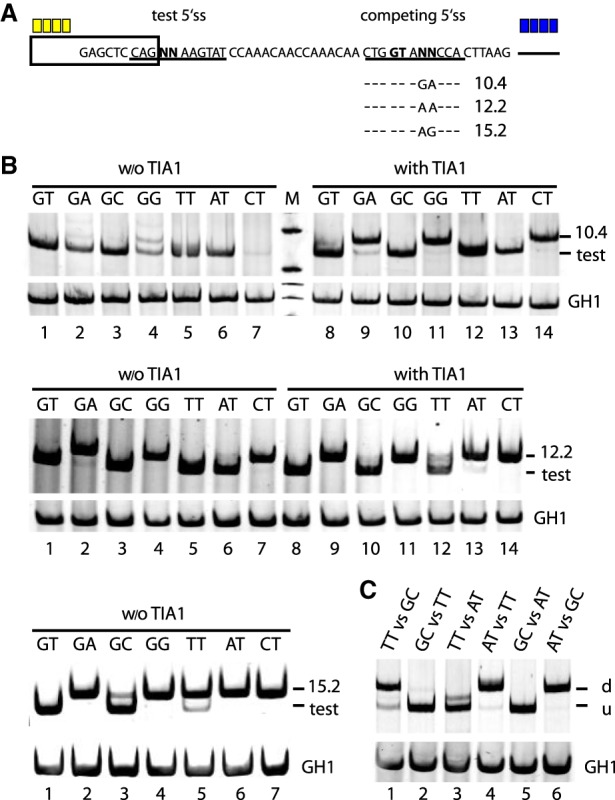
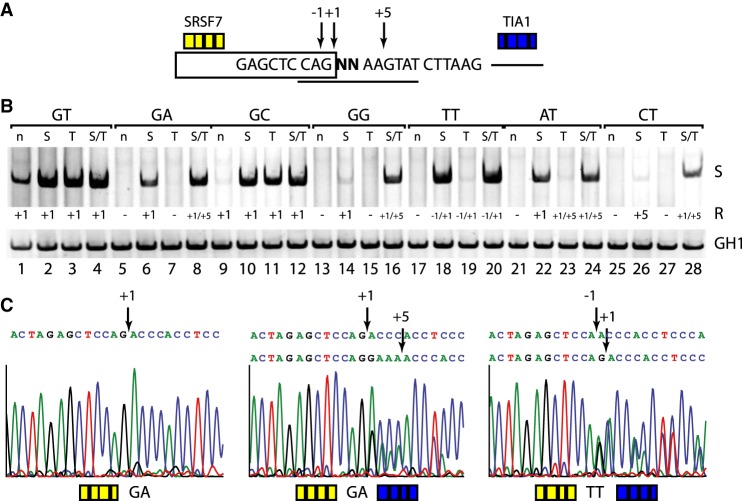
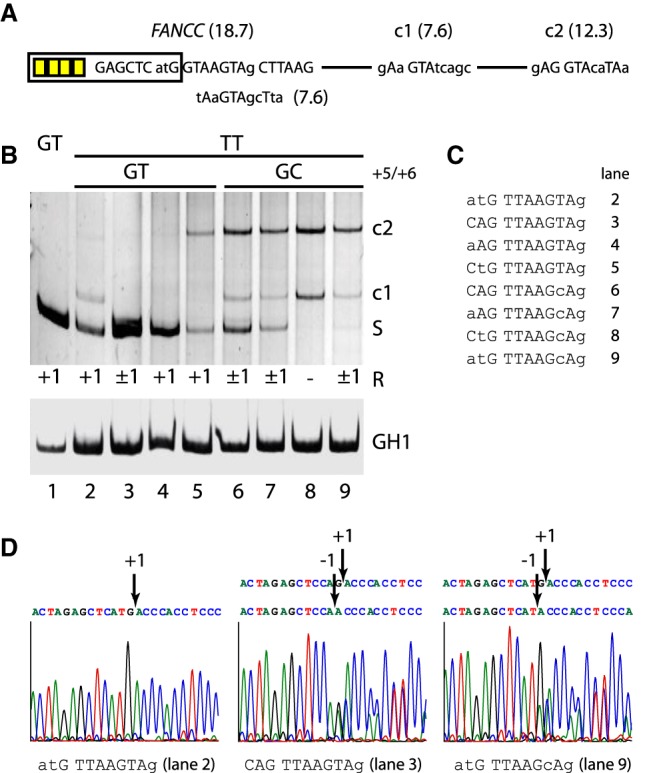
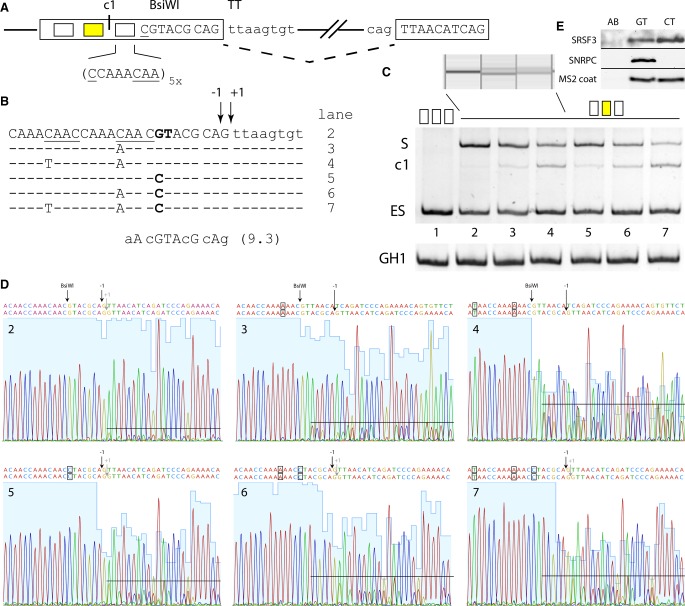
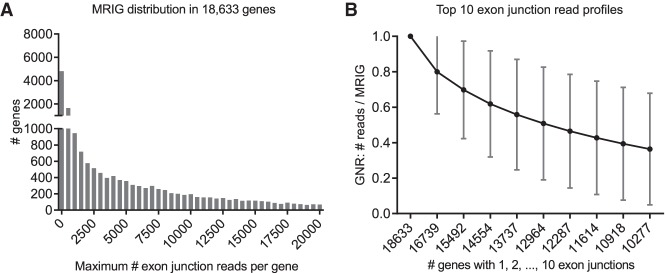
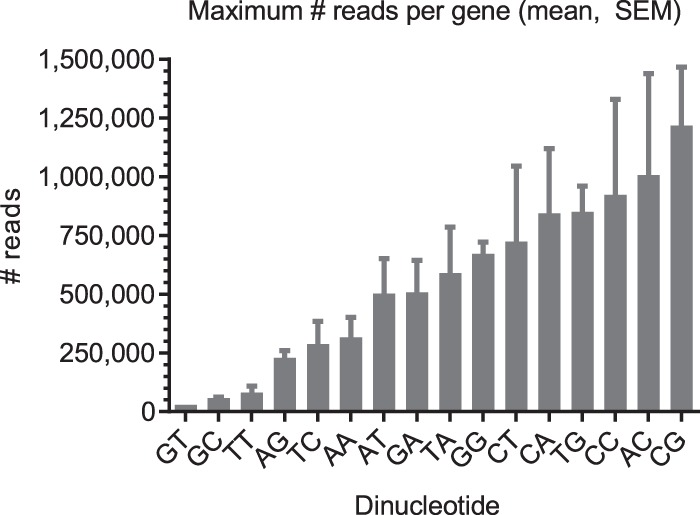
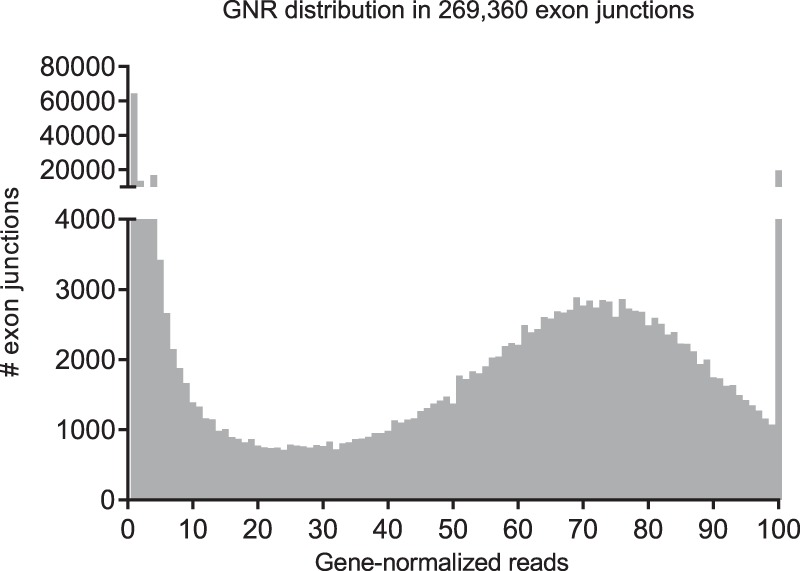
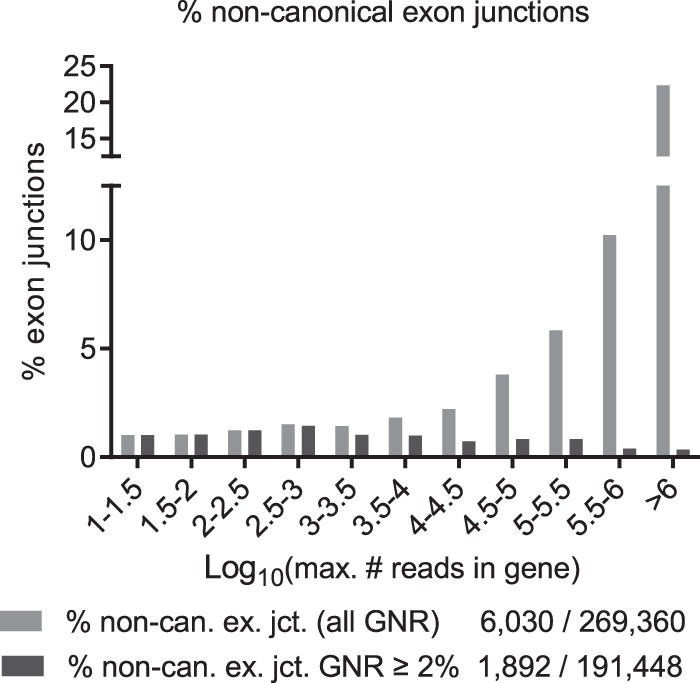
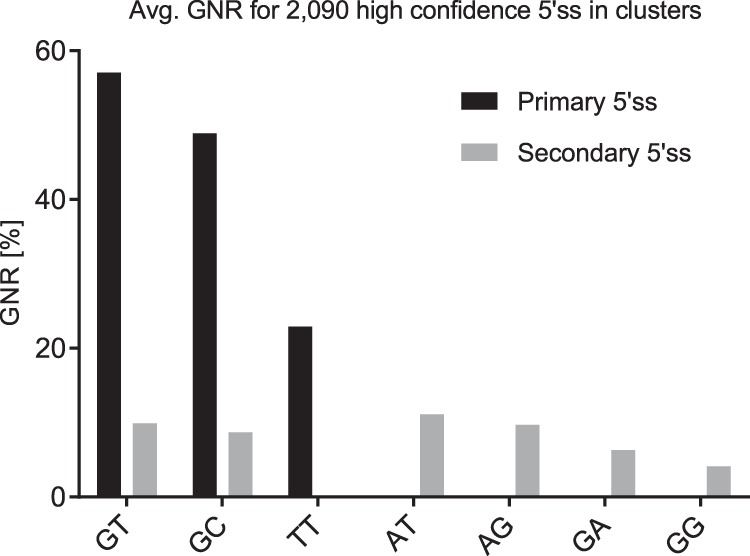
Most human pathogenic mutations in 5' splice sites affect the canonical GT in positions +1 and +2, leading to noncanonical dinucleotides. On the other hand, noncanonical dinucleotides are observed under physiological conditions in ∼1% of all human 5'ss. It is therefore a challenging task to understand the pathogenic mutation mechanisms underlying the conditions under which noncanonical 5'ss are used. In this work, we systematically examined noncanonical 5' splice site selection, both experimentally using splicing competition reporters and by analyzing a large RNA-seq data set of 54 fibroblast samples from 27 subjects containing a total of 2.4 billion gapped reads covering 269,375 exon junctions. From both approaches, we consistently derived a noncanonical 5'ss usage ranking GC > TT > AT > GA > GG > CT. In our competition splicing reporter assay, noncanonical splicing was strictly dependent on the presence of upstream or downstream splicing regulatory elements (SREs), and changes in SREs could be compensated by variation of U1 snRNA complementarity in the competing 5'ss. In particular, we could confirm splicing at different positions (i.e., -1, +1, +5) of a splice site for all noncanonical dinucleotides "weaker" than GC. In our comprehensive RNA-seq data set analysis, noncanonical 5'ss were preferentially detected in weakly used exon junctions of highly expressed genes. Among high-confidence splice sites, they were 10-fold overrepresented in clusters with a neighboring, more frequently used 5'ss. Conversely, these more frequently used neighbors contained only the dinucleotides GT, GC, and TT, in accordance with the above ranking.


Figures

Figure 1.
Figure 1.
Competition assay for determining noncanonical 5′ss efficiency. (A) Schematic of the HIV-1-based splicing reporter containing the different competitive splice site pairs. Sequence variations (denoted by “NN”) and HBond scores (https://www2.hhu.de/rna/html/hbond_score.php) of the competing canonical splice sites are indicated below. Enhancer repeats are highlighted in yellow (SRSF7) or blue (TIA1). (B,C) RT-PCR analyses of spliced reporter mRNAs. All splicing reporters in B contained SRSF7 splicing enhancer repeats, and the presence or absence of TIA1 repeats is indicated above each panel. Splicing reporters in C contained both SRSF7 and TIA1. (C) The comparison of two noncanonical 5′ss, inserted at the positions of “test” and “competing” 5′ss in A. (u) Upstream site; (d) downstream site. To monitor transfection efficiency, 2.5 × 10⁵ HEK293T cells were transiently transfected with 1 µg of each: the respective HIV-1-based splicing reporter and pXGH5 (expressing human growth hormone 1 [GH1]). RNA was extracted 30 h post transfection and subjected to RT-PCR analysis as described in Methods. All experiments were performed in triplicates (Supplemental Fig. S6).
Figure 2.
Figure 2.
Noncanonical 5′ss exhibit a greater enhancer dependency than canonical 5′ss. (A) Schematic of the HIV-1 minigene containing a single noncanonical splice site. Experimentally found splicing registers (−1, +1, +5) are indicated by arrows. Yellow and blue boxes represent upstream (SRSF7) or downstream (TIA1) enhancer repeats. (B) Activation of splice sites in presence or absence of splicing enhancers. RT-PCR analysis was carried out as described before. Used splicing registers (R) are given below the gel image. All experiments were performed in triplicate (Supplemental Fig. S6). (C) Splicing positions mapped by sequencing of the extracted RT-PCR products (for a complete overview, see Supplemental Fig. S1).
Figure 3.
Figure 3.
Accuracy of noncanonical TT splicing. (A) Schematic of the splicing reporter containing the human FANCC exon 2 splice site and two weak cryptic splice sites (c1/c2) in the downstream intron. Exonic SRSF7 enhancer sites are indicated by yellow boxes. (B) Different splicing positions (R) obtained by variations of the TT splice site sequence. RT-PCR analysis was performed as described before. All experiments were performed in triplicate (Supplemental Fig. S6). (C) TT splice site sequences from B, lanes 29. The human pathogenic FANCC exon 2 c.165 + 1G > T splice site is shown in lane 2. (D) Exemplary splicing positions mapped by sequencing of the extracted RT-PCR products.
Figure 4.
Figure 4.
Upstream SREs and a second GT at positions −8 and −7 affect the accuracy of TT splice site usage. (A) Overview of the used designer exon splicing reporter containing either five repeats of the splicing neutral sequence CCAAACAA (white boxes) or two SRSF7 binding sites (yellow box). The underlined bases represent CANC motifs, which arise from concatenating CCAAACAA and can serve as SRSF3 binding sites. (B) Sequences of the exon–intron border in the different designer exon variants. Lane numbers correspond to C and D. Potential SRSF3 binding sites are underlined. Sequence and HBond score of the U1 binding site at position −8 (bold GT) are shown below. Splicing registers at the noncanonical TT are indicated by −1 and +1. (C) HeLa cells were transfected with 1 µg of each of the depicted constructs and 1 µg of GH1, which was used as transfection control. Twenty-four hours post transfection, total RNA was isolated, reverse transcribed, and amplified with specific primer pairs: (DE) #2648/#2649; (S) splice site usage; (c1) c1 usage; (ES) exon skipping; (GH1) #1224/#1225. PCR products were separated either on a 10% PAA gel (bottom), or for higher resolution, on a QIAxcel DNA screening gel cartridge (top). (D) Sequencing results of the splice site usage shown in C. PAA bands were isolated, reamplified with the primer pair #2648/#2649, and sent to sequencing analysis using primer #2648. Blue shades in the sequencing chromatogram represent sequencing uniqueness, and black lines roughly indicate the level of alternative splice site usage. (E) The noncanonical CT splice site sequence CAG CTAAGTAT (cf. Figs. 1, 2) recruits SRSF3 in competition with U1 snRNA binding. In an RNA affinity chromatography assay, substrate RNAs containing a bacteriophage MS2 sequence and either canonical GT or noncanonical CT splice site sequences with otherwise full U1 snRNA complementarity were covalently linked to adipic acid dihydrazide-agarose beads (AB) and incubated with HeLa cell nuclear protein extract. Recombinant bacteriophage MS2 coat protein was added to monitor RNA input. Precipitated proteins were resolved by SDS-PAGE (15%) and detected by immunoblot analysis using anti-SRSF3, anti-SNRPC, or anti-MS2 coat protein antibodies.
Figure 5.
Figure 5.
Distributions of 269,360 exon junctions in 18,633 genes. (A) Distribution of the maximum number of reads on a single exon junction (MRIG) for all 18,633 genes. (B) Profile for top 10 numbers of reads on a single exon junction (mean ± SD). For each gene, exon junctions were ordered by their reads, then normalized by their respective maximum reads in each gene (MRIG) to obtain gene-normalized reads (GNR). Axis labels show the number of genes with at least 1, 2, …, 10 exon junctions. There were, for example, 16,739 genes with two or more exon junctions, and the second highest exon junctions had average GNR of 80%.
Figure 6.
Figure 6.
Average gene expression level (maximum number of reads on a single exon junction [MRIG]) for all exon junctions with a given dinucleotide (mean and SEM).
Figure 7.
Figure 7.
Distribution of gene-normalized reads (GNR) for all 269,360 exon junctions. At less than 2% of MRIG, 77,912 exon junctions (28.9%) were only very weakly used and contributed 0.28% of all reads. Average GNR was 42, and the median was 45. For individual dinucleotides, see Table 2.
Figure 8.
Figure 8.
Percentage of noncanonical exon junctions grouped by gene expression level (MRIG, log10 scale, separately normalized for each MRIG range) for all exon junctions (gray, 6030 noncanonical/269,360) and after exclusion of noise candidates (black, 1892 noncanonical/191,448 high-confidence). All exon junction reads were first grouped by MRIG range before normalization. After exclusion of noise, the level of noncanonical exon junctions was ∼0.4%–1% independent of gene expression level.
Figure 9.
Figure 9.
Average gene-normalized exon junction reads (GNR) for all 2090 high-confidence 5′ss with GNR ≥2% that were detected in clusters. Average GNR for primary 5′ss are shown in black bars and secondary 5′ss in gray bars.

Similar articles

Cited by

References

    1. Aebi M, Hornig H, Padgett RA, Reiser J, Weissmann C. 1986. Sequence requirements for splicing of higher eukaryotic nuclear pre-mRNA. Cell 47: 555–565. 10.1016/0092-8674(86)90620-3 - DOI - PubMed
    1. Aebi M, Hornig H, Weissmann C. 1987. 5′ cleavage site in eukaryotic pre-mRNA splicing is determined by the overall 5′ splice region, not by the conserved 5′ GU. Cell 50: 237–246. 10.1016/0092-8674(87)90219-4 - DOI - PubMed
    1. Alioto TS. 2007. U12DB: a database of orthologous U12-type spliceosomal introns. Nucleic Acids Res 35: D110–D115. 10.1093/nar/gkl796 - DOI - PMC - PubMed
    1. Arias MA, Lubkin A, Chasin LA. 2015. Splicing of designer exons informs a biophysical model for exon definition. RNA 21: 213–229. 10.1261/rna.048009.114 - DOI - PMC - PubMed
    1. Barabino SM, Blencowe BJ, Ryder U, Sproat BS, Lamond AI. 1990. Targeted snRNP depletion reveals an additional role for mammalian U1 snRNP in spliceosome assembly. Cell 63: 293–302. 10.1016/0092-8674(90)90162-8 - DOI - PubMed

Publication types

Substances

LinkOut - more resources