. 2018 Dec;28(12):1931-1942.
doi: 10.1101/gr.239202.118. Epub 2018 Oct 24.

NanoPARE: parallel analysis of RNA 5' ends from low-input RNA

Affiliations

NanoPARE: parallel analysis of RNA 5' ends from low-input RNA

Michael A Schon et al. Genome Res. 2018 Dec.

Abstract

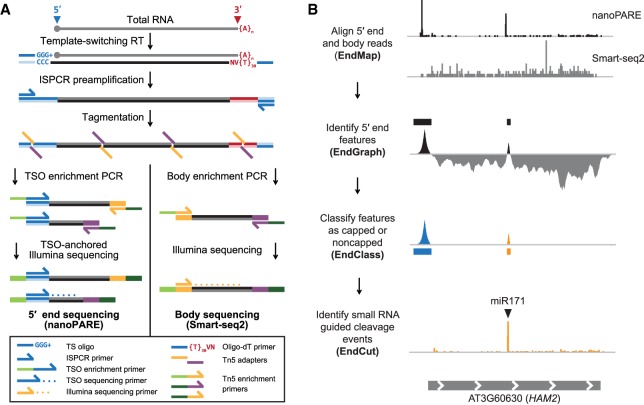
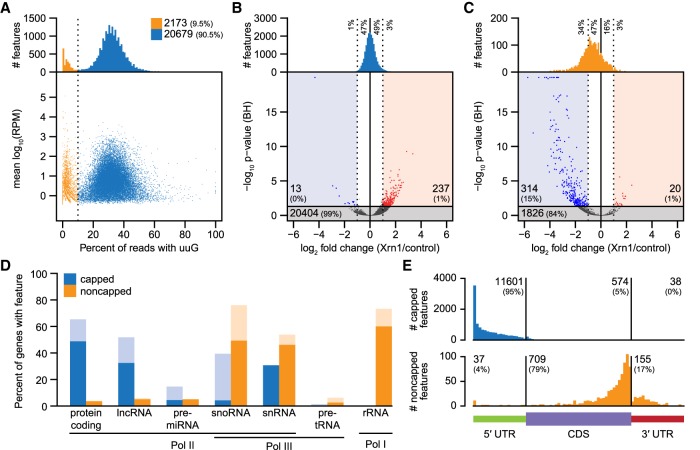
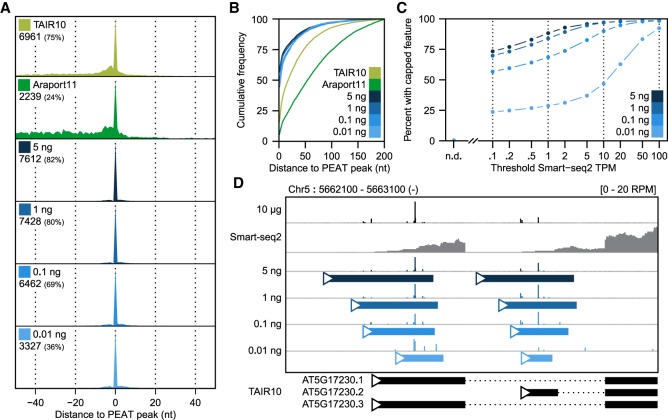
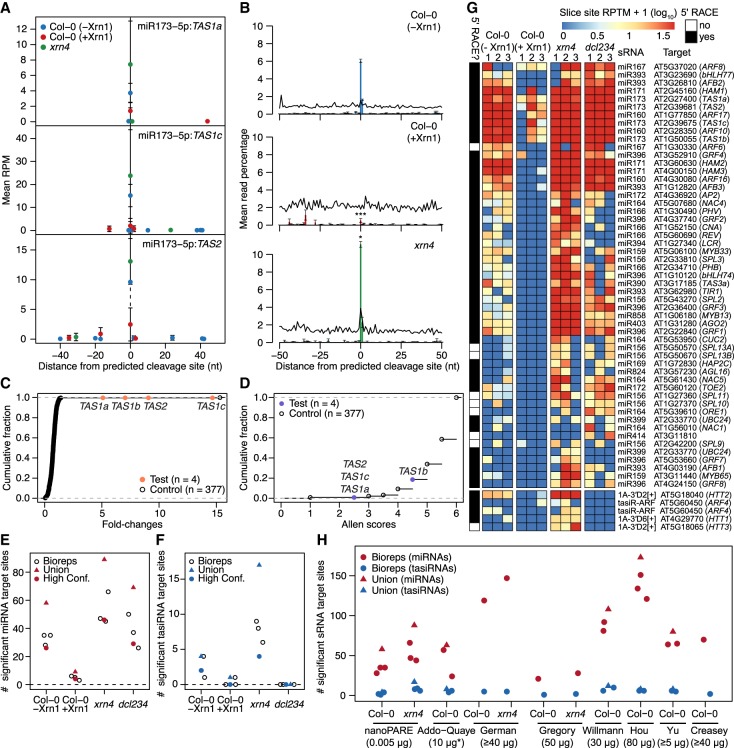
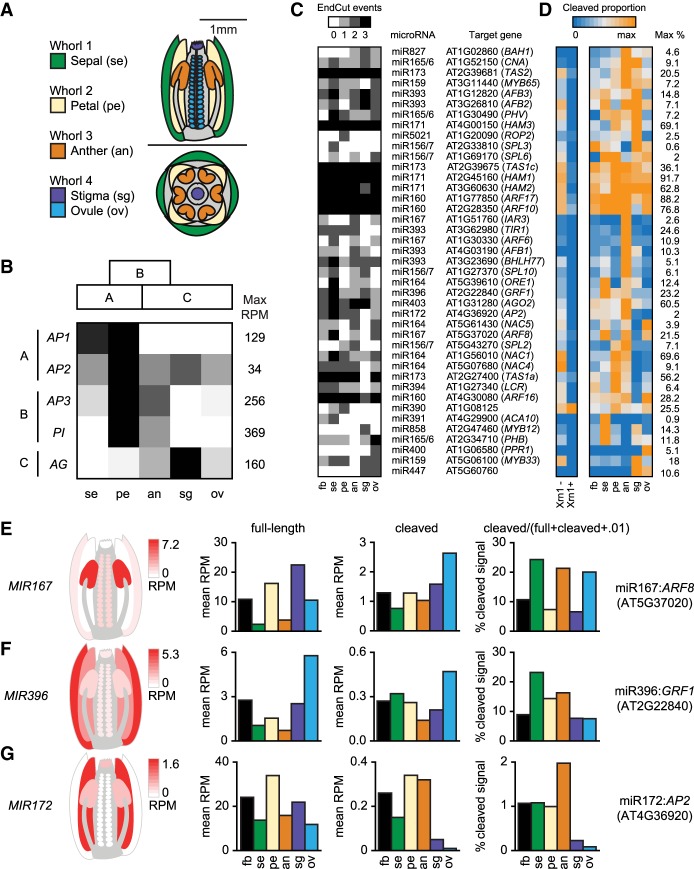
Diverse RNA 5' ends are generated through both transcriptional and post-transcriptional processes. These important modes of gene regulation often vary across cell types and can contribute to the diversification of transcriptomes and thus cellular differentiation. Therefore, the identification of primary and processed 5' ends of RNAs is important for their functional characterization. Methods have been developed to profile either RNA 5' ends from primary transcripts or the products of RNA degradation genome-wide. However, these approaches either require high amounts of starting RNA or are performed in the absence of paired gene-body mRNA-seq data. This limits current efforts in RNA 5' end annotation to whole tissues and can prevent accurate RNA 5' end classification due to biases in the data sets. To enable the accurate identification and precise classification of RNA 5' ends from standard and low-input RNA, we developed a next-generation sequencing-based method called nanoPARE and associated software. By integrating RNA 5' end information from nanoPARE with gene-body mRNA-seq data from the same RNA sample, our method enables the identification of transcription start sites at single-nucleotide resolution from single-cell levels of total RNA, as well as small RNA-mediated cleavage events from at least 10,000-fold less total RNA compared to conventional approaches. NanoPARE can therefore be used to accurately profile transcription start sites, noncapped RNA 5' ends, and small RNA targeting events from individual tissue types. As a proof-of-principle, we utilized nanoPARE to improve Arabidopsis thaliana RNA 5' end annotations and quantify microRNA-mediated cleavage events across five different flower tissues.


Figures

Figure 1.
Figure 1.
Workflow of nanoPARE and EndGraph. (A) Diagram of the nanoPARE protocol, which enables construction of a stranded 5′ end library (left) in parallel with a nonstranded transcript body library (Smart-seq2, (Picelli et al. 2013) from the same RNA sample. All oligonucleotides are labeled in the legend below. (B) Workflow of the nanoPARE data analysis pipeline for identifying distinct capped and noncapped 5′ end features from a paired nanoPARE and Smart-seq2 sequencing library. Diagram represents the output of each step, using HAM2 as an example.
Figure 2.
Figure 2.
Identification of capped and noncapped 5′ end features with EndGraph. (A) RNA 5′ end features identified from 5 ng of floral bud total RNA, distributed by the proportion of nanoPARE reads containing an upstream untemplated guanosine (uuG). The vertical line separates putative noncapped features (low-uuG, orange) from putative capped features (high-uuG, blue). (B) Volcano plot of the change in read abundance for putative capped features after digestion with Xrn1 exonuclease. Bar plots depict the distribution of all capped features by fold change versus control. Dotted lines delimit a twofold change in feature abundance. Log2 fold change and Benjamini-Hochberg adjusted P-values (BH) were calculated by DESeq2. Horizontal line demarcates an adjusted P-value of 0.05. (C) Volcano plot as in B for putative noncapped features. (D) Capped and noncapped features overlapping TAIR10 genes classified by gene type. Lighter bars include features up to 500 nt upstream of the annotation. (E) Positional distribution of capped (top) and noncapped (bottom) features that overlap protein-coding genes.
Figure 3.
Figure 3.
Sensitive low-input transcription start site detection with nanoPARE. (A) Recall of capped peaks identified with PEAT (Morton et al. 2014) in two Arabidopsis reference annotations (TAIR10 and Araport11) and in nanoPARE features detected from a dilution series of total RNA input. Numbers indicate how many PEAT peaks have a 5′ end feature within 50 bp in the test data set. (B) Cumulative frequency distribution of positional error for all 5′ features within 200 nt of a PEAT peak. (C) Sensitivity of nanoPARE in detecting capped 5′ features for nuclear protein-coding genes as a function of their abundance measured by Smart-seq2. Points indicate the percent of transcripts above the given threshold abundance (in transcripts per million, TPM) that contain a capped feature identified in at least two of three biological replicates. (D) Integrated Genomics Viewer (IGV) browser image of nanoPARE reads from the dilution series mapping to two transcription start sites of the PSY locus. y-axis shows mean reads per million (RPM) across three biological replicates for each dilution. Solid colored bars mark capped features identified by EndGraph in each dilution.
Figure 4.
Figure 4.
Detection of sRNA-mediated cleavage sites. (A) Scatter plot illustrating the number of nanoPARE read 5′ ends per million transcriptome-mapping reads within 50 nt of predicted miR173-5p–directed cleavage sites in TAS1a (top), TAS1c (middle), and TAS2 (bottom) transcripts. Mean RPM values of three biological replicates are shown for libraries prepared from 5 ng of total RNA from wild-type (Col-0) floral buds either not incubated with Xrn1 (Col-0 [−Xrn1]) or incubated with Xrn1 (Col-0 [+Xrn1]), or xrn4-5 mutant floral buds (xrn4). Error bars represent standard errors of the means. (B) Number of nanoPARE read 5′ ends mapping within 50 nt of miRNA cleavage sites significantly detected by EndCut (Benjamini-Hochberg adjusted P-values < 0.05) in Col-0 (−Xrn1) libraries are shown as bar charts of the percentage of the total number of nanoPARE reads detected for each transcript in libraries prepared from Col-0 (−Xrn1) (top), Col-0 (+Xrn1) (middle), and xrn4 (bottom) samples. Percentages of all predicted miRNA cleavage sites are shown as line graphs. * and *** indicate that the mean number of reads at predicted cleavage sites are significantly different in Col-0 (−Xrn1) libraries compared to either Col-0 (+Xrn1) or xrn4 libraries (P-values <0.05 and 0.001, respectively; one-tailed K-S tests). (C,D) Cumulative fractions of fold changes (C) and Allen scores (D) are shown for target sites predicted for either miR173-5p (test) or its randomized cohorts (control). (E,F) One-dimensional scatter plots illustrating the number of significant miRNA (E) or tasiRNA (F) target sites (Benjamini-Hochberg adjusted P-values < 0.05) detected in libraries prepared from Col-0 (−Xrn1), Col-0 (+Xrn1), xrn4, or dcl234 samples. Values for individual biological replicates (bioreps), all detected sites (union), and significant interactions observed in at least 2/3 bioreps (High conf.) are shown. (G) Heat maps depicting the number of nanoPARE read 5′ ends per 10 million transcriptome-mapping reads (RPTM; log10) mapping to the high-confidence miRNA- (top) or tasiRNA- (bottom) directed cleavage sites denoted in panels E and F. Small RNA families and corresponding targets are indicated beside each row, and targets previously verified by 5′ RACE are annotated. (H) One-dimensional scatter plot showing the number of significant miRNA and tasiRNA target sites detected with EndGraph from nanoPARE libraries prepared from Col-0 or xrn4 floral bud total RNA (nanoPARE) or published degradome/PARE libraries prepared from Col-0 or xrn4 floral tissue total RNA. Published degradome/PARE libraries are indicated by the first author of the corresponding study: Addo-Quaye (Addo-Quaye et al. 2008), German (German et al. 2008), Gregory (Gregory et al. 2008), Willmann (Willmann et al. 2014), Hou (Hou et al. 2016), Yu (Yu et al. 2016), and Creasey (Creasey et al. 2014). The amounts of total input RNA (µg) used in each publication are indicated. The asterisk denotes that the Addo-Quaye samples were prepared from polyadenylated RNA instead of total RNA.
Figure 5.
Figure 5.
Tissue-specific miRNA-target interactions with nanoPARE. (A) Diagrams of a longitudinal section (top) and cross-section (bottom) of an Arabidopsis flower at the onset of anthesis. Tissue types isolated for nanoPARE libraries are color-coded as shown. (B) Relative expression of the five ABC model homeotic genes across the five tissue types in panel A. Each row is scaled from zero to the maximum observed reads per million of a gene's capped feature. Expected spatial distributions based on the ABC model are shown as blocks above. (C,D) Heat maps of 41 high-confidence miRNA cleavage sites detected by nanoPARE in whole flowers (fb) and individual tissue types illustrating either the number of biological replicates in which the cleavage site was significantly detected (EndCut events) (C) or the proportion of cleaved signal to total full-length and cleaved signal (D). Each row is scaled to the maximum proportion observed for that interaction, which is indicated on the right. (E–G) (Left) Heat maps of the summed primary transcript levels for three families of miRNA genes in flowers as measured by nanoPARE. Floral tissues match those labeled in panel A. (Right) Bar charts depicting the relative abundance of full-length RNA, truncated RNA with a 5′ end matching the miRNA cleavage site, and the proportion of cleaved RNA to the total cleaved and full-length signal, for the most strongly cleaved target of each of the three miRNA families to the left.

Similar articles

Cited by

References

    1. Addo-Quaye C, Eshoo TW, Bartel DP, Axtell MJ. 2008. Endogenous siRNA and miRNA targets identified by sequencing of the Arabidopsis degradome. Curr Biol 18: 758–762. 10.1016/j.cub.2008.04.042 - DOI - PMC - PubMed
    1. Adiconis X, Haber AL, Simmons SK, Levy Moonshine A, Ji Z, Busby MA, Shi X, Jacques J, Lancaster MA, Pan JQ, et al. 2018. Comprehensive comparative analysis of 5′-end RNA-sequencing methods. Nat Methods 15: 505–511. 10.1038/s41592-018-0014-2 - DOI - PMC - PubMed
    1. Allen E, Xie Z, Gustafson AM, Carrington JC. 2005. microRNA-directed phasing during trans-acting siRNA biogenesis in plants. Cell 121: 207–221. 10.1016/j.cell.2005.04.004 - DOI - PubMed
    1. Andersson R, Gebhard C, Miguel-Escalada I, Hoof I, Bornholdt J, Boyd M, Chen Y, Zhao X, Schmidl C, Suzuki T, et al. 2014. An atlas of active enhancers across human cell types and tissues. Nature 507: 455–461. 10.1038/nature12787 - DOI - PMC - PubMed
    1. Arguel M-J, LeBrigand K, Paquet A, Ruiz García S, Zaragosi L-E, Barbry P, Waldmann R. 2017. A cost effective 5′ selective single cell transcriptome profiling approach with improved UMI design. Nucleic Acids Res 45: e48 10.1093/nar/gkw1242 - DOI - PMC - PubMed

Publication types