. 2018 Dec 12;38(50):10644-10656.
doi: 10.1523/JNEUROSCI.0904-18.2018. Epub 2018 Oct 24.

Asymmetric and Distant Effects of a Unilateral Lesion of the Primary Motor Cortex on the Bilateral Supplementary Motor Areas in Adult Macaque Monkeys

Affiliations

Asymmetric and Distant Effects of a Unilateral Lesion of the Primary Motor Cortex on the Bilateral Supplementary Motor Areas in Adult Macaque Monkeys

A Contestabile et al. J Neurosci. .

Abstract

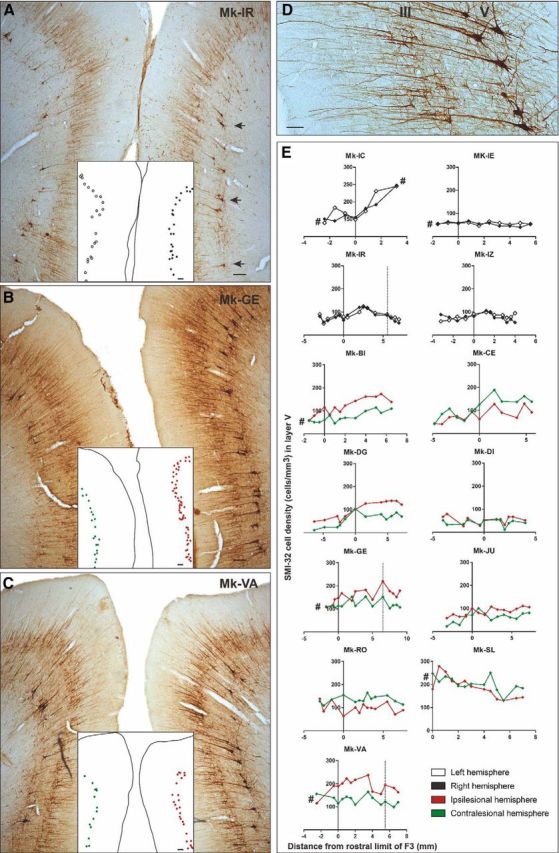
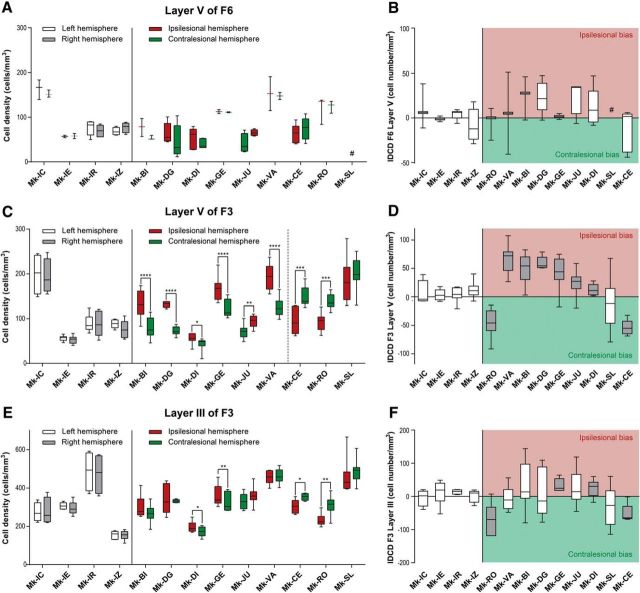
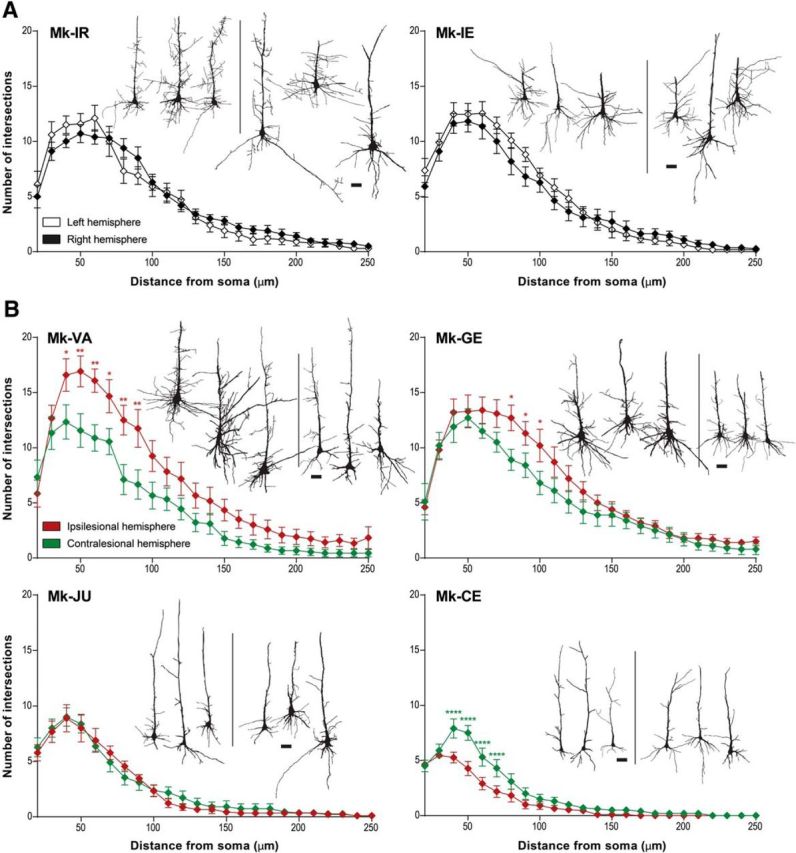
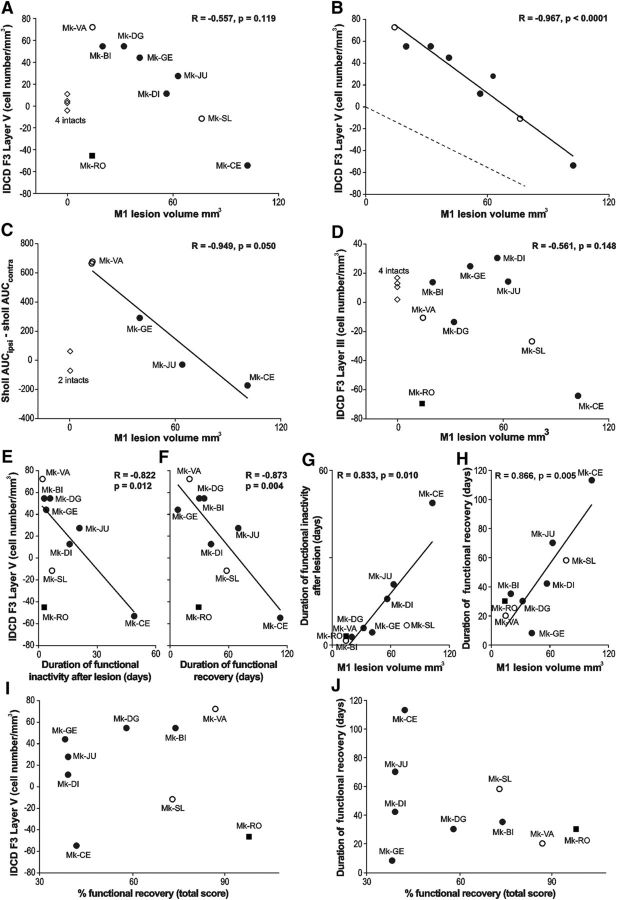
A restricted lesion of the hand area in the primary motor cortex (M1) leads to a deficit of contralesional manual dexterity, followed by an incomplete functional recovery, accompanied by plastic changes in M1 itself and in other cortical areas on both hemispheres. Using the marker SMI-32 specific to pyramidal neurons in cortical layers III and V, we investigated the impact of a focal unilateral M1 lesion (hand representation) on the rostral part (F6) and caudal part (F3) of the supplementary motor area (SMA) in both hemispheres in nine adult macaque monkeys compared with four intact control monkeys. The M1 lesion induced a consistent interhemispheric asymmetry in density of SMI-32-positive neurons in F3 layer V (statistically significant in 8 of 9 lesioned monkeys), highly correlated with the lesion volume and with the duration of functional recovery, but not with the extent of functional recovery itself. Such interhemispheric asymmetry was neither present in the intact monkeys, as expected, nor in F6 in all monkeys. In addition, the M1 lesion also impacted on the basal dendritic arborization of F3 layer V neurons. Neuronal density was clearly less affected by the M1 lesion in F3 layer III compared with layer V. We interpret the remote effect of M1 lesion onto the density of SMI-32-positive neurons and dendritic arborization in the SMAs bilaterally as the consequence of multiple factors, such as changes of connectivity, diaschisis and various mechanisms involved in cortical plasticity underlying the functional recovery from the M1 lesion.SIGNIFICANCE STATEMENT The motor system of macaque monkeys, in addition to be similarly organized as in humans, is a good candidate to study the impact of a focal lesion of the main contributor to voluntary movements, the primary motor cortex (M1), on non-primary motor cortical areas also involved in manual dexterity, both at behavioral and structural levels. Our results show that a unilateral permanent lesion of M1 hand area in nine monkeys affects the interhemispheric balance of the number of SMI-32-positive pyramidal neurons in the cortical layer V of the supplementary motor area, in a way strongly correlated to the lesion volume and duration of the incomplete functional recovery.

Keywords: cortical lesion; diaschisis; manual dexterity; motor cortex; nonhuman primate.


Figures

Figure 1.
Figure 1.
A, Schematic representation of a macaque brain showing the location of pre-SMA (area F6, orange), SMA-proper (area F3, red), and their anatomical connectivity with the M1 (F1, beige). F2 and F7 correspond to the caudal and rostral parts of the dorsal premotor cortex (PMd), respectively. F4 and F5 correspond to the caudal and rostral parts of the PMv, respectively. The straight double-head arrows in gray represent the interhemispheric connections, with the notion that interhemispheric callosal connections are less dense in F1 than in F3 and F6. Furthermore, F3 projects more strongly on the ipsilateral F1 than on the contralateral F1 (black arrows). The curved double head gray arrows represent the interconnections between F3 and F6. Importantly, F6 does not project to F1 and reciprocally. As explained in the method section, the limit between F3 and F6 was displaced 3 mm rostral to the genu of the arcuate sulcus, to ensure full inclusion of F3 in the histological analysis. B, C, Schematic representation of the extent and location of the F1 lesion (red area) in the nine monkeys involved in the present study, as seen in transparency on the cortical surface. The two monkeys in C were treated with anti-Nogo-A antibody after the lesion, whereas the seven other monkeys (B) were untreated. D, E, Photomicrographs of coronal histological sections through F1 (Mk-DI) showing the induced permanent lesion in the hand representation. Scale bar, 100 μm. The adjacent sections derived from two series were processed to visualize SMI-32 staining (D) or Nissl staining (E). F, Graphical representation of typical behavioral performance of macaque monkeys in the modified Brinkman board task. The manual performance of each hand is given by the score (number of pellets retrieved in the first 30 s of the task from the randomly distributed wells) as a function of time (days) before and after a lesion of the hand representation in F1. Day 0 corresponds to the day of the lesion (vertical red line). Relevant for the present report are the scores (for the contralesional hand) pre-lesion [(1) the horizontal orange line is the median score] and postlesion [(4), the horizontal orange line is the median score]. The total duration of functional recovery of manual dexterity (2) after lesion is given by the time interval between the lesion (red vertical line) and the onset of the postlesion plateau (vertical blue line). The duration of total loss of manual dexterity [(3) score = 0] is the time interval between the lesion and the first consistent successful attempt to retrieve a pellet (vertical orange line). SAS, Superior arcuate sulcus; IAS, inferior arcuate sulcus; AS, arcuate spur; SP, sulcus principalis; LS, lateral sulcus; CS, central sulcus.
Figure 2.
Figure 2.
AC, Photomicrographs of coronal brain histological sections of an intact macaque monkey (A; Mk-IR), a lesioned monkey (B; Mk-GE) and a lesioned monkey treated with the anti-Nogo-A antibody (C; Mk-VA), all stained with SMI-32. Scale bars, 100 μm. The medial part of SMA of each hemisphere is visible in these coronal sections. The localization of the SMI-32-positive neurons taken into account for the Sholl analysis is shown in A (arrows). A dot representation of layer V SMI-32-positive neurons included in our analyses is illustrated in the white insets. The layer V SMI-32-positive neurons in the lesioned hemisphere (images, right) are indicated with red dots, and the ones in the intact hemisphere (image, left) are indicated with green dots in BC. Higher-magnification photomicrograph of a coronal section of F3 in the right hemisphere of a macaque monkey (Mk-VA). Scale bar, 40 μm. The layers III and V are visible with the corresponding SMI-32-positive pyramidal cells and their identifiable dendritic arborization. E, Graphs representing the rostrocaudal gradient (from F6 to F3) of SMI-32-positive cell density in layer V of all monkeys. The cell density for each hemisphere is plotted as a function of the distance from the F3–F6 border, which has been set to 3 mm rostrally to the genu of the arcuate sulcus. Negative distance values belong to F6 and positive distance values belong to F3. Vertical dashed lines (Mk-IR, Mk-GE, and Mk-VA) correspond to quantification of SMI-32-positive neurons observed in the photomicrographs of AC, respectively. The # symbol was used to indicate that the analyzed cortex region was not complete (sections lacking for the analysis).
Figure 3.
Figure 3.
Box plots of interhemispheric morphological data obtained in the three investigated cortical regions (layer V of F6; layer V of F3; layer III of F3): cell density on both hemispheres in A, C, and E, and IDCD in corresponding regions in B, D, and F. A, C, E, Box plots showing the SMI-32-positive cell densities in layer V of F6 (A), as well as in layer V (C) and layer III (E) of F3 in each hemisphere for each monkey. In the four intact monkeys, the cell density in the left and right hemispheres is represented in white and gray, respectively. In the nine monkeys subjected to unilateral M1 lesion, the cell density in the ipsilesional and contralesional hemispheres is represented in red and green, respectively. As statistical test, a paired t test or Wilcoxon test was performed (*p ≤ 0.05, **p ≤ 0.01, ***p ≤ 0.001, ****p ≤ 0.0001), comparing the density in the two hemispheres in each consecutive histological section. The absence of asterisks means “not statistically significant” (p > 0.05). B, D, and F, Box plots showing the IDCD of SMI-32-positive cells in layer V of F6 (B), as well as in layer V (D) and layer III (F) of F3 in each monkey. Lesioned animals, on the right, were ordered from left to right according to an increasing M1 lesion volume. The white boxes point to the animals with a non-statistically significant IDCD, whereas the gray boxes show the animals with a significant IDCD. B, All boxes should appear in white as none of the IDCDs are statistically significant (a few boxes are too small to appear white at that scale). A positive IDCD corresponds to an ipsilesional bias in pyramidal SMI-32-positive neurons density, whereas a negative IDCD corresponds to a contralesional bias. In all plots, the ID of each individual monkey is indicated along the abscissa. #, missing data.
Figure 4.
Figure 4.
A, B, Sholl profiles of basal dendrites of layer V SMI-32-positive neurons in each hemisphere in two intact monkeys (A) and in four M1 lesioned monkeys (B). For each monkey, histological reconstruction of three analyzed cells from each hemisphere are shown as examples (the 3 cells on the left belong to the left hemisphere and the 3 cells on the right belong to the right hemisphere. All lesioned monkeys presented here had a lesion in the left hemisphere). Scale bars, 20 μm. Intersections were counted at 10 μm intervals from the soma center up to a radius of 250 μm. The curves represent the mean intersection values ± SD. As statistical test, a two-way ANOVA was performed (*p ≤ 0.05, **p ≤ 0.01, ****p ≤ 0.0001).
Figure 5.
Figure 5.
A, B, D, The IDCD in F3 (A, B, layer V; D, layer III) was plotted as a function of the M1 lesion volume. A, Includes all animals, whereas the intact monkeys, as well as the outlier Mk-RO (square), have been omitted in B (see Results). B, The dashed line represents the hypothesized interhemispheric cell density asymmetry (see Introduction). D, The regression line and the correlation coefficient do not include the intact monkeys and the outlier Mk-RO. C, The correlation between the dendritic Sholl analysis (AUC) and the M1 lesion volume (without the 2 intact monkeys). EH, Focus on possible behavioral correlates, such as duration in days of functional inactivity after lesion (E, G) and duration of functional recovery (F, H). These two behavioral parameters were correlated with the IDCD in F3 layer V in E and F, as well as with the M1 lesion volume in G and H. I, J, The absence of statistically significant correlation between: the IDCD in F3 layer V and the extent (percentage) of functional recovery (I; r = 0.049; p = 0.900); The duration of functional recovery and the extent of functional recovery (J; r = 0.355; p = 0.349).

Similar articles

Cited by

References

    1. Auriat AM, Neva JL, Peters S, Ferris JK, Boyd LA (2015) A review of transcranial magnetic stimulation and multimodal neuroimaging to characterize post-stroke neuroplasticity. Front Neurol 6:226. 10.3389/fneur.2015.00226 - DOI - PMC - PubMed
    1. Bashir S, Kaeser M, Wyss A, Hamadjida A, Liu Y, Bloch J, Brunet JF, Belhaj-Saif A, Rouiller EM (2012) Short-term effects of unilateral lesion of the primary motor cortex (M1) on ipsilesional hand dexterity in adult macaque monkeys. Brain Struct Funct 217:63–79. 10.1007/s00429-011-0327-8 - DOI - PMC - PubMed
    1. Beaud ML, Schmidlin E, Wannier T, Freund P, Bloch J, Mir A, Schwab ME, Rouiller EM (2008) Anti-nogo-A antibody treatment does not prevent cell body shrinkage in the motor cortex in adult monkeys subjected to unilateral cervical cord lesion. BMC Neurosci 9:5. 10.1186/1471-2202-9-5 - DOI - PMC - PubMed
    1. Beaud ML, Rouiller EM, Bloch J, Mir A, Schwab ME, Wannier T, Schmidlin E (2012) Invasion of lesion territory by regenerating fibers after spinal cord injury in adult macaque monkeys. Neuroscience 227:271–282. 10.1016/j.neuroscience.2012.09.052 - DOI - PubMed
    1. Bestmann S, Swayne O, Blankenburg F, Ruff CC, Teo J, Weiskopf N, Driver J, Rothwell JC, Ward NS (2010) The role of contralesional dorsal premotor cortex after stroke as studied with concurrent TMS-fMRI. J Neurosci 30:11926–11937. 10.1523/JNEUROSCI.5642-09.2010 - DOI - PMC - PubMed

Publication types

LinkOut - more resources