. 2019 Jan 4;93(2):e01642-18.
doi: 10.1128/JVI.01642-18. Print 2019 Jan 15.

Group A Rotavirus VP1 Polymerase and VP2 Core Shell Proteins: Intergenotypic Sequence Variation and In Vitro Functional Compatibility

Affiliations

Group A Rotavirus VP1 Polymerase and VP2 Core Shell Proteins: Intergenotypic Sequence Variation and In Vitro Functional Compatibility

Courtney L Steger et al. J Virol. .

Abstract

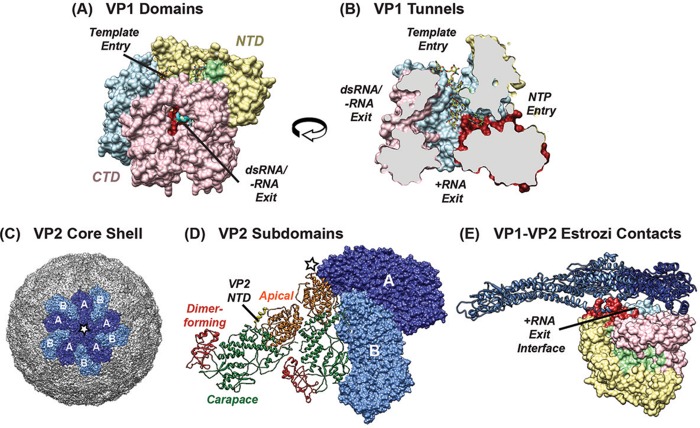
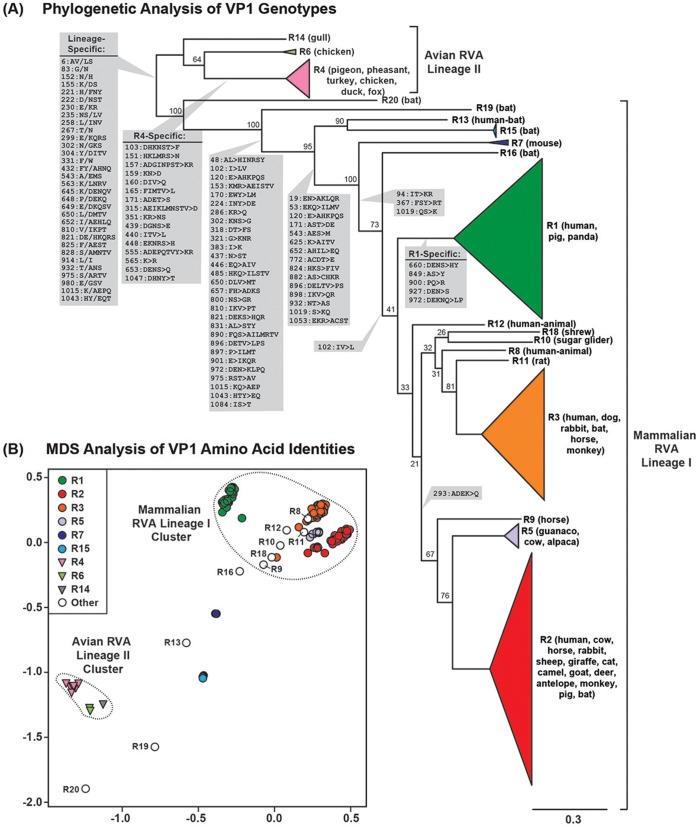
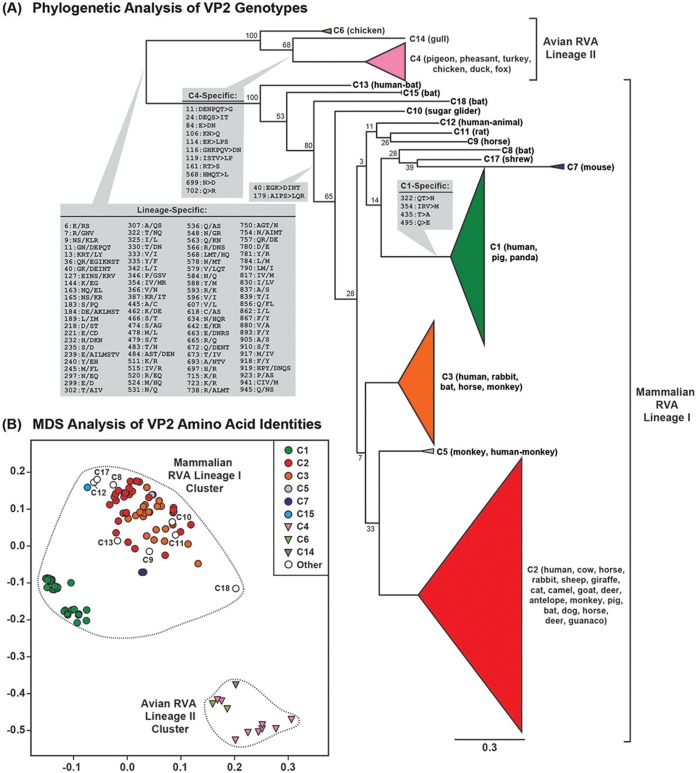
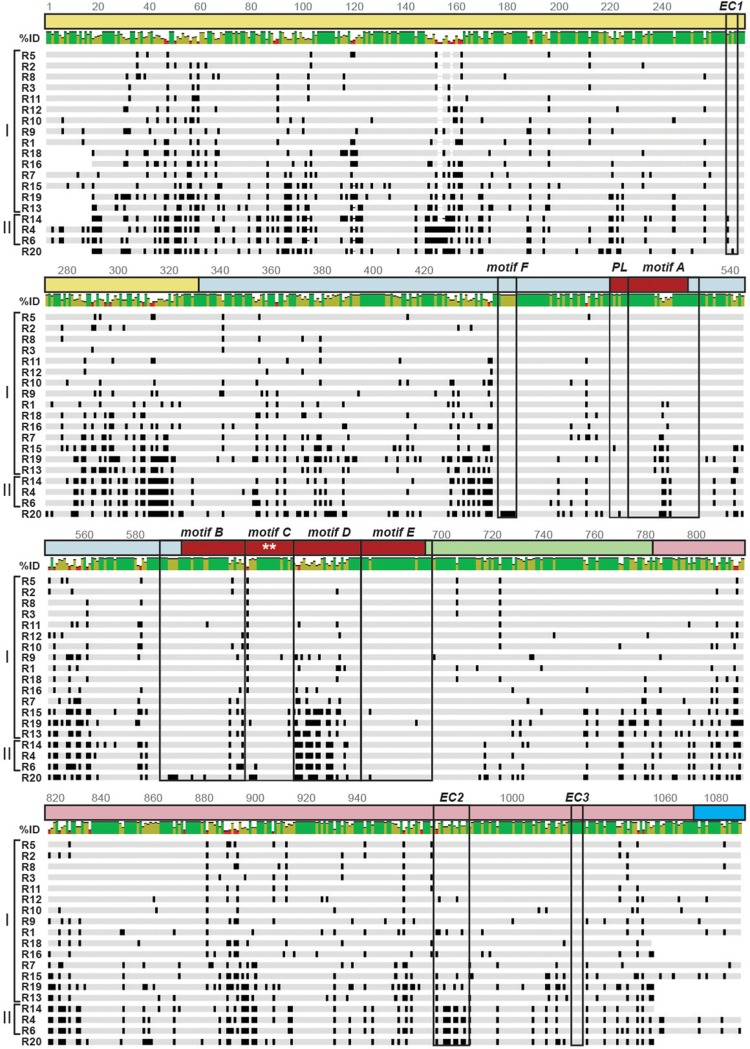
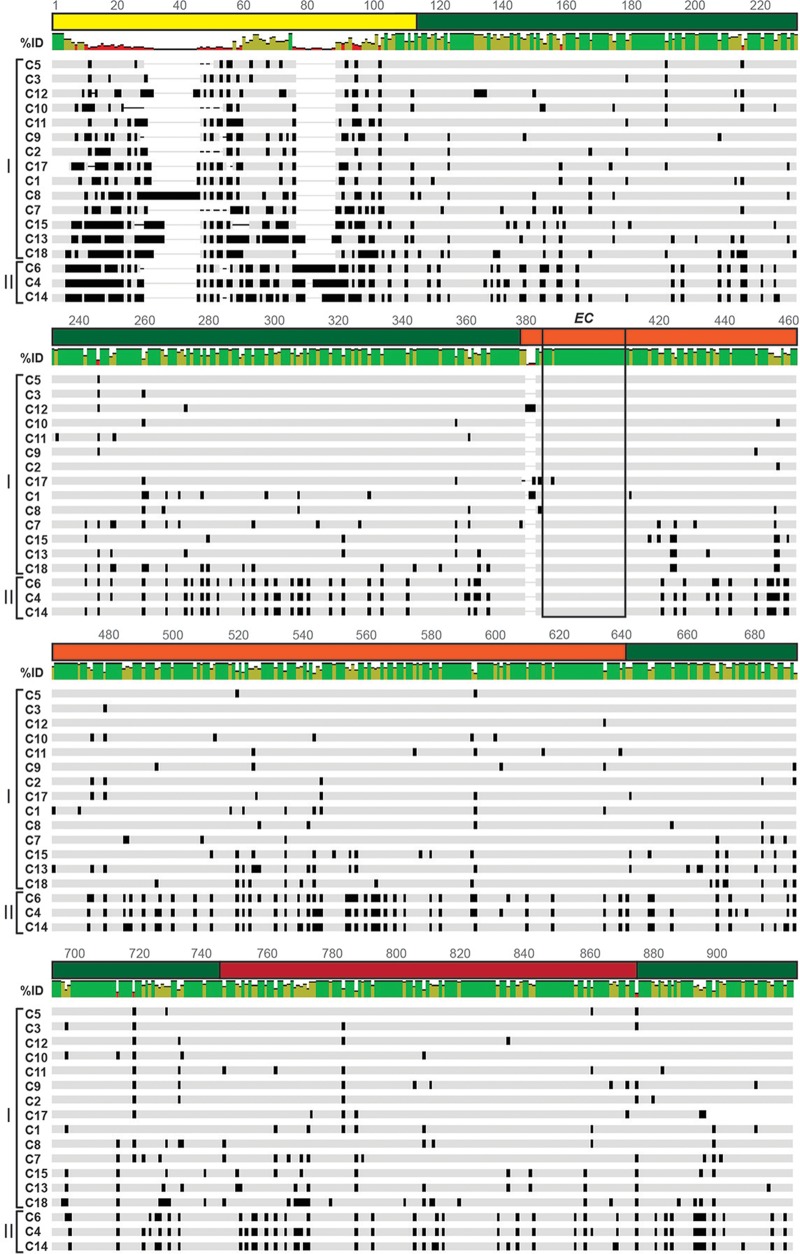
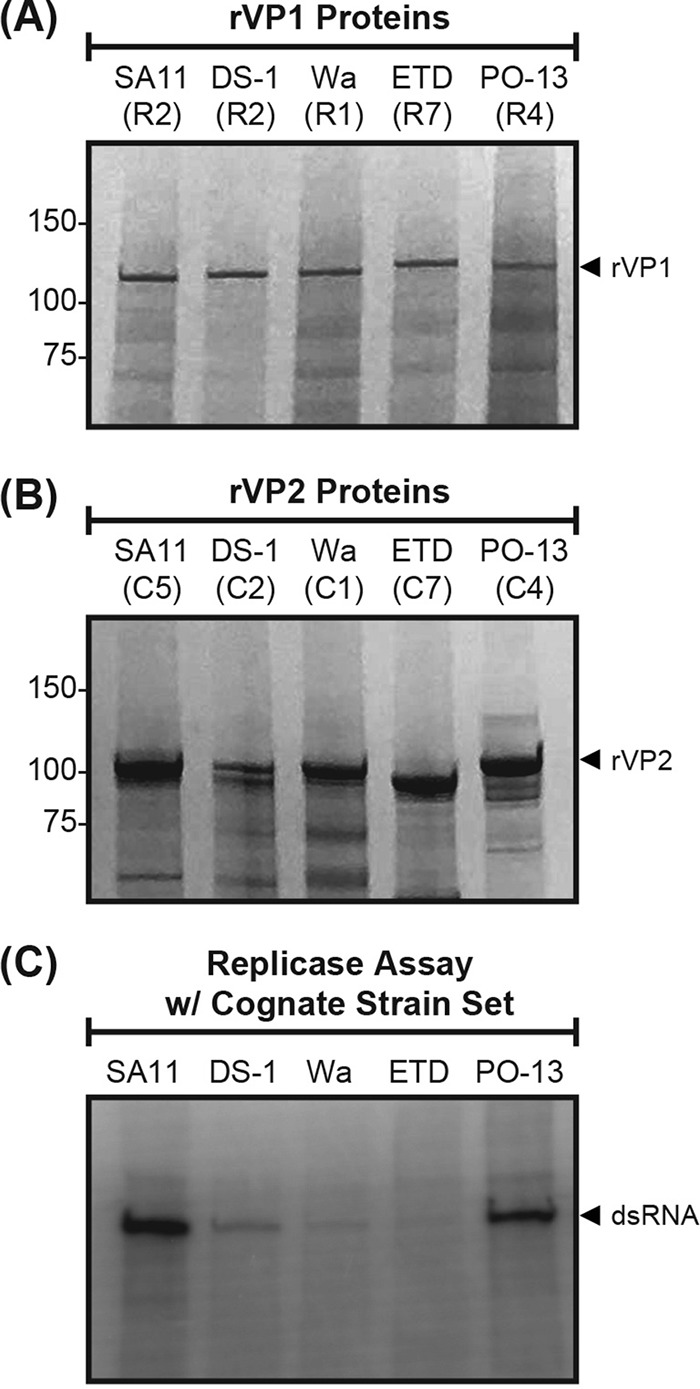
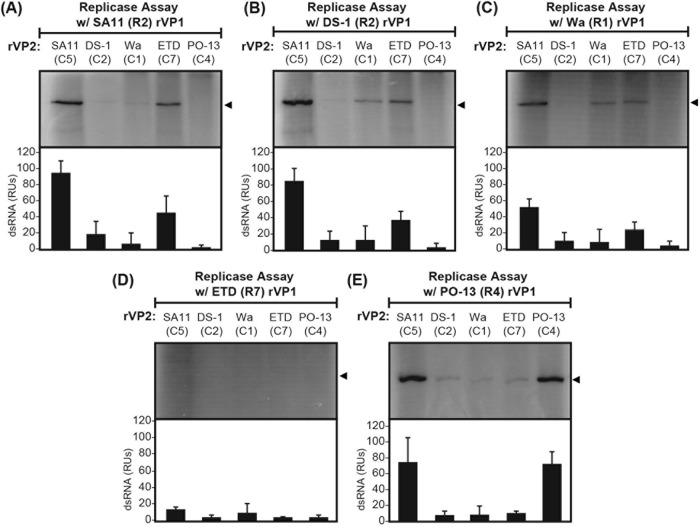
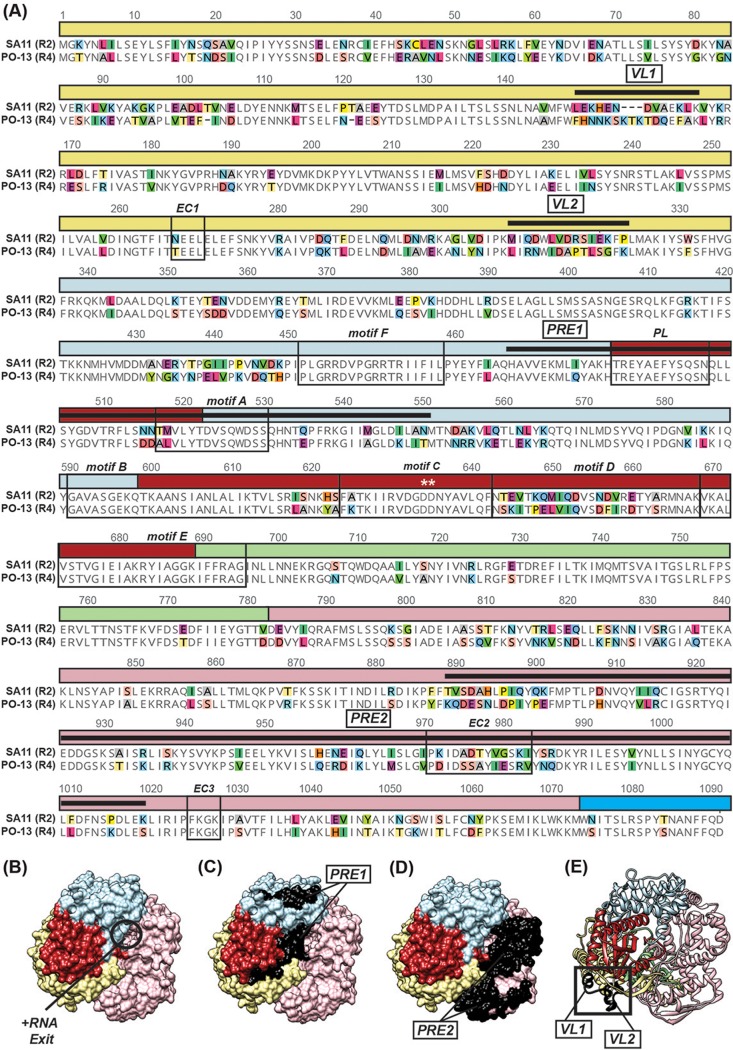
Group A rotaviruses (RVAs) are classified according to a nucleotide sequence-based system that assigns a genotype to each of the 11 double-stranded RNA (dsRNA) genome segments. For the segment encoding the VP1 polymerase, 22 genotypes (R1 to R22) are defined with an 83% nucleotide identity cutoff value. For the segment encoding the VP2 core shell protein, which is a functional VP1-binding partner, 20 genotypes (C1 to C20) are defined with an 84% nucleotide identity cutoff value. However, the extent to which the VP1 and VP2 proteins encoded by these genotypes differ in their sequences or interactions has not been described. Here, we sought to (i) delineate the relationships and sites of variation for VP1 and VP2 proteins belonging to the known RVA genotypes and (ii) correlate intergenotypic sequence diversity with functional VP1-VP2 interaction(s) during dsRNA synthesis. Using bioinformatic approaches, we revealed which VP1 and VP2 genotypes encode divergent proteins and identified the positional locations of amino acid changes in the context of known structural domains/subdomains. We then employed an in vitro dsRNA synthesis assay to test whether genotype R1, R2, R4, and R7 VP1 polymerases could be enzymatically activated by genotype C1, C2, C4, C5, and C7 VP2 core shell proteins. Genotype combinations that were incompatible informed the rational design and in vitro testing of chimeric mutant VP1 and VP2 proteins. The results of this study connect VP1 and VP2 nucleotide-level diversity to protein-level diversity for the first time, and they provide new insights into regions/residues critical for VP1-VP2 interaction(s) during viral genome replication.IMPORTANCE Group A rotaviruses (RVAs) are widespread in nature, infecting numerous mammalian and avian hosts and causing severe gastroenteritis in human children. RVAs are classified using a system that assigns a genotype to each viral gene according to its nucleotide sequence. To date, 22 genotypes have been described for the gene encoding the viral polymerase (VP1), and 20 genotypes have been described for the gene encoding the core shell protein (VP2). Here, we analyzed if/how the VP1 and VP2 proteins encoded by the known RVA genotypes differ from each other in their sequences. We also used a biochemical approach to test whether the intergenotypic sequence differences influenced how VP1 and VP2 functionally engage each other to mediate RNA synthesis in a test tube. This work is important because it increases our understanding of RVA protein-level diversity and raises new ideas about the VP1-VP2 binding interface(s) that is important for viral replication.

Keywords: RNA synthesis; RNA-dependent RNA polymerase; core shell protein; diversity; genome replication; genotypes; rotavirus.


Figures

FIG 1
FIG 1
Structures of VP1 and VP2. (A) Atomic structure of SA11 (R2) rVP1 (PDB accession no. 2R7R) shown in a surface representation and colored according to domain/subdomain organization. The N-terminal domain (NTD) (yellow) and the C-terminal domain (CTD) (pink) surround the central polymerase domain, which is comprised of canonical finger (blue), palm (red), and thumb (green) subdomains. The extreme C terminus of the protein forms a plug, which is colored cyan and shown in a ribbon representation. (B) Structure in panel A rotated 90° to the left and computationally sliced through the middle to reveal four tunnels extending into the catalytic core. Known or putative functions of the tunnels are labeled, and a 7-nucleotide RNA template is shown in a stick figure representation. (C) Structure of the core shell of a bovine rotavirus (PDB accession no. 3KZ4) depicted in a surface representation. A central VP2 decamer is shown in dark and light blue to highlight five VP2-A and five VP2-B monomers, respectively. (D) Two neighboring VP2 dimers (each comprised of one VP2-A monomer and one VP2-B monomer). One dimer is depicted in a surface representation, with the same coloration as in panel C. The other VP2 dimer is shown in a ribbon representation and colored to show the subdomain organization of the principal scaffold domain (red, dimer forming; orange, apical; green, carapace). The resolved portion of the VP2 NTD is colored in yellow and indicated on the structure. (E) Structure depicting VP1-VP2 contacts within the bovine RVA DLP (PDB accession no. 4F5X). VP1 and VP2 are colored as in panels A to C. The VP1 monomer is oriented beneath the VP2 capsid layer such that residues surrounding the +RNA exit tunnel contact VP2.
FIG 2
FIG 2
Intergenotypic relationships among VP1 genes and proteins. (A) An intergenotypic maximum likelihood phylogenetic tree was inferred from the aligned ORFs of 158 sequences representing genotypes R1 to R16 and R18 to R20. Horizontal branch lengths are drawn to scale (nucleotide substitutions per base), with bootstrap values shown as percentages for key nodes. Monophyletic groupings were collapsed and are shown as colored, cartooned triangles representing a single genotype. Genotypes are indicated for each branch/triangle, and the animal host of the corresponding RVA is listed in parentheses. Brackets indicate two phylogenetically distinct lineages of VP1 proteins (lineages I and II). Amino acid positions and residue changes that differentiate key branch points are overlaid on the tree (gray boxes). In all cases, the amino acid change(s) is listed in the same directionality as the tree (i.e., amino acid[s] of left branches>amino acid[s] of right branches). The position number is based upon that of the longest gene. (B) Pairwise amino acid sequence distances represented in an MDS plot. x and y axes are arbitrary coordinates in 2D space that allowed proper visualization of genotypes. Colors of genotypes are the same as in panel A, and clusters are indicated by dotted lines.
FIG 3
FIG 3
Intergenotypic relationships among VP2 genes and proteins. (A) An intergenotypic maximum likelihood phylogenetic tree was inferred from the ORF data for 158 sequences representing genotypes C1 to C15, C17, and C18. Horizontal branch lengths are drawn to scale (nucleotide substitutions per base), with bootstrap values shown as percentages for key nodes. Monophyletic groupings were collapsed and are shown as colored, cartooned triangles representing a single genotype. Genotypes are indicated for each branch/triangle, and the animal host of the corresponding RVA is listed in parentheses. Brackets indicate two phylogenetically distinct lineages of VP2 proteins (lineages I and II). Amino acid positions and residue changes that differentiate key branch points are overlaid on the tree (gray boxes). In all cases, the amino acid change(s) is listed in the same directionality as the tree (i.e., amino acid[s] of left branches>amino acid[s] of right branches). The position number is based upon that of the longest gene. (B) Pairwise amino acid sequence distances represented in an MDS plot. x and y axes are arbitrary coordinates in 2D space that allowed proper visualization of genotypes. Colors of genotypes are the same as in panel A, and lineages are indicated by dotted lines.
FIG 4
FIG 4
VP1 genotype consensus amino acid sequence alignment. The schematic shows an amino acid sequence alignment of RVA VP1 consensus sequences for genotypes R1 to R16 and R18 to R20. The VP1 domains and subdomains are represented by a line above the sequence and are colored as in Fig. 1A and B. Motifs A to F, the priming loop (PL), and the VP1-VP2 interaction sites predicted by Estrozi et al. (EC1, EC2, and EC3) are outlined in boxes. The active site is indicated with asterisks. Amino acid positions are listed. Dashes indicate gaps in the protein sequence, light gray shading indicates conservation of amino acid identity, and black shading represents variation in amino acid identity. Genotypes are listed on the left, and lineages are defined by brackets. R20 (lineage I) is positioned at the bottom of the alignment due to its amino acid similarities with lineage II genotypes (R4, R6, and R14). Percent identity is shown as a colorized graph above the alignment; green bars represent residues with a high degree of intergenotypic conservation, red bars represent residues with little intergenotypic conservation, and yellow bars are intermediary. An enlarged alignment showing amino acid residues is available in Fig. S1 in the supplemental material.
FIG 5
FIG 5
VP2 genotype consensus amino acid sequence alignment. The schematic shows an amino acid sequence alignment of RVA VP2 consensus sequences for genotypes C1 to C15, C17, and C18. Dashes indicate gaps in the protein sequence, light gray shading indicates conservation of amino acid identity, and black shading represents variation in amino acid identity. Genotypes are listed on the left, and lineages are defined by brackets. Percent identity is shown as a colorized graph above the segment that corresponds to the sequence below; green bars represent residues with a high degree of intergenotypic conservation, red bars represent residues with little intergenotypic conservation, and yellow bars are intermediary. The VP2 domains and subdomains are represented by a line above the sequence and are colored as in Fig. 1D, and the VP1-VP2 interaction sites predicted by Estrozi et al. (EC) are outlined in a box. Amino acid positions are indicated. An enlarged alignment showing amino acid residues is available in Fig. S2 in the supplemental material.
FIG 6
FIG 6
In vitro dsRNA synthesis by rVP1 and rVP2 proteins of several different genotypes. (A and B) Approximately 2 pmol purified rVP1 (A) or 8 pmol purified rVP2 (B) was electrophoresed in 4 to 15% SDS-polyacrylamide gels and visualized by Coomassie blue staining. Molecular masses (in kilodaltons) are shown to the left of each gel. The strain name and genotype of the recombinant proteins are specified above the corresponding lane. (C) In vitro dsRNA synthesis assays were performed using 2 pmol of rVP1, 8 pmol of rVP2, and 16 pmol of an RVA +RNA template. Radiolabeled dsRNA products made by rVP1/rVP2 proteins of SA11 (R2/C5), DS-1 (R2/C2), Wa (R1/C1), ETD (R7/C7), and PO-13 (R4/C4) were resolved on 4 to 15% SDS-polyacrylamide gels and detected with a phosphorimager. Experiments were repeated three times with four distinct protein batches, and representative images are shown.
FIG 7
FIG 7
In vitro functional compatibility of rVP1 and rVP2 proteins. In vitro dsRNA synthesis assays were performed using 2 pmol of SA11 (R2) rVP1 (A), DS-1 (R2) rVP1 (B), Wa (R1) rVP1 (C), ETD (R7) rVP1 (D), or PO-13 (R4) rVP1 (E) in the presence of 8 pmol of rVP2 protein from strains SA11 (C5), DS-1 (C2), Wa (C1), ETD (C7), and PO-13 (C4) in a mix-n-match format. All reaction mixtures contained 16 pmol of RVA +RNA template and were incubated at 37°C for 180 min. Radiolabeled dsRNA products (indicated with arrowheads) were resolved on 4 to 15% SDS-polyacrylamide gels and detected with a phosphorimager. Radiolabeled dsRNA from three independent experiments using at least two independent protein batches was quantified and expressed as relative units (RUs). Averages are shown as bar graphs below each gel, and error bars represent standard deviations from the means.
FIG 8
FIG 8
Amino acid differences between SA11 (R2) VP1 and PO-13 (R4) VP1. (A) Primary amino acid sequence alignment of SA11 (R2) VP1 and PO-13 (R4) VP1. Dashes indicate gaps in the protein sequence, and colored shading represents variation in amino acid identity. The VP1 domains and subdomains are represented by a line above the sequence and are colored as in Fig. 1A and B. Motifs A to F, the priming loop (PL), and VP1-VP2 interaction sites (EC1, EC2, and EC3) are identified in boxed regions. Surface-exposed regions surrounding the +RNA exit tunnel (PRE) and two surface-exposed loops (VL) are indicated with thick black lines above the sequence. The active site is indicated with asterisks. The amino acid position is listed above the alignment. (B) Atomic structure of SA11 (R2) rVP1 (PDB accession no. 2R7R) shown in a surface representation with the +RNA exit tunnel facing forward and labeled. (C and D) Structure of SA11 (R2) rVP1 shown in the same orientation as in panel B with PRE1 (C) or PRE2 (D) residues colored in black and labeled. (E) Structure of SA11 (R2) rVP1 in the same orientation as in panels B to D depicted in a ribbon representation with VL1 and VL2 residues colored in black and labeled.
FIG 9
FIG 9
Molecular dynamics simulation of VP1 protein structures. Molecular dynamics simulations were performed using GROMACS v5.1.347 on a modified atomic structure of SA11 (R2) VP1 (PDB accession no. 2R7R) or on a homology model of PO-13 (R4) VP1 under conditions described previously (26, 49). Three trajectories initiated with different random seeds were run for each protein structure. The RMSF of alpha-carbons from each of the three trajectories was calculated. B-factors for each residue were calculated from the RMSF values. Average B-factors are shown for the entire VP1 proteins (A) and the VL1 regions (residues 146 to 168) (B). In both panels A and B, residue position numbers are shown on the x axis, SA11 (R2) VP1 B-factors are plotted as gray boxes, and PO-13 (R4) VP1 B-factors are plotted as black boxes. Error bars represent standard deviations from the means following three independent simulations. In panel A, the percent amino acid sequence identity values are shown in a graphical representation, and the domains and regions of interest according to Fig. 8 for VP1 are indicated.
FIG 10
FIG 10
In vitro dsRNA synthesis by chimeric rVP1 proteins. (A) Linear schematics of recombinant VP1 proteins shown as boxes. For all genes, the SA11 sequence is shown in gray, and the PO-13 sequence is shown in black. Amino acid numbers are listed above the schematic, and general locations of mutated regions are shown. (B) Approximately 2 pmol purified SA11 (R2) rVP1, PO-13 (R4) rVP1, PRE1 rVP1, PRE1 + 2 rVP1, VL1 rVP1, or VL2 rVP1 was electrophoresed in a 4 to 15% SDS-polyacrylamide gel and visualized by Coomassie blue staining. Molecular masses (in kilodaltons) are shown to the left. (C and D) Radiolabeled dsRNA synthesis products synthesized by 2 pmol of each rVP1 protein in the presence of 8 pmol of rVP2 from strain SA11 (C5) rVP2 (C) or PO-13 (C4) rVP2 (D). All reaction mixtures contained 16 pmol of an RVA +RNA template and were incubated at 37°C for 180 min. Radiolabeled dsRNA products were resolved on 4 to 15% SDS-polyacrylamide gels and visualized using either a phosphorimager or autoradiography. Radiolabeled dsRNA from three independent experiments using at least three protein batches was quantified and expressed as relative units (RUs). Averages are shown as bar graphs below each gel, and error bars represent standard deviations from the means. A single asterisk indicates a P value of <0.05, and two asterisks indicate a P value of <0.005.
FIG 11
FIG 11
Amino acid differences between SA11 (C5) VP2 and PO-13 (C4) VP2. A primary amino acid sequence alignment of SA11 (C5) VP2 and PO-13 (C4) VP2 is shown. Dashes indicate gaps in the protein sequence, and colored shading represents variation in amino acid identity. The VP2 domains and subdomains are represented by a line above the sequence and are colored as in Fig. 1D. The VP1-VP2 interaction site predicted by Estrozi et al. (EC) is outlined with a box. Amino acid positions are indicated above the alignment.
FIG 12
FIG 12
In vitro dsRNA synthesis by chimeric rVP2 proteins. (A) Linear schematics of recombinant VP2 proteins shown as boxes. For all genes, the SA11 sequence is shown in gray, and the PO-13 sequence is shown in black. Amino acid numbers are listed above the schematic, and general locations of mutated regions are shown. (B) Approximately 8 pmol purified PO-13 (C4) rVP2, SA:PO rVP2, or PO:SA rVP2 was electrophoresed in a 4 to 15% SDS-polyacrylamide gel and visualized by Coomassie blue staining. Molecular masses (in kilodaltons) are shown to the left. (C and D) Radiolabeled dsRNA was synthesized by 2 pmol of either SA11 (R2) rVP1 (C) or PO-13 (R4) rVP1 (D) in the presence of 8 pmol of each rVP2 protein. All reaction mixtures contained 16 pmol of an RVA +RNA template and were incubated at 37°C for 180 min. Radiolabeled dsRNA products were resolved on 4 to 15% SDS-polyacrylamide gels and visualized using a phosphorimager. Radiolabeled dsRNA from three independent experiments using at least two protein batches was quantified and expressed as relative units (RUs). Averages are shown as bar graphs below each gel, and error bars represent standard deviations from the means. Double asterisks indicate P values of <0.005.

Similar articles

Cited by

References

    1. Estes MK, Kapikian AZ. 2006. Rotaviruses and their replication, p 1917–1974 In Knipe DM, Howley PM, Griffin DE, Lamb RA, Martin MA, Roizman B, Straus SE (ed), Fields virology, 5th ed Lippincott Williams & Wilkins, Philadelphia, PA.
    1. Matthijnssens J, Otto PH, Ciarlet M, Desselberger U, Van Ranst M, Johne R. 2012. VP6-sequence-based cutoff values as a criterion for rotavirus species demarcation. Arch Virol 157:1177–1182. doi:10.1007/s00705-012-1273-3. - DOI - PubMed
    1. Mihalov-Kovács E, Gellért Á, Marton S, Farkas SL, Fehér E, Oldal M, Jakab F, Martella V, Bányai K. 2015. Candidate new rotavirus species in sheltered dogs, Hungary. Emerg Infect Dis 21:660–663. doi:10.3201/eid2104.141370. - DOI - PMC - PubMed
    1. Banyai K, Kemenesi G, Budinski I, Foldes F, Zana B, Marton S, Varga-Kugler R, Oldal M, Kurucz K, Jakab F. 2017. Candidate new rotavirus species in Schreiber’s bats, Serbia. Infect Genet Evol 48:19–26. doi:10.1016/j.meegid.2016.12.002. - DOI - PMC - PubMed
    1. Tate JE, Burton AH, Boschi-Pinto C, Parashar UD, World Health Organization-Coordinated Global Rotavirus Surveillance Network . 2016. Global, regional, and national estimates of rotavirus mortality in children <5 years of age, 2000-2013. Clin Infect Dis 62:S96–S105. doi:10.1093/cid/civ1013. - DOI - PMC - PubMed

Publication types

Associated data

LinkOut - more resources