. 2018 Oct 24;8(10):180147.
doi: 10.1098/rsob.180147.

Suitability of hepatocyte cell lines HepG2, AML12 and THLE-2 for investigation of insulin signalling and hepatokine gene expression

Affiliations

Suitability of hepatocyte cell lines HepG2, AML12 and THLE-2 for investigation of insulin signalling and hepatokine gene expression

Stephanie Sefried et al. Open Biol. .

Abstract

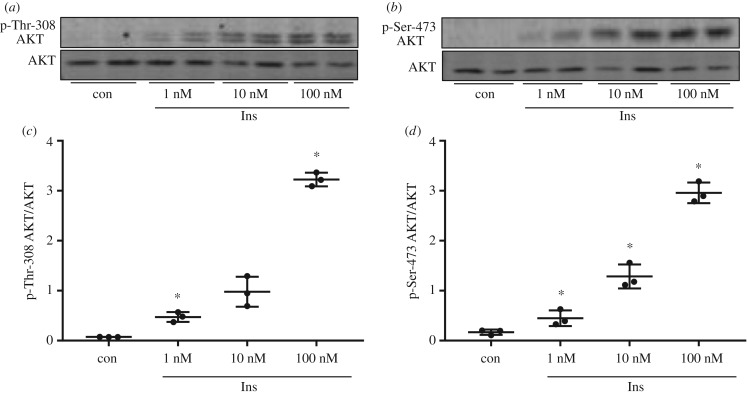
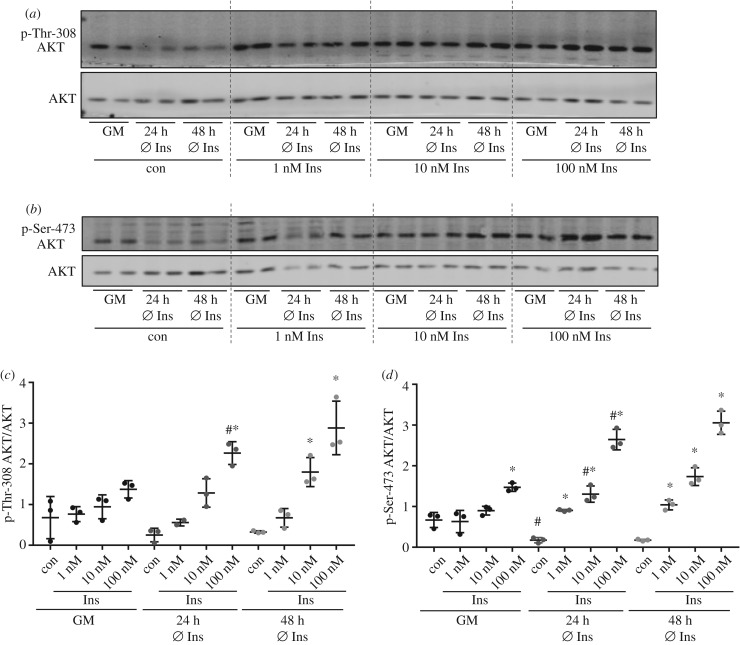
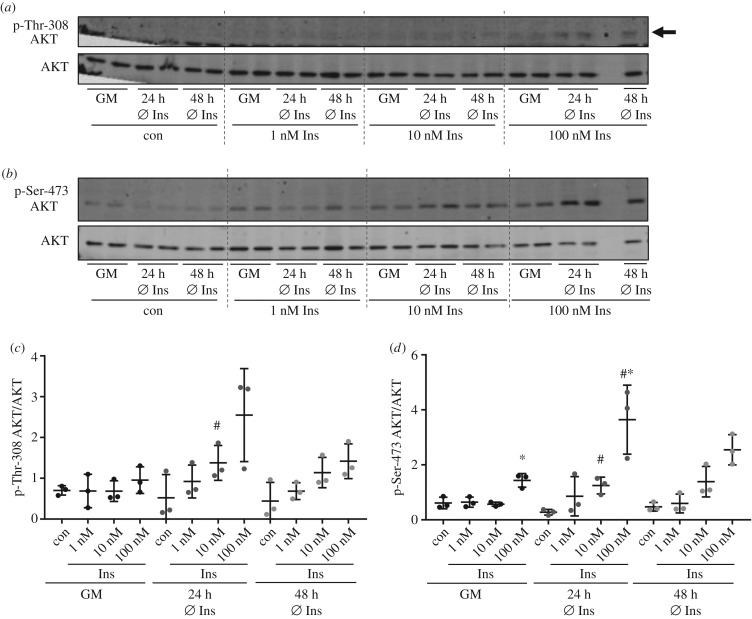
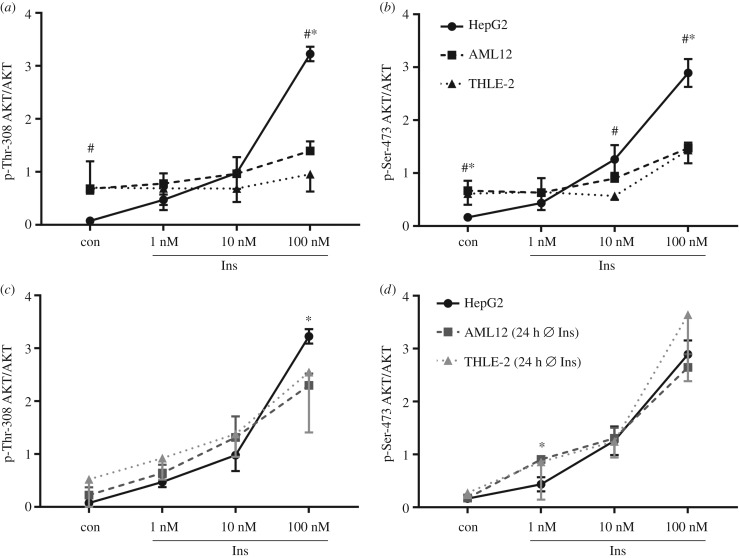
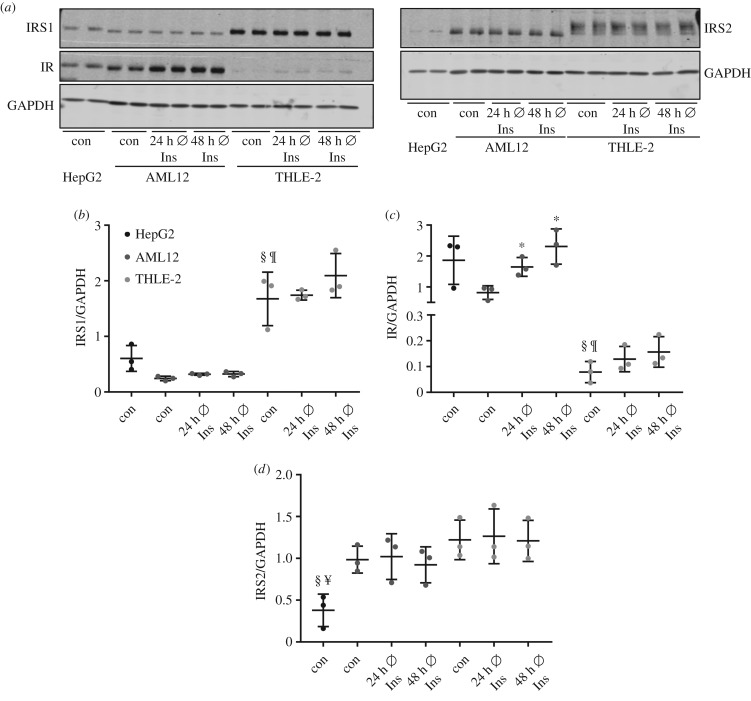
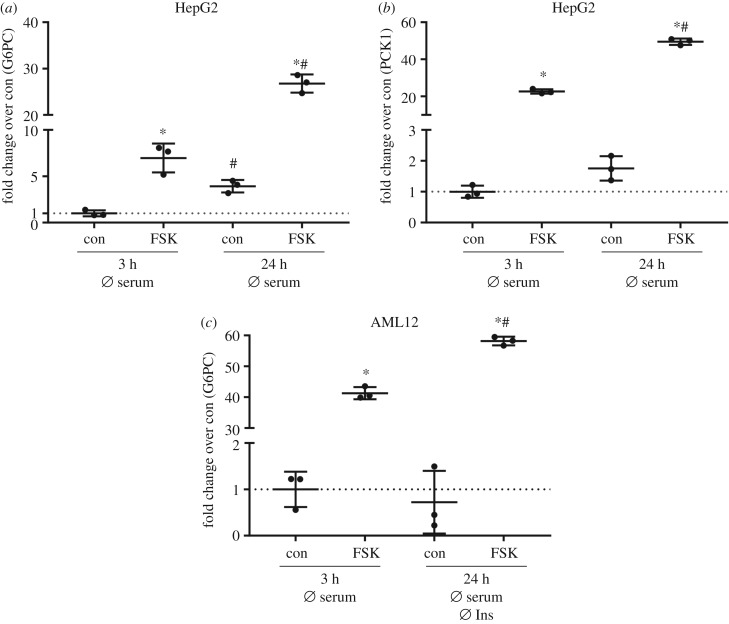
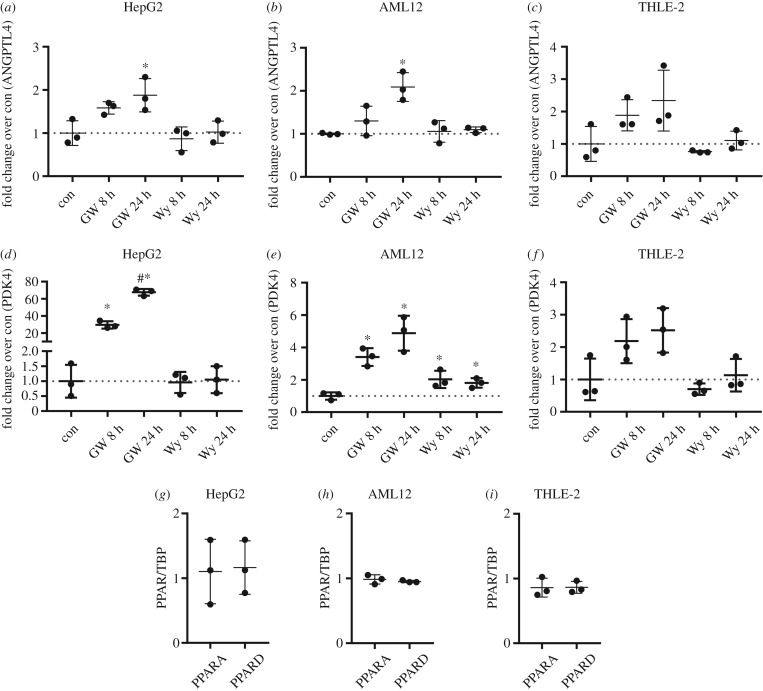
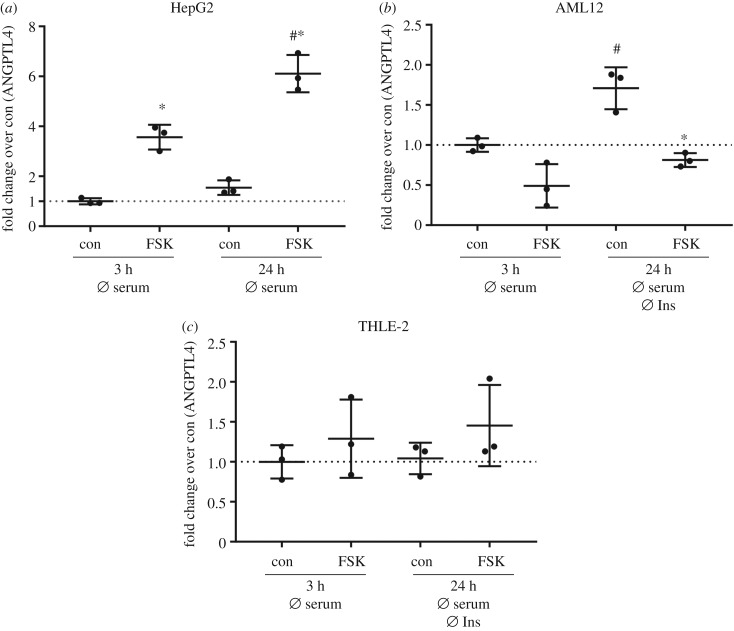
Immortal hepatocyte cell lines are widely used to elucidate insulin-dependent signalling pathways and regulation of hepatic metabolism, although the often tumorigenic origin might not represent the metabolic state of healthy hepatocytes. We aimed to investigate if murine cell line AML12 and human cell line THLE-2, which are derived from healthy liver cells, are comparable to hepatoma cell line HepG2 for studying acute insulin signalling and expression of gluconeogenic enzymes and hepatokines. Insulin responsiveness of AML12 and THLE-2 cells was impaired when cells were cultured in the recommended growth medium, but comparable with HepG2 cells by using insulin-deficient medium. THLE-2 cells showed low abundance of insulin receptor, while protein levels in HepG2 and AML12 were comparable. AML12 and THLE-2 cells showed only low or non-detectable transcript levels of G6PC and PCK1 Expression of ANGPTL4 was regulated similarly in HepG2 and AML12 cells upon peroxisome proliferator-activated receptor δ activation but only HepG2 cells resemble the in vivo regulation of hepatic ANGPTL4 by cAMP. Composition of the culture medium and protein expression levels of key signalling proteins should be considered when AML12 and THLE-2 are used to study insulin signalling. With regard to gluconeogenesis and hepatokine expression, HepG2 cells appear to be closer to the in vivo situation despite the tumorigenic origin.

Keywords: cells; hepatocyte; insulin; signalling.


Conflict of interest statement

We have no competing interests.

Figures

Figure 1.
Figure 1.
Insulin stimulation in HepG2 cells. (a,b) HepG2 cells were cultured without serum for 3 h before stimulation with 1, 10 and 100 nM insulin (Ins) for 10 min. 20 µg protein was analysed by western blot for the presence of p-Thr-308/p-Ser-473 of AKT and AKT protein. (c,d) Band intensities of phosphorylated AKT were normalized for AKT protein content (n = 3; mean ± s.d.; *p < 0.05, control (con) versus 1 nM, 1 versus 10 nM, 10 versus 100 nM).
Figure 2.
Figure 2.
Insulin stimulation in AML12 cells. AML12 cells were either grown in normal growth medium (GM) with all supplements or cultured for 24 or 48 h without the supplementation of insulin in the culture medium. Cells were serum starved for 3 h before stimulation with 1, 10 or 100 nM insulin for 10 min. (a,b) Western blot analysis with 20 µg of total protein was performed to detect p-Thr-308/p-Ser-473 of AKT and AKT. (c,d) Band intensities of phosphorylated AKT were normalized for AKT protein content (n = 3; mean ± s.d.; *p < 0.05, con versus 1 nM, 1 versus 10 nM, 10 versus 100 nM; #p < 0.05, GM versus 24 h Ø Ins con or at respective insulin concentration). Dashed lines separate samples with different insulin concentration.
Figure 3.
Figure 3.
Insulin stimulation in THLE-2 cells. THLE-2 cells were either grown in normal growth medium (GM) with all necessary supplements or cultured for 24 or 48 h without the supplementation of insulin in the culture medium. All cells were serum starved for 3 h before stimulation with 1, 10 or 100 nM insulin for 10 min. (a,b) Western blot analysis with 20 µg of total protein was performed to detect p-Thr-308/p-Ser-473 of AKT and AKT. Arrow indicates p-Thr-308. No sample was loaded in the penultimate lane. (c,d) Band intensities of phosphorylated AKT were normalized for AKT protein content (n = 3; mean ± s.d.; *p < 0.05, 10 versus 100 nM; #p < 0.05, GM versus 24 h Ø Ins at respective insulin concentration). Dashed lines separate samples with different insulin concentration.
Figure 4.
Figure 4.
Comparison of AKT phosphorylation between the different cell lines. Signal intensities of phosphorylated AKT normalized for AKT protein amount as shown in figures 1–3 were compared between the different cell lines. Identical data of HepG2 cells were included in (a,c) and (b,d). (a,b) Cells were grown in their respective growth medium as recommended. (c,d) HepG2 cells were grown in their growth medium whereas AML12 and THLE-2 cells were cultured for 24 h without additional insulin (n = 3; mean ± s.d.; *p < 0.05, HepG2 versus AML12; #p < 0.05, HepG2 versus THLE-2).
Figure 5.
Figure 5.
Protein abundance of IRS1, IRS2 and IR in HepG2, AML12 and THLE-2 cells. Cells were grown in their respective growth medium (con) or cultured for 24/48 h without additional insulin. (a) 15 µg protein was separated and checked by western blot for the presence of IRS1, IRS2 and IR. GAPDH was used as loading control. (bd) Band intensities were normalized for GAPDH (n = 3; mean ± s.d.; *p < 0.05, con versus 24/48 h Ø Ins in AML12 cells; §p < 0.05, con HepG2 versus con THLE-2; p < 0.05, con AML12 versus con THLE-2; ¥p < 0.05, con HepG2 versus con AML12).
Figure 6.
Figure 6.
Expression of gluconeogenic genes in HepG2 and AML12 cells. (a,b) HepG2 cells were deprived of serum for 3 h or for 24 h before stimulation with 20 µM forskolin (FSK) for 2 h. RNA isolation and cDNA synthesis followed qPCR to measure mRNA abundance of G6PC (a) and PCK1 (b). (c) AML12 cells were grown in normal growth medium and deprived of serum for 3 h before stimulation with 20 µM FSK for 2 h. A subset of cells was cultured in insulin-/serum-deficient medium as indicated before the stimulation with 20 µM FSK for 2 h. Expression of G6PC was measured with qPCR. (ac) Gene of interest was normalized to the housekeeper gene TBP and expression levels are shown as fold change over control (n = 3; mean ± s.d.; *p < 0.05, con versus FSK; #p < 0.05, con versus con or FSK versus FSK).
Figure 7.
Figure 7.
Expression levels of ANGPTL4, PDK4, PPARA and PPARD after stimulation with GW501516 or Wy-14643 in HepG2, AML12 and THLE-2 cells. Cells were cultured in their respective growth medium and stimulated with 1 µM GW501516 or 1 µM Wy-14643 for 8 or 24 h. Expression levels of ANGPTL4, PDK4, PPARA and PPARD were measured by qPCR. (af) Gene of interest was normalized for TBP and expression level is shown as fold changer over control (n = 3; mean ± s.d.; *p < 0.05, con versus 8 and 24 h GW501516 and Wy-14643; #p < 0.05, 8 h versus 24 h GW501516). (gi) Expression levels of PPARA and PPARD in the control sample was measured by qPCR and values are shown normalized for the housekeeper TBP (n = 3; mean ± s.d.).
Figure 8.
Figure 8.
ANGPTL4 expression in the investigated cell lines. (ac) All cell lines were cultured with growth medium deficient for either insulin or serum or both as indicated before stimulation with 20 µM forskolin (FSK) for 2 h. ANGPTL4 expression was measured by qPCR and normalized for housekeeper TBP. Expression level is shown as fold change over control (n = 3; mean ± s.d.; *p < 0.05, con versus FSK; #p < 0.05, con versus con or FSK versus FSK).

References

    1. Jung TW, Yoo HJ, Choi KM. 2016. Implication of hepatokines in metabolic disorders and cardiovascular diseases. BBA Clin. 5, 108–113. (10.1016/j.bbacli.2016.03.002) - DOI - PMC - PubMed
    1. Stefan N, Haring HU. 2013. The role of hepatokines in metabolism. Nat. Rev. Endocrinol. 9, 144–152. (10.1038/nrendo.2012.258) - DOI - PubMed
    1. Klingmuller U, et al. 2006. Primary mouse hepatocytes for systems biology approaches: a standardized in vitro system for modelling of signal transduction pathways. Syst. Biol. (Stevenage) 153, 433–447. (10.1049/ip-syb:20050067) - DOI - PubMed
    1. Shulman M, Nahmias Y. 2013. Long-term culture and coculture of primary rat and human hepatocytes. Methods Mol. Biol. 945, 287–302. (10.1007/978-1-62703-125-7_17) - DOI - PMC - PubMed
    1. Castell JV, Jover R, Martinez-Jimenez CP, Gomez-Lechon MJ. 2006. Hepatocyte cell lines: their use, scope and limitations in drug metabolism studies. Expert Opin. Drug Metab. Toxicol. 2, 183–212. (10.1517/17425255.2.2.183) - DOI - PubMed

Publication types