. 2018 Oct 24;10(464):eaao4755.
doi: 10.1126/scitranslmed.aao4755.

Antibiotics induce sustained dysregulation of intestinal T cell immunity by perturbing macrophage homeostasis

Affiliations

Antibiotics induce sustained dysregulation of intestinal T cell immunity by perturbing macrophage homeostasis

Nicholas A Scott et al. Sci Transl Med. .

Abstract

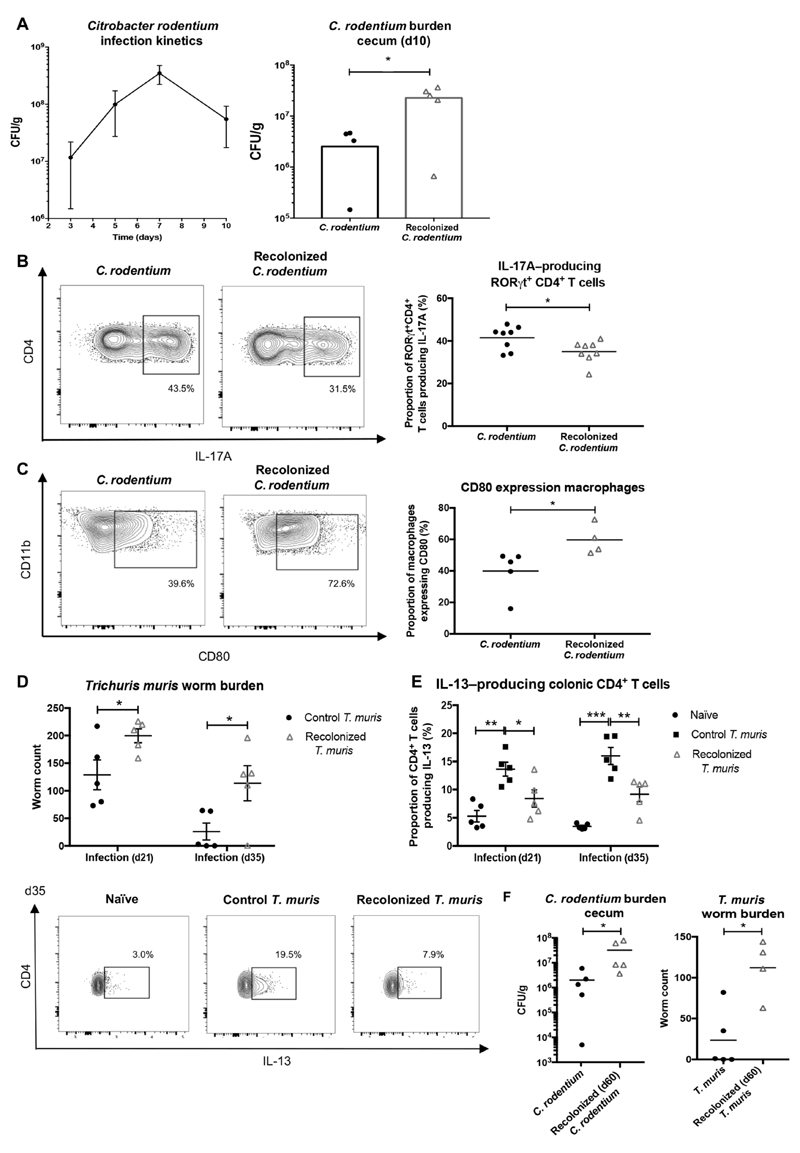
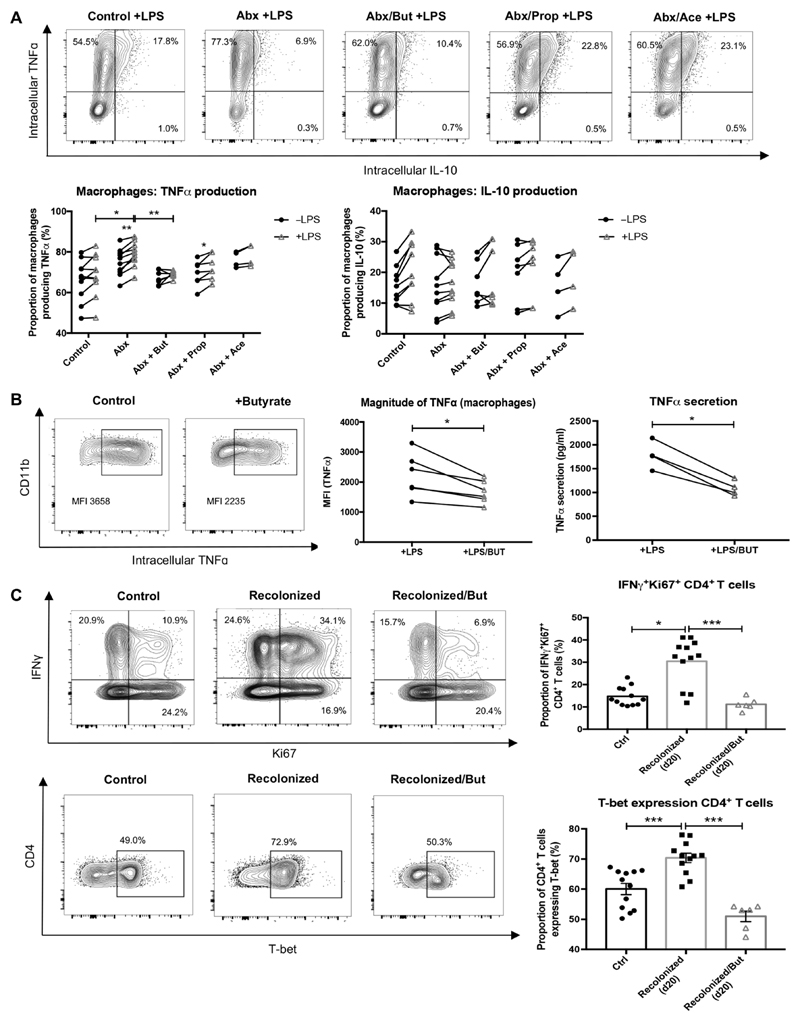
Macrophages in the healthy intestine are highly specialized and usually respond to the gut microbiota without provoking an inflammatory response. A breakdown in this tolerance leads to inflammatory bowel disease (IBD), but the mechanisms by which intestinal macrophages normally become conditioned to promote microbial tolerance are unclear. Strong epidemiological evidence linking disruption of the gut microbiota by antibiotic use early in life to IBD indicates an important role for the gut microbiota in modulating intestinal immunity. Here, we show that antibiotic use causes intestinal macrophages to become hyperresponsive to bacterial stimulation, producing excess inflammatory cytokines. Re-exposure of antibiotic-treated mice to conventional microbiota induced a long-term, macrophage-dependent increase in inflammatory T helper 1 (TH1) responses in the colon and sustained dysbiosis. The consequences of this dysregulated macrophage activity for T cell function were demonstrated by increased susceptibility to infections requiring TH17 and TH2 responses for clearance (bacterial Citrobacter rodentium and helminth Trichuris muris infections), corresponding with increased inflammation. Short-chain fatty acids (SCFAs) were depleted during antibiotic administration; supplementation of antibiotics with the SCFA butyrate restored the characteristic hyporesponsiveness of intestinal macrophages and prevented T cell dysfunction. Butyrate altered the metabolic behavior of macrophages to increase oxidative phosphorylation and also promoted alternative macrophage activation. In summary, the gut microbiota is essential to maintain macrophage-dependent intestinal immune homeostasis, mediated by SCFA-dependent pathways. Oral antibiotics disrupt this process to promote sustained T cell-mediated dysfunction and increased susceptibility to infections, highlighting important implications of repeated broad-spectrum antibiotic use.


Figures

Fig. 1
Fig. 1. Recolonization of antibiotic-treated mice induces infiltration of innate inflammatory cells, followed by sustained TH1 responses.
(A) Colonic monocytes (CD11b+Ly6C+SiglecFLy6G), eosinophils (SiglecF+MHC class IILy6C), and neutrophils (SiglecFMHC class IILy6G+Ly6C) were identified from live CD45+ cells by flow cytometry in mice that had been recolonized with microbiota from WT mice for 7 days (7d) after 7 days of antibiotic treatment. Pooled data are shown [*P < 0.05, **P < 0.01, ***P < 0.001, Kruskal-Wallis test; n = 15 to 17 (control; Ctrl), n = 9 (antibiotics; Abx), n = 6 to 8 (recolonized)]. (B) Proportions of monocytes, neutrophils, and eosinophils after antibiotic treatment and subsequent recolonization at time points up to 23 days of recolonization after antibiotic treatment (*P < 0.05, **P < 0.01, ***P < 0.001, Kruskal-Wallis test; n ≥ 3 for all time points). (C) Proportions and numbers of CD3+CD4+ T cells and IFNγ production by CD3+CD4+ T cells in control versus recolonized mice were determined by flow cytometry, with representative flow cytometry plots [from day 13 (d13) of recolonization] and pooled data at time points shown (*P < 0.05, **P < 0.01, Kruskal-Wallis test; n ≥ 3 for all time points). (D) Ki67 expression by IFNγ-producing CD3+CD4+ T cells and T-bet expression by CD3+CD4+ T cells at day 20 of recolonization (**P < 0.01, ***P <0.001, unpaired Mann-Whitney test; n = 9 to 12). (E) Analysis of CD3+CD4+ T cells producing IFNγ or expressing T-bet in mice that had been recolonized for 20 or 60 days after the end of antibiotic treatment. Data at each time point were compared to age-matched controls set up in parallel (*P < 0.05, ***P < 0.001, unpaired Mann-Whitney test; n = 7 to 20 per time point). All data represent at least two independent experiments.
Fig. 2
Fig. 2. CCR2+ monocyte-macrophages are essential for enhanced TH1 responses after antibiotic treatment and recolonization.
(A) Live CD45+SiglecFLy6GCD11b+ CD64+ colonic LP cells were analyzed by flow cytometry, and monocytes (Ly6C+MHC class II), intermediates (Ly6C+ MHC class II+), and macrophages (Ly6CMHC class II+) were identified in mice that had been recolonized for 7 days after antibiotic treatment. Representative flow cytometry plots and pooled data (numbers) are depicted (**P < 0.01, unpaired Mann-Whitney test; n = 8 to 10). (B) Ly6C+MHC class II monocytes, Ly6C+MHC class II+ intermediates, and Ly6CMHC class II+ macrophages were sorted by flow cytometry, and mRNA expression for il6, il12p35, TNFα, il1β, nos2, and cd206 was analyzed by quantitative real-time polymerase chain reaction (qRT-PCR). Results are shown as mean expression normalized to TATA binding protein and are shown relative to mean of control mice in all cases (*P < 0.05, **P < 0.01, unpaired Mann-Whitney tests; n = 4 to 9). NOS2, nitric oxide synthase 2. (C) Expression of Tim4 and CD4 by colonic Ly6CMHC class II+-differentiated macrophages of control or recolonized (day 7) mice was analyzed by flow cytometry, with representative flow cytometry plots and pooled data depicted (*P < 0.05, ***P < 0.001, unpaired Mann-Whitney tests; n = 9). (D) Ly6CMHC class II+ macrophages from Ccr2−/− mice were sorted by flow cytometry, and mRNA expression for il6, il12p35, TNFα, il1β, and cd206 was analyzed by qRT-PCR. Results are shown as mean expression normalized to TATA binding protein and shown relative to mean of Ccr2–/– control mice in all cases (unpaired Mann-Whitney tests; n = 4). (E) Eosinophils (SiglecF+ MHC class IILy6C) and neutrophils (SiglecFMHC class IILy6G+Ly6C) were identified from live CD45+ cells by flow cytometry in Ccr2−/− mice that had been recolonized for 7 days after antibiotic treatment. Pooled data are depicted (*P < 0.05, unpaired Mann-Whitney test; n = 4). (F) Production of IFNγ and IL-17A and expression of Ki67, T-bet, and FoxP3 by CD3+CD4+ cells from the colonic LP of control or recolonized (day 20) Ccr2−/− mice were analyzed by flow cytometry, with pooled data depicted (**P < 0.01, ***P < 0.001, unpaired Mann-Whitney tests; n = 5 to 18). WT mice (control and recolonized) are also shown as a reference. All data shown are representative of at least two independent experiments.
Fig. 3
Fig. 3. Antibiotic treatment induces a dysregulated cytokine response to LPS in intestinal monocytes and macrophages.
Live CD45+SiglecFLy6GCD11b+CD64+ colonic LP cells from control and antibiotic-treated mice (7 days) were further subdivided into (A) Ly6Chi (monocytes and intermediates) and (B) Ly6CMHC class II+ cells (mature macrophages). Response to in vitro LPS (1 μg/ml) stimulation was assessed by measuring intracellular IL-10 and TNFα production by flow cytometry. Representative flow cytometry plots and pooled data (proportions of cytokine-producing cells) are depicted (*P < 0.05, **P < 0.01, ***P < 0.001, paired and unpaired Mann-Whitney tests; n = 8 to 10). (C) Pooled data depicting TNFα protein production by mature macrophages from control and antibiotic-treated mice, as assessed by mean fluorescence intensity (MFI; *P < 0.05, unpaired Mann-Whitney test; n = 4). (D) FACS-sorted colonic macrophages (live CD45+SiglecFLy6GCD11b+CD64+Ly6CMHC class II+ cells) were cultured for 18 hours with LPS (100 ng/ml), and secreted protein was measured in supernatants by cytometric bead array (*P < 0.05, unpaired Mann-Whitney test; n = 5). Data in (C) are representative of one of three individual experiments with similar results. All other data are representative of at least two independent experiments.
Fig. 4
Fig. 4. Sustained immune dysfunction in recolonized mice repolarizes immune responses to infection.
(A) Mice were treated with antibiotics and subsequently recolonized for 20 days before infection with C. rodentium, alongside nonantibiotic-treated mice (controls). CFU were grown overnight from fecal pellets harvested during infection for assessment of kinetics and from cecal homogenates 10 days after infection (*P < 0.05, nonpaired Mann-Whitney test; data shown as n = 5 but representative of two individual experiments with similar results). (B) Live CD45+CD3+CD4+ colonic T cells were identified by flow cytometry from control and recolonized mice infected with C. rodentium and characterized for expression of RORγt and for production of IL-17A. Pooled data are depicted (*P < 0.05, nonpaired Mann-Whitney test; n = 8). (C) Mature macrophages were identified from colonic LP cells as live CD45+SiglecFLy6GCD11b+ CD64+Ly6CMHC class II+ cells, and surface expression of CD80 was characterized by flow cytometry. Representative flow cytometry plots and pooled data are depicted (*P < 0.05, unpaired Mann-Whitney test; n = 5). (D) Mice were treated with antibiotics and subsequently recolonized for 20 days before infection with the intestinal helminth T. muris, alongside nonantibiotic-treated mice. Ceca and proximal colons were harvested at day 21 or day 35 after T. muris infection. Pooled data depict worm counts from the cecum of T. muris–infected control (nonantibiotic-treated) mice and from infected recolonized mice (*P < 0.05, nonpaired Mann-Whitney test; n = 5 at both time points). (E) Live CD45+CD3+CD4+ T cells from the proximal colon were identified by flow cytometry and characterized for production of IL-13. Representative flow cytometry plots and pooled data are depicted (*P < 0.05, **P < 0.01, ***P < 0.001, Kruskal-Wallis test; n = 5 at both time points). (F) Mice were treated with antibiotics and subsequently recolonized for 60 days before infection with either C. rodentium or T. muris, alongside nonantibiotic-treated control mice. For C. rodentium infections, 10 days after infection, tissue homogenates from the ceca were used to grow CFU overnight (*P < 0.05, unpaired Mann-Whitney test; n = 5). For T. muris infections, ceca were harvested at day 21 or day 35 after T. muris infection, and worms were counted (*P < 0.05, unpaired Mann-Whitney test; n = 5). Data shown in all experiments are representative of at least two individual experiments.
Fig. 5
Fig. 5. Recolonization of antibiotic-treated mice causes long-term disruption of the intestinal microbiota and a reduction in SCFAs in the intestine.
(A) Principal component analysis using Bray-Curtis metrics performed on the basis of the taxonomic assignments obtained from the 16S rRNA gene sequencing libraries analyzed from colonic stool samples of recolonized mice (red, A samples) at days 13, 20, and 30 and 60 days after antibiotic treatment and age-matched controls (dark blue, C samples). Results are shown as three mice per group. (B) Bar charts represent the relative abundance of the bacterial taxa. Bar colors represent different genus taxa, and bar heights signify the relative abundance of each taxon in colonic stool samples from control and recolonized mice (days 13, 20, 30, and 60). (C) Pooled data depicting ratios of phyla Bacteroidetes/Firmicutes in colonic stool samples from control and recolonized mice and number of reads from Allobaculum genus as a proportion of total number of reads per sample, in control and recolonized mice (n = 3). *P < 0.05, **P < 0.01, ***P < 0.001. (D) Metabolite analysis was carried out via NMR on colonic fecal samples from control and recolonized mice and was normalized to fecal weight to determine absolute levels of SCFAs in the intestine. Pooled data depicting heatmaps made from Z-scores (relative) and summary graphs representing normalized amounts of SCFAs are shown [*P < 0.05, ***P < 0.001, Kruskal-Wallis test; n = 16 (controls) and n = 4 (recolonized)].
Fig. 6
Fig. 6. Butyrate causes metabolic reprogramming of intestinal macrophages.
(A) RNA-seq results were generated from FACS-sorted mature colonic macrophages (live CD45+SiglecFLy6GCD11b+ CD64+Ly6CMHC class II+ cells) from control mice or mice that had been treated with antibiotics (±200 mM butyrate) before recolonization (7 days). Main heatmap is shown depicting relative gene expression (Z-scores) from individual samples, showing all differentially expressed genes. Individual heatmaps show the gene expression profiles of genes involved in histone/chromatin modification and alternative activation as identified by pathway [Kyoto Encyclopedia of Genes and Genomes (KEGG)] analysis. (B) Bone marrow–derived macrophages were conditioned with SCFAs during development and mRNA for arg1 was analyzed by qRT-PCR. Results are shown as mean expression normalized to TATA binding protein and shown relative to mean of the control group in all cases (*P < 0.05, Kruskal-Wallis test; n = 4). (C) Heatmaps showing gene expression profiles of genes involved in OXPHOS and lipid metabolism as identified by pathway (KEGG) analysis, after RNA-seq of colonic macrophages from control mice or mice recolonized after antibiotic treatment ± 200 mM butyrate. (D) Oxygen consumption rate (OCR) of bone marrow–derived macrophages conditioned with SCFAs (1 mM) during development, shown at baseline and after sequential treatment with oligomycin (Oligo), FCCP, etomoxir (Eto), and rotenone plus antimycin (R + A). Results were normalized to cellular protein levels. (E) OCR of macrophages after FCCP administration (mitochondrial stress). Results were normalized to protein levels (*P < 0.05, **P < 0.01, Kruskal-Wallis test; n = 4). Lipid metabolism is shown as the fold change (reduction) in OCR in macrophages after etomoxir administration, indicating measures of reliance on fatty acid oxidation (**P < 0.01, Kruskal-Wallis test; n = 4). All data shown are representative of at least two independent experiments. All metabolic assays were performed in quadruplet per data point.
Fig. 7
Fig. 7. The SCFA butyrate prevents antibiotic-associated immune dysfunction.
(A) Live CD45+ SiglecF Ly6GCD11b+ CD64+Ly6CMHC class II+ mature colonic macrophages were characterized from control mice, antibiotic-treated mice, and mice treated with antibiotics that had been supplemented with butyrate (But), propionate (Prop), or acetate (Ace) for 7 days (200 mM each). After in vitro stimulation with LPS (1 μg/ml), intracellular IL-10 and TNFα production were assessed by flow cytometry. Representative flow cytometry plots and pooled data (proportions of cytokine-producing cells) are depicted [*P < 0.05, **P < 0.01, paired Mann-Whitney test and Kruskal-Wallis test; n = 10 (control and antibiotics), n = 7 (antibiotics + butyrate, antibiotics + propionate), and n = 4 (antibiotics + acetate)]. (B) Total colonic LP cells were stimulated in vitro with LPS (1 μg/ml) in the presence or absence of butyrate (1 mM), and mature colonic macrophages were identified by flow cytometry and assessed for intracellular TNFα production. Representative flow cytometry plots demonstrating intracellular TNFα protein (as assessed by MFI) and pooled data are depicted (*P < 0.05, paired Mann-Whitney test; n = 6). In other experiments, colonic mature macrophages were FACS-sorted and cultured in vitro with LPS (100 ng/ml) for 18 hours, and TNFα secretion into surrounding supernatant was assessed by cytometric bead array (*P < 0.05, unpaired Mann-Whitney test; n = 4). (C) Live CD45+CD3+CD4+ colonic T cells were characterized from control mice and mice that had been recolonized for 20 days after antibiotic treatment. In one group, antibiotics were supplemented with butyrate (200 mM). CD3+CD4+ T cell production of IFNγ and expression of Ki67 and T-bet were determined by flow cytometry. Representative flow cytometry plots and pooled data are depicted [*P < 0.05, ***P <0.001, Kruskal-Wallis test; n = 12 (control and recolonized) and n = 6 (butyrate)]. All data shown are representative of at least two independent experiments.

Comment in

Similar articles

Cited by

References

    1. Bain CC, Mowat AM. Macrophages in intestinal homeostasis and inflammation. Immunol Rev. 2014;260:102–117. - PMC - PubMed
    1. Denning TL, Wang Y-C, Patel SR, Williams IR, Pulendran B. Lamina propria macrophages and dendritic cells differentially induce regulatory and interleukin-17–producing T cell responses. Nat Immunol. 2007;8:1086–1094. - PubMed
    1. Franchi L, Kamada N, Nakamura Y, Burberry A, Kuffa P, Suzuki S, Shaw MH, Kim Y-G, Núñez G. NLRC-4 driven production of IL-β discriminates between pathogenic and commensal bacteria and promotes host intestinal defense. Nat Immunol. 2012;13:449–456. - PMC - PubMed
    1. Bain CC, Scott CL, Uronen-Hansson H, Gudjonsson S, Jansson O, Grip O, Guilliams M, Malissen B, Agace WW, Mowat AM. Resident and pro-inflammatory macrophages in the colon represent alternative context-dependent fates of the same Ly6Chi monocyte precursors. Mucosal Immunol. 2013;6:498–510. - PMC - PubMed
    1. Hadis U, Wahl B, Schulz O, Hardtke-Wolenski M, Schippers A, Wagner N, Müller W, Sparwasser T, Förster R, Pabst O. Intestinal tolerance requires gut homing and expansion of FoxP3+ regulatory T cells in the lamina propria. Immunity. 2011;34:237–246. - PubMed

Publication types

MeSH terms