. 2018 Oct 24;9(1):4420.
doi: 10.1038/s41467-018-06826-6.

The signalling conformation of the insulin receptor ectodomain

Affiliations

The signalling conformation of the insulin receptor ectodomain

Felix Weis et al. Nat Commun. .

Abstract

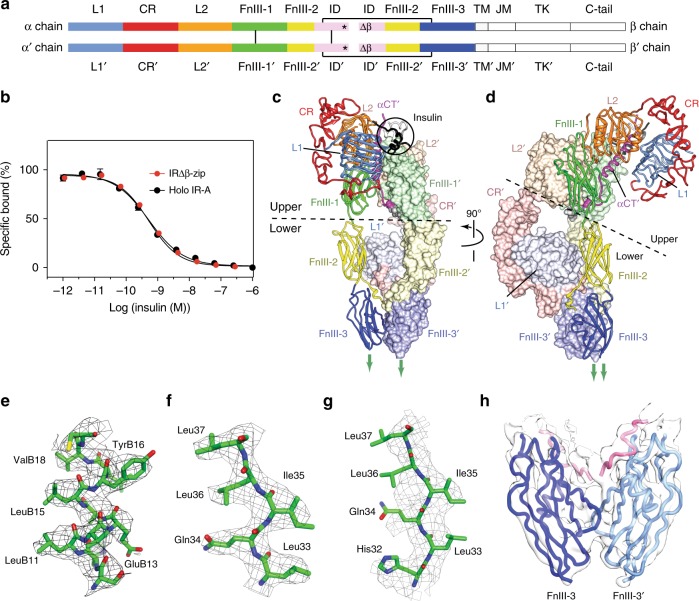
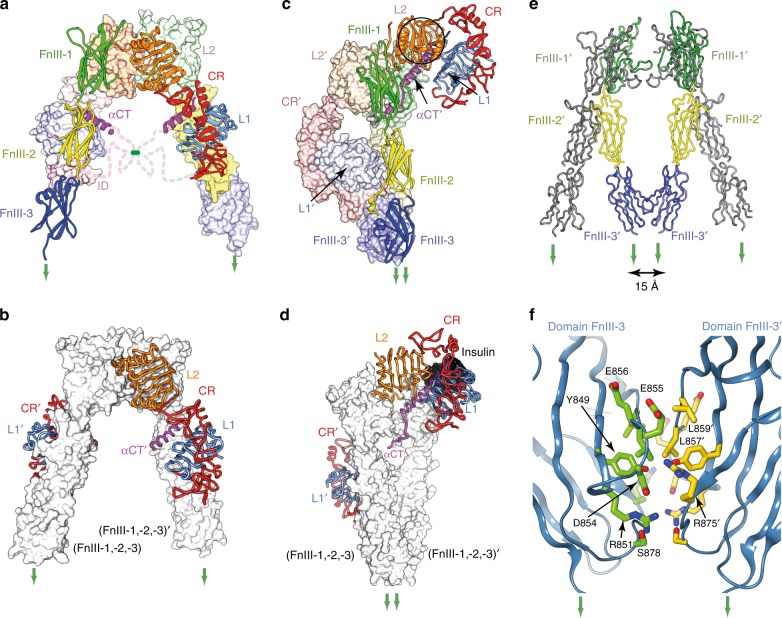
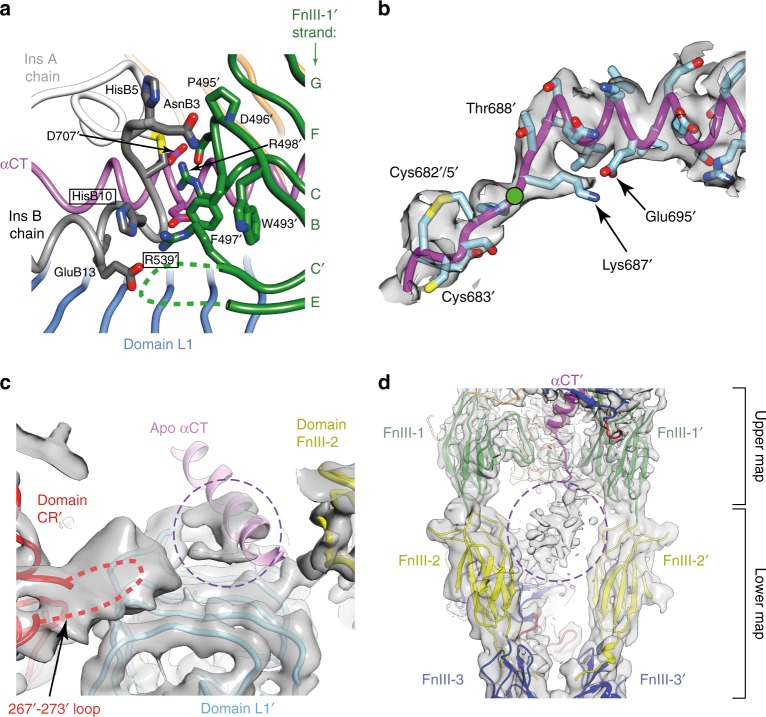
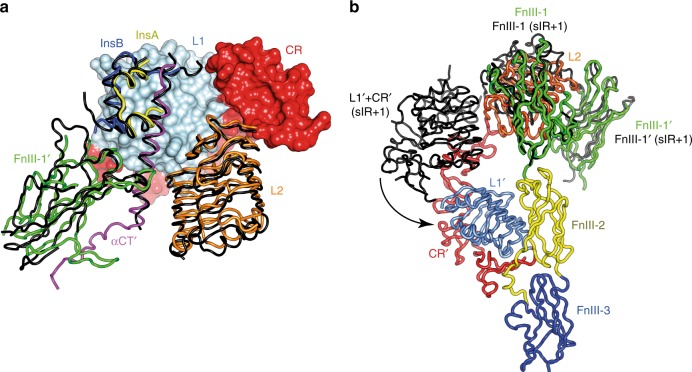
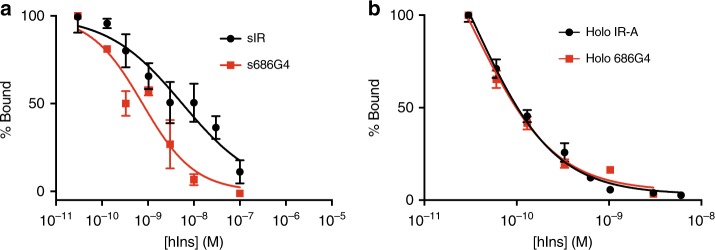
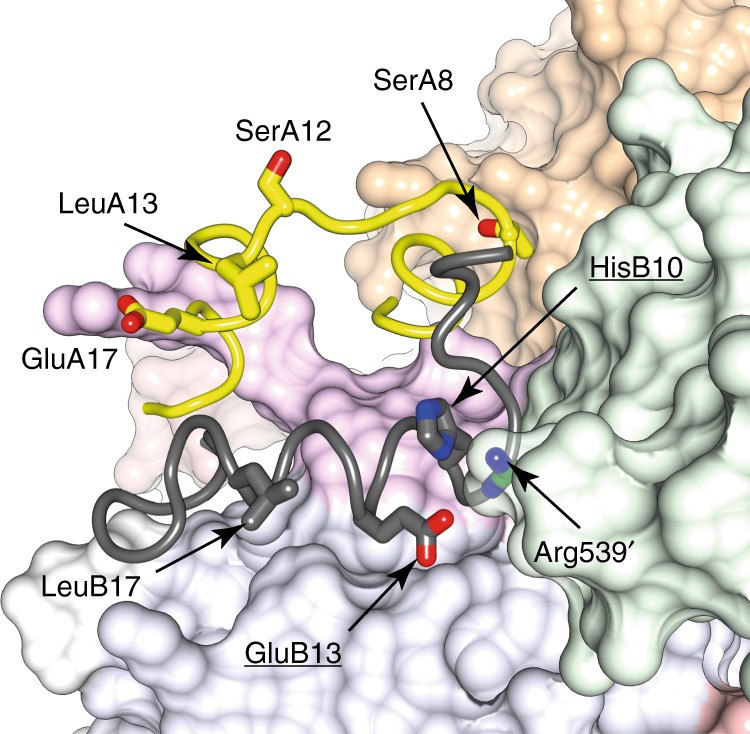
Understanding the structural biology of the insulin receptor and how it signals is of key importance in the development of insulin analogs to treat diabetes. We report here a cryo-electron microscopy structure of a single insulin bound to a physiologically relevant, high-affinity version of the receptor ectodomain, the latter generated through attachment of C-terminal leucine zipper elements to overcome the conformational flexibility associated with ectodomain truncation. The resolution of the cryo-electron microscopy maps is 3.2 Å in the insulin-binding region and 4.2 Å in the membrane-proximal region. The structure reveals how the membrane proximal domains of the receptor come together to effect signalling and how insulin's negative cooperativity of binding likely arises. Our structure further provides insight into the high affinity of certain super-mitogenic insulins. Together, these findings provide a new platform for insulin analog investigation and design.


Conflict of interest statement

Part of the research was conducted in M.C.L.’s laboratory with financial support from Sanofi (Germany). M.C.L. and J.G.M. are inventors on a number of patents related to the field of research. M.C.L.’s laboratory has a funded Agreement with Eli Lilly and Company to conduct research not connected to this publication. All other authors declare no competing interests.

Figures

Fig. 1
Fig. 1
Insulin receptor structural biology. a Receptor domain layout. L1 and L2: first and second leucine-rich repeat domains, CR: cysteine-rich domain, FnIII-1, -2 and -3: first-, second and third fibronectin Type-III domains, ID: insert domain, asterisk: α-chain C-terminal region (αCT), TM, JM: trans- and juxta-membrane domains, TK: tyrosine kinase domain, C-tail: β chain C-terminal segment. Black lines: inter-chain disulfide bonds; Δβː location of the glycosylated segment mutated/deleted in IRΔβ. Domains within the second αβ polypeptide are distinguished by a prime (′) symbol. b Competition-binding curve for insulin binding to IRΔβ-zip immuno-captured from conditioned cell-culture medium (IC50 = 0.55 ± 0.02 nM; n = 4 technical replicates) compared to that for hIR-A immuno-captured from solubilized cell membranes (IC50 = 0.46 ± 0.06 nM; n = 4 technical replicates). Error bars (s.e.m.) are smaller than marker size when absent. The logIC50 values are identical at the 95% degree of confidence based on an F test (P = 0.171; no. of degrees of freedom = 80). c, d Orthogonal views of cryoEM structure of IRΔβ-zipInsFv. Circle: location of insulin. Fv modules are not shown but are attached to the respective CR domains as in prior X-ray crystal structures, (see Supplementary Figure 4). eh Sharpened density derived from the focused maps, covering (respectively) segments of the insulin B chain, domain L1 (insulin-bound), domain L1′ (insulin-free), and the dimeric FnIII-3:FnIII-3′ assembly
Fig. 2
Fig. 2
Comparison of the cryo-EM structure of IRΔβ-zipInsFv with the crystal structure of apo IRΔβ. a Domain arrangement in apo IRΔβ (left) with domains colored as in Fig. 1a. b Apo IRΔβ but with only domains L1, CR, L2, L1′, CR′, and αCT′ shown in color (for comparison with panel (d)). c Domain arrangement in IRΔβ-zipInsFv with domains colored as in Fig. 1a. d IRΔβ-zipInsFv but with only domains L1, CR, L2, L1′, CR′, and αCT′ shown in color in order to highlight the rearrangement of the insulin-bound (L1-CR-L2) + αCT′ module with respect to apo IRΔβ (panel (b)). e Comparison of the relative disposition of domains FnIII and FnIII′ in apo IRΔβ (grey) and in IRΔβ-zipInsFv (colored). f Pseudo-two-fold-symmetric interaction of domains FnIII-3 and FnIII-3′ within IRΔβ-zipInsFv. For clarity, only one member of each pseudo-symmetry-related residue pair is labeled. Green arrows in all panels indicate the direction of membrane entry. Panel (a) is adapted from Fig. 1a of Xu et al.
Fig. 3
Fig. 3
Detail of the cryo-EM structure of IRΔβ-zipInsFv. a Interaction of insulin with FnIII-1′, showing in particular the interaction of IR Arg539′ with insulin HisB10 (boxed residue labels). The dashed green line represents the poorly ordered segment between residues Ser541′ and Ser545′. b N-terminal region of the αCT′ helix showing termination of the helix at Asp689′ and the formation of a possible salt bridge between Lys687′ and Glu695′, as well as a possible conformation for the Cys 682′:Cys683′:Cys685′ triplet. Density shown is from the upper map. The green circle indicates the effective location of the four-glycine insert in the 686G4 mutant receptor and receptor ectodomain (see main text). c Density extracted from the lower map in the vicinity of the insulin-free domain L1, showing the density feature on the central β sheet of the domain (circled) and the overhanging CR′ domain loop containing residues Lys267′ to Gly273′ (dashed red line). The relative location of the αCT helix in the crystal structure of apo IRΔβ is shown for reference and is not included in the atomic model of IRΔβ-zipInsFv. d Density features (circled) associated with the unmodelled and partially disordered segments of ID and ID′. Density shown is extracted from both the upper and lower maps (as indicated on the right of the panel)
Fig. 4
Fig. 4
Comparison of the cryo-EM structure of IRΔβ-zipInsFv with the insulin-complexed cryo-EM structures sIR + 2 and sIR + 17. a Schematic illustrating the similar environments of insulin, based on an overlay of the common L1-CR modules of IRΔβ-zipInsFv and sIR + 2 (shown as surface for IRΔβ-zipInsFv and omitted for sIR + 2). Remaining domains are shown as colored coil for IRΔβ-zipInsFv and black coil for sIR + 2. b Schematic illustrating the altered disposition of the respective unliganded L1-CR modules in IRΔβ-zipInsFv and in sIR + 1. Overlay is based on common FnIII-1/FnIII-1′ modules. Domains are shown as colored coil for IRΔβ-zipInsFv and black coil for sIR + 1
Fig. 5
Fig. 5
Insulin competition-binding assays for 686G4 IR mutants. a Insulin competition-binding assay of sIR (IC50 = 5.6 ± 1.7 nM; n = 4 technical replicates per concentration point) and s686G4 (IC50 = 0.76 ± 0.16 nM; n = 4 technical replicates per concentration point). The IC50 values differ at the 95% level of confidence based on an F test (P < 0.0001; no. of degrees of freedom = 54; two individual measurements of sIR affinity were judged as systematically in error and omitted from the analysis). b Insulin competition-binding assay of hIR-A (IC50 = 52 ± 10 pM; n = 4 technical replicates per data point) and holo 686G4 (IC50 = 30 ± 6 pM; n = 10 technical replicates per data point). The IC50 values are the same at the 95% level of confidence based on an F test (P = 0.084; no. of degrees of freedom = 86). In both (a) and (b), error bars reflect s.e.m. and are not shown when smaller than marker size
Fig. 6
Fig. 6
Disposition of insulin residues deemed to bind the second site on the receptor surface. Insulin is shown in ribbon representation (A chain: yellow; B chain: gray) and the surrounding receptor domains in molecular surface representation (L1: light blue; CR: light pink, L2: light orange; FnIII-1′: light green; αCT′: light magenta; N-linked glycan on domain L1: white). Insulin residues in stick representation are judged on the basis of alanine scanning mutagenesis, to be involved in insulin’s interaction with its secondary binding site on the receptor surface. Of these, only His B10 and GluB13 (underlined labels) interact here with the receptor. Also shown is receptor residue Arg539′ that likely interacts with the carboxylate side chain present at position B10 in Asp/GluB10 mutant insulins (see Results for further discussion)

References

    1. De Meyts P. Insulin/receptor binding: the last piece of the puzzle?: What recent progress on the structure of the insulin/ receptor complex tells us (or not) about negative cooperativity and activation. Bioessays. 2015;37:389–397. doi: 10.1002/bies.201400190. - DOI - PubMed
    1. Schäffer L. A model for insulin binding to the insulin receptor. Eur. J. Biochem. 1994;221:1127–1132. doi: 10.1111/j.1432-1033.1994.tb18833.x. - DOI - PubMed
    1. Markussen J, Halstrøm J, Wiberg FC, Schäffer L. Immobilized insulin for high capacity affinity chromatography of insulin receptors. J. Biol. Chem. 1991;266:18814–18818. - PubMed
    1. De Meyts P, et al. Insulin interactions with its receptors: experimental evidence for negative cooperativity. Biochem. Biophys. Res. Commun. 1973;55:154–161. doi: 10.1016/S0006-291X(73)80072-5. - DOI - PubMed
    1. McKern NM, et al. Structure of the insulin receptor ectodomain reveals a folded-over conformation. Nature. 2006;443:218–221. doi: 10.1038/nature05106. - DOI - PubMed

Publication types

Substances