

Measuring macromolecular size distributions and interactions at high concentrations by sedimentation velocity
- PMID: 30356043
- PMCID: PMC6200768
- DOI: 10.1038/s41467-018-06902-x
Measuring macromolecular size distributions and interactions at high concentrations by sedimentation velocity
Abstract
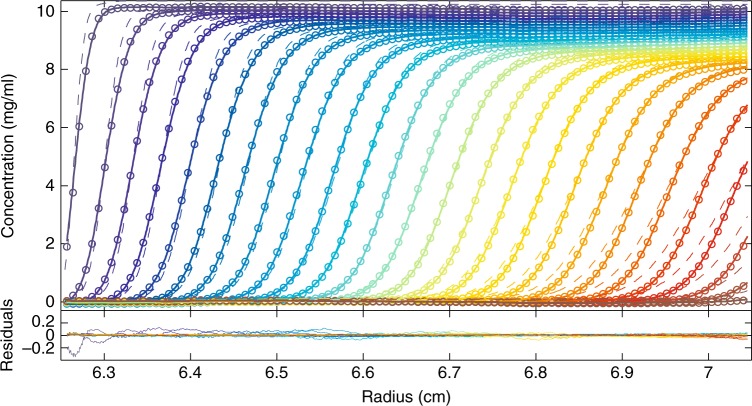
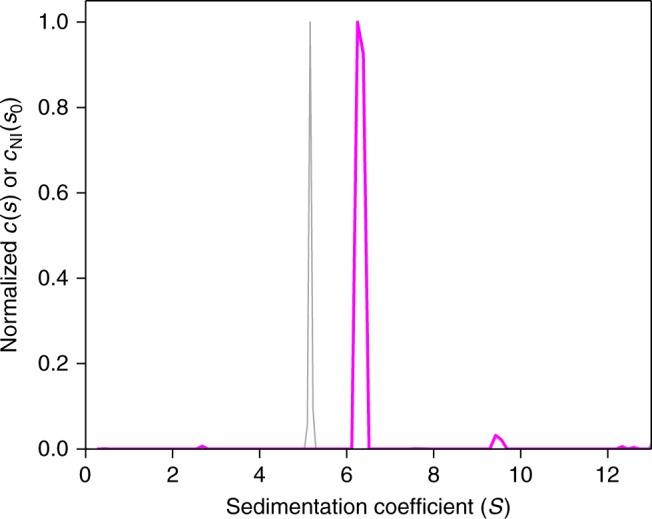
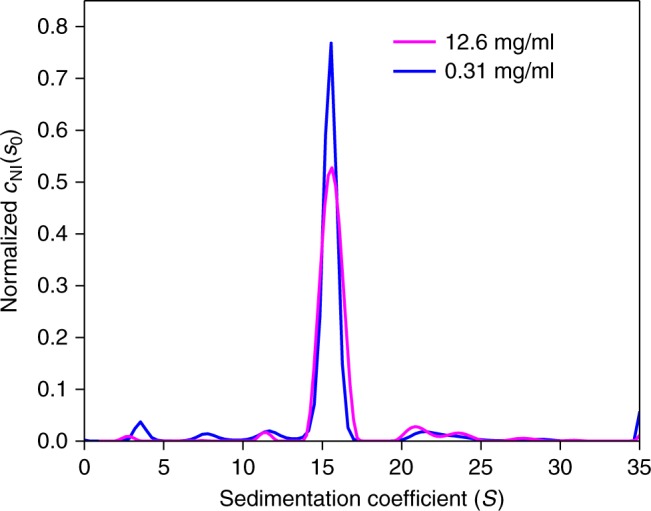
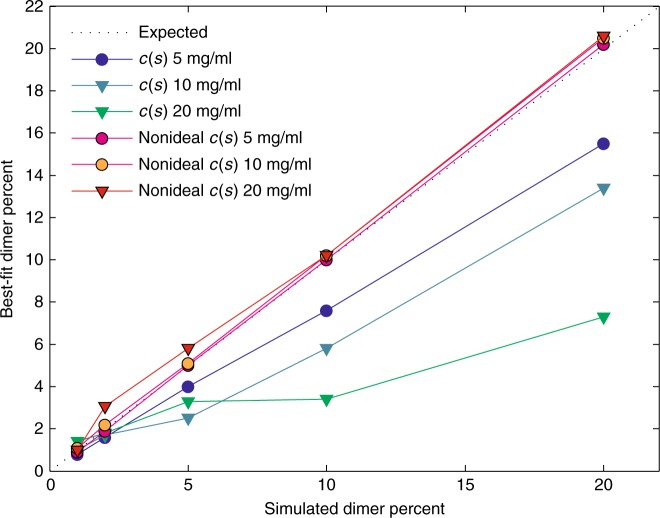
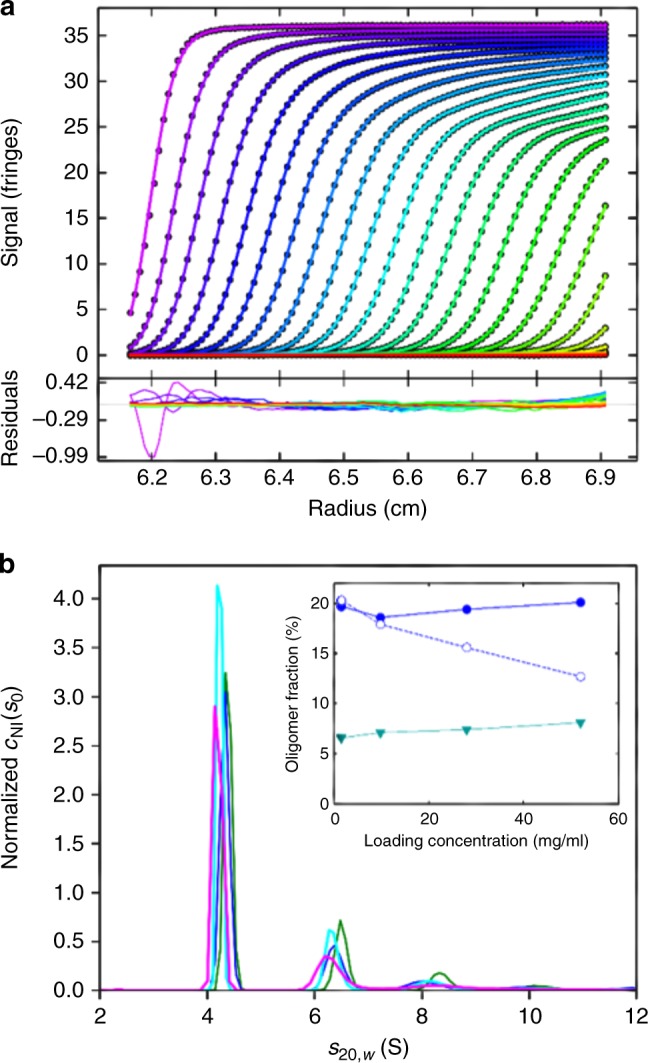
In concentrated macromolecular solutions, weak physical interactions control the solution behavior including particle size distribution, aggregation, liquid-liquid phase separation, or crystallization. This is central to many fields ranging from colloid chemistry to cell biology and pharmaceutical protein engineering. Unfortunately, it is very difficult to determine macromolecular assembly states and polydispersity at high concentrations in solution, since all motion is coupled through long-range hydrodynamic, electrostatic, steric, and other interactions, and scattering techniques report on the solution structure when average interparticle distances are comparable to macromolecular dimensions. Here we present a sedimentation velocity technique that, for the first time, can resolve macromolecular size distributions at high concentrations, by simultaneously accounting for average mutual hydrodynamic and thermodynamic interactions. It offers high resolution and sensitivity of protein solutions up to 50 mg/ml, extending studies of macromolecular solution state closer to the concentration range of therapeutic formulations, serum, or intracellular conditions.
Conflict of interest statement
The authors declare no competing interests.
Figures
Similar articles
-
Global multi-method analysis of interaction parameters for reversibly self-associating macromolecules at high concentrations.Sci Rep. 2021 Mar 11;11(1):5741. doi: 10.1038/s41598-021-84946-8. Sci Rep. 2021. PMID: 33707571 Free PMC article.
-
Measuring Ultra-Weak Protein Self-Association by Non-ideal Sedimentation Velocity.J Am Chem Soc. 2019 Feb 20;141(7):2990-2996. doi: 10.1021/jacs.8b11371. Epub 2019 Feb 6. J Am Chem Soc. 2019. PMID: 30668114 Free PMC article.
-
Measuring aggregates, self-association, and weak interactions in concentrated therapeutic antibody solutions.MAbs. 2020 Jan-Dec;12(1):1810488. doi: 10.1080/19420862.2020.1810488. MAbs. 2020. PMID: 32887536 Free PMC article.
-
Macromolecular crowding in biological systems: hydrodynamics and NMR methods.J Mol Recognit. 2004 Sep-Oct;17(5):397-407. doi: 10.1002/jmr.694. J Mol Recognit. 2004. PMID: 15362098 Review.
-
A review of modern approaches to the hydrodynamic characterisation of polydisperse macromolecular systems in biotechnology.Biotechnol Genet Eng Rev. 2014 Oct;30(1-2):142-57. doi: 10.1080/02648725.2014.994870. Epub 2015 Feb 16. Biotechnol Genet Eng Rev. 2014. PMID: 25686159 Review.
Cited by
-
Insights into the biochemical and biophysical mechanisms mediating the longevity of the transparent optics of the eye lens.J Biol Chem. 2022 Nov;298(11):102537. doi: 10.1016/j.jbc.2022.102537. Epub 2022 Sep 27. J Biol Chem. 2022. PMID: 36174677 Free PMC article. Review.
-
Label-free methods for optical in vitro characterization of protein-protein interactions.Phys Chem Chem Phys. 2021 Aug 12;23(31):16488-16500. doi: 10.1039/d1cp01072g. Phys Chem Chem Phys. 2021. PMID: 34342317 Free PMC article. Review.
-
Global multi-method analysis of interaction parameters for reversibly self-associating macromolecules at high concentrations.Sci Rep. 2021 Mar 11;11(1):5741. doi: 10.1038/s41598-021-84946-8. Sci Rep. 2021. PMID: 33707571 Free PMC article.
-
BASIS: BioAnalysis SEDFIT integrated software for cGMP analysis of SV-AUC data.Eur Biophys J. 2024 Apr;53(3):111-121. doi: 10.1007/s00249-024-01700-4. Epub 2024 Feb 8. Eur Biophys J. 2024. PMID: 38329496
-
Quantifying the concentration dependence of sedimentation coefficients for globular macromolecules: a continuing age-old problem.Biophys Rev. 2021 Apr 10;13(2):273-288. doi: 10.1007/s12551-021-00793-x. eCollection 2021 Apr. Biophys Rev. 2021. PMID: 33936319 Free PMC article. Review.
References
-
- Russel WB, Saville DA, Schowalter WR. Colloidal Dispersions. Cambridge: Cambridge University Press; 1989.
Publication types
MeSH terms
Substances
Grants and funding
LinkOut - more resources
Full Text Sources
