. 2018 Oct 24;8(1):15747.
doi: 10.1038/s41598-018-33842-9.

SMTracker: a tool for quantitative analysis, exploration and visualization of single-molecule tracking data reveals highly dynamic binding of B. subtilis global repressor AbrB throughout the genome

Affiliations

SMTracker: a tool for quantitative analysis, exploration and visualization of single-molecule tracking data reveals highly dynamic binding of B. subtilis global repressor AbrB throughout the genome

Thomas C Rösch et al. Sci Rep. .

Abstract

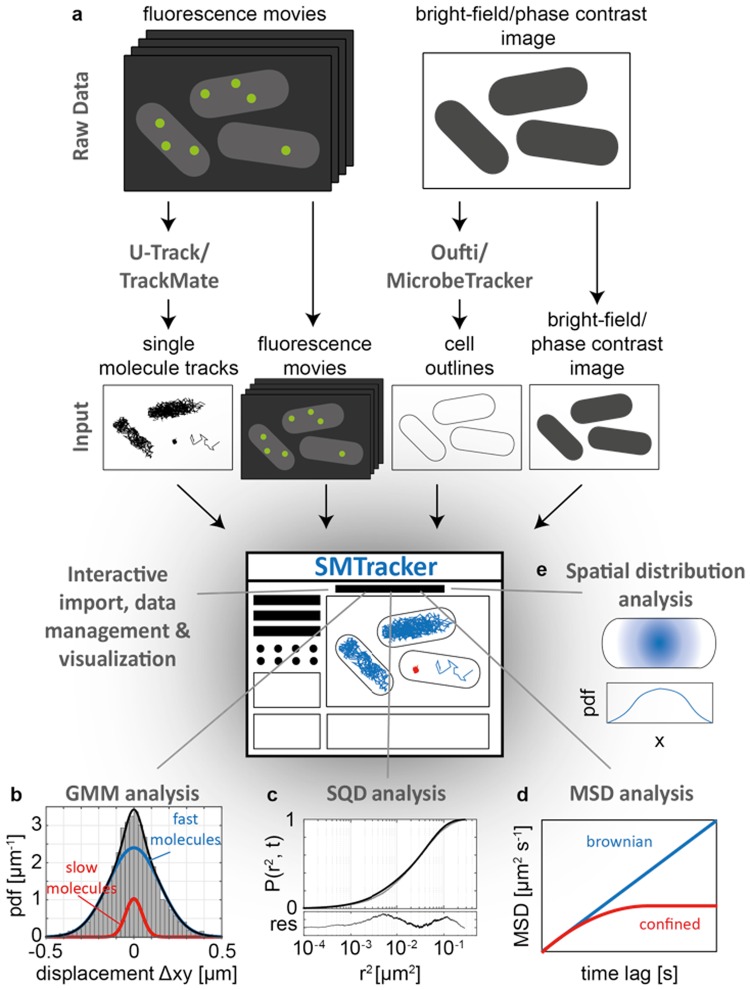
Single-particle (molecule) tracking (SPT/SMT) is a powerful method to study dynamic processes in living cells at high spatial and temporal resolution. Even though SMT is becoming a widely used method in bacterial cell biology, there is no program employing different analytical tools for the quantitative evaluation of tracking data. We developed SMTracker, a MATLAB-based graphical user interface (GUI) for automatically quantifying, visualizing and managing SMT data via five interactive panels, allowing the user to interactively explore tracking data from several conditions, movies and cells on a track-by-track basis. Diffusion constants are calculated a) by a Gaussian mixture model (GMM) panel, analyzing the distribution of positional displacements in x- and y-direction using a multi-state diffusion model (e.g. DNA-bound vs. freely diffusing molecules), and inferring the diffusion constants and relative fraction of molecules in each state, or b) by square displacement analysis (SQD), using the cumulative probability distribution of square displacements to estimate the diffusion constants and relative fractions of up to three diffusive states, or c) through mean-squared displacement (MSD) analyses, allowing the discrimination between Brownian, sub- or superdiffusive behavior. A spatial distribution analysis (SDA) panel analyzes the subcellular localization of molecules, summarizing the localization of trajectories in 2D- heat maps. Using SMTracker, we show that the global transcriptional repressor AbrB performs highly dynamic binding throughout the Bacillus subtilis genome, with short dwell times that indicate high on/off rates in vivo. While about a third of AbrB molecules are in a DNA-bound state, 40% diffuse through the chromosome, and the remaining molecules freely diffuse through the cells. AbrB also forms one or two regions of high intensity binding on the nucleoids, similar to the global gene silencer H-NS in Escherichia coli, indicating that AbrB may also confer a structural function in genome organization.


Conflict of interest statement

The authors declare no competing interests.

Figures

Figure 1
Figure 1
The SMTracker software suite. (a) After importing raw data of tracks and cell outlines, the import panel allows the user to interactively explore the data, identify characteristic patterns and potential experimental artifacts. (b) The Gaussian mixture model (GMM) analysis runs a fit on the probability density function (pdf) of positional 1D displacements, assuming a two- (or three-) state model with a mobile (blue line) and immobile (red line) subpopulation of molecules, thereby extracting the diffusion coefficient and fraction size of each subpopulation. (c) Squared displacement (SQD) analysis considers the cumulative probability function of squared displacements and provides an alternative way to analyze up to 3 different subpopulations in the biological sample. (d) The mean-squared displacement (MSD) analysis plots the time-ensemble averaged MSD vs. the time-lag, revealing the type of motion exhibited by the molecules. A linear dependency of the MSD on the time-lag indicates Brownian diffusion (blue line), whereas an asymptotic curve is indicative of confined (or sub-diffusive) motion. (e) In the spatial distribution analysis (SDA) panel the software generates 2D- and 3D- heat maps and distributions of trajectories along the x- and y-axis of the cell, allowing the identification of specific localization patterns of molecules, e.g., cytoplasmic, membrane- or nucleoid-bound.
Figure 2
Figure 2
Dependence of estimated diffusion constant D1 (slow subpopulation) on simulation parameters and inference method. Each panel (A–I) corresponds to a combination of simulation parameters D1 and D2, as indicated by the green and blue labels outside the plot panels, respectively. Within each panel 4 values of the fraction sizes α were chosen and synthetic simulations were performed on all parameter combinations. For each parameter combination (D1, D2 and α) 30 simulations with 2000 tracks of 20 frames duration (see Table 1 for all simulation parameters) were executed and the resulting data was analyzed with the GMM and SQD method, yielding two different estimates for the value of D1(GMM: black boxplots; SQD: cyan boxplots). On each box, the central mark is the median, the edges of the box are the 25th and 75th percentiles, the whiskers extend to the most extreme data points not considered outliers and the outliers are plotted as individual circles. The green horizontal lines indicate the true value for D1in the simulation. The black dashed lines indicate the lower limit Dloc=σloc22Δt=0.0225μm2s for an estimate of the diffusion constant, given a finite localization precision σloc=30nm and a frame rate of Δt=20ms used in our simulations.
Figure 3
Figure 3
Dependence of estimated diffusion constant D2 (fast subpopulation) on simulation parameters and inference method. Each panel (A–I) corresponds to a combination of simulation parameters D1 and D2, as indicated by the green and blue labels outside the plot panels, respectively. Within each panel 4 values of the fraction sizes α were chosen and synthetic simulations were performed on all parameter combinations. For each parameter combination (D1, D2 and α) 30 simulations with 2000 tracks of 20 frames duration (see Table 1 for all simulation parameters) were executed and the resulting data was analyzed with the GMM and SQD method, yielding two different estimates for the value of D2(GMM: black boxplots; SQD: cyan boxplots). On each box, the central mark is the median, the edges of the box are the 25th and 75th percentiles, the whiskers extend to the most extreme data points not considered outliers and the outliers are plotted as individual circles. The blue horizontal lines indicate the true value for D2in the simulation.
Figure 4
Figure 4
Dependence of estimated fraction α (slow subpopulation) on simulation parameters and inference method. Each panel (A–I) corresponds to a combination of simulation parameters D1 and D2, as indicated by the green and blue labels outside the plot panels, respectively. Within each panel 4 values of the fraction sizes α were chosen and synthetic simulations were performed on all parameter combinations. For each parameter combination (D1, D2 and α) 30 simulations with 2000 tracks of 20 frames duration (see Table 1 for all simulation parameters) were executed and the resulting data was analyzed with the GMM and SQD method, yielding two different estimates for the value of α(GMM: black boxplots; SQD: cyan boxplots). On each box, the central mark is the median, the edges of the box are the 25th and 75th percentiles, the whiskers extend to the most extreme data points not considered outliers and the outliers are plotted as individual circles. The red lines indicate the true values for α in the simulation.
Figure 5
Figure 5
SMT analyses of AbrB-YFP from Bacillus subtilis. (A) Projection of all frames of a typical stream acquisition overlayed with tracks (in blue) detected by U-track (left panel), (B) and a projection of frames without tracks. (C) Heat map showing mobile AbrB-YFP tracks in blue, and static tracks in red. (D) dwell time determination, (E) Diffusion constants and average dwell times of AbrB-YFP.
Figure 6
Figure 6
Bleaching of YFP-MreB in single B. subtilis cells. Image acquisition parameters were identical to those used in Fig. 5. Exponential fits (solid curves) to the bleaching curves of 23 single cells (dots) revealed an average bleaching half-life time of <τ1/2> = 1.3 s with a standard deviation of σ1/2 = 0.4 s.

References

    1. Shashkova Sviatlana, Leake Mark C. Single-molecule fluorescence microscopy review: shedding new light on old problems. Bioscience Reports. 2017;37(4):BSR20170031. doi: 10.1042/BSR20170031. - DOI - PMC - PubMed
    1. Stracy M, Uphoff S, Garza de Leon F, Kapanidis AN. In vivo single-molecule imaging of bacterial DNA replication, transcription, and repair. FEBS Lett. 2014;588:3585–3594. doi: 10.1016/j.febslet.2014.05.026. - DOI - PubMed
    1. Kusumi A, Tsunoyama TA, Hirosawa KM, Kasai RS, Fujiwara TK. Tracking single molecules at work in living cells. Nat. Chem. Biol. 2014;10:524–532. doi: 10.1038/nchembio.1558. - DOI - PubMed
    1. Zawadzki P, et al. The Localization and Action of Topoisomerase IV in Escherichia coli Chromosome Segregation Is Coordinated by the SMC Complex, MukBEF. Cell Rep. 2015;13:2587–2596. doi: 10.1016/j.celrep.2015.11.034. - DOI - PMC - PubMed
    1. Kleine Borgmann LA, Ries J, Ewers H, Ulbrich MH, Graumann PL. The bacterial SMC complex displays two distinct modes of interaction with the chromosome. Cell Rep. 2013;3:1483–1492. doi: 10.1016/j.celrep.2013.04.005. - DOI - PubMed

Publication types