. 2019 Jan;12(1):51-63.
doi: 10.1038/s41385-018-0092-6. Epub 2018 Oct 24.

T-bet controls intestinal mucosa immune responses via repression of type 2 innate lymphoid cell function

Affiliations

T-bet controls intestinal mucosa immune responses via repression of type 2 innate lymphoid cell function

N Garrido-Mesa et al. Mucosal Immunol. 2019 Jan.

Abstract

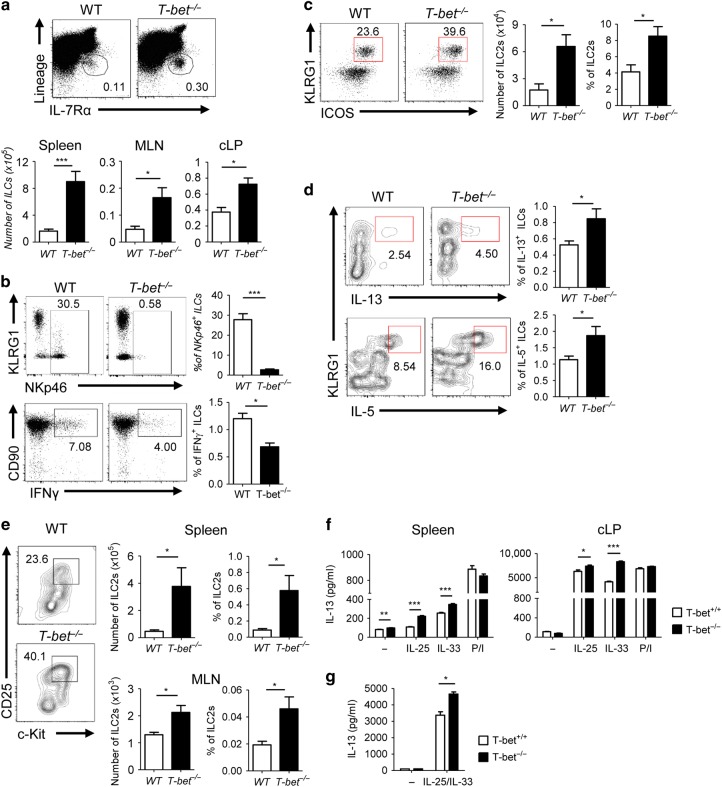
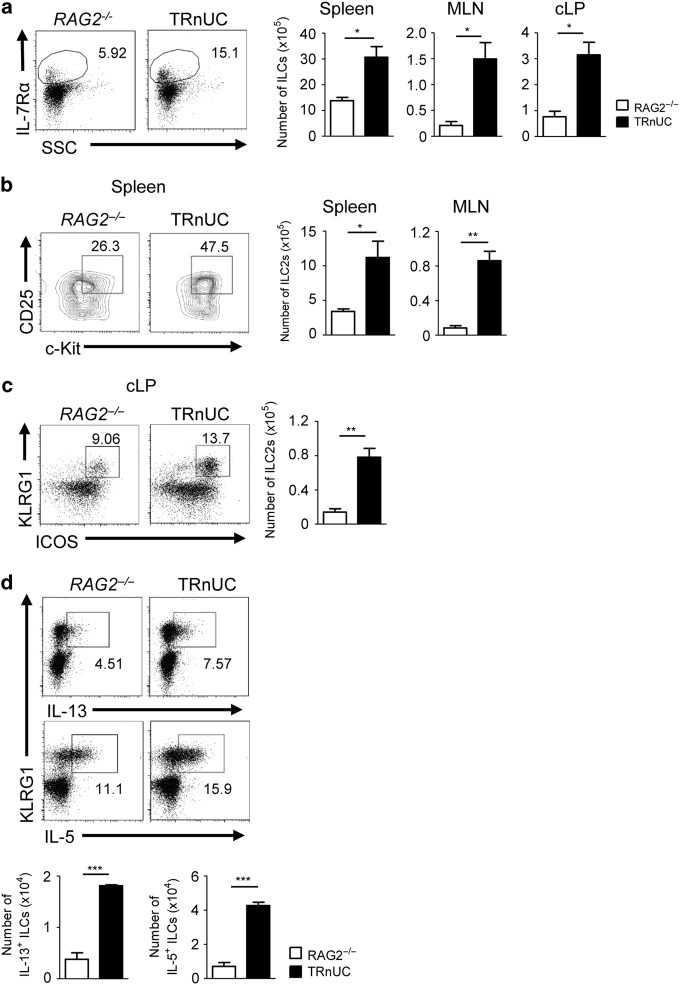
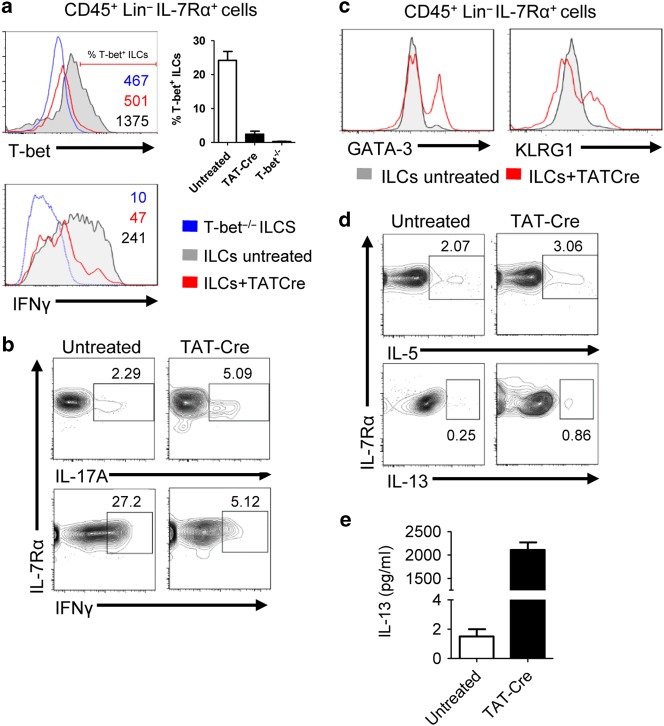
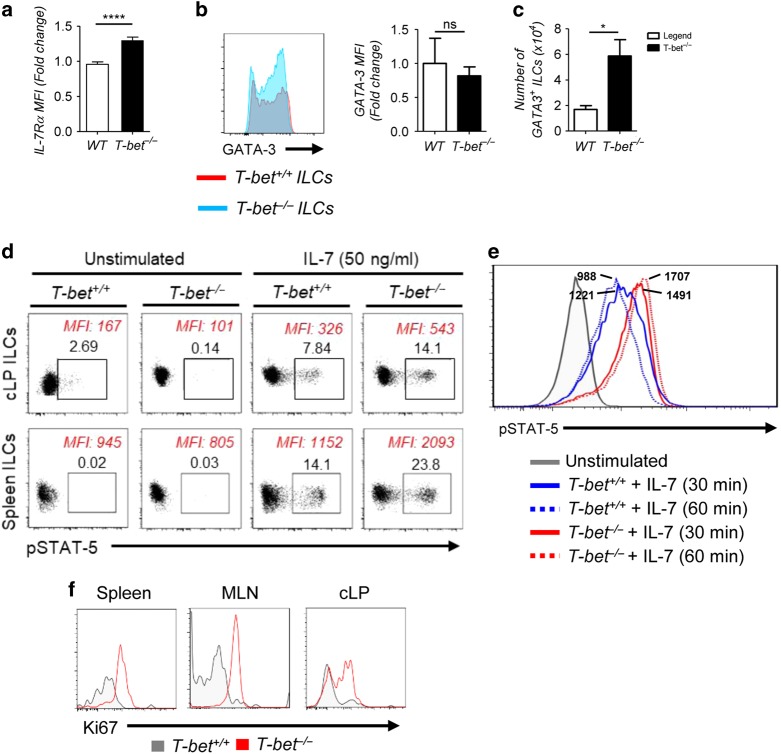
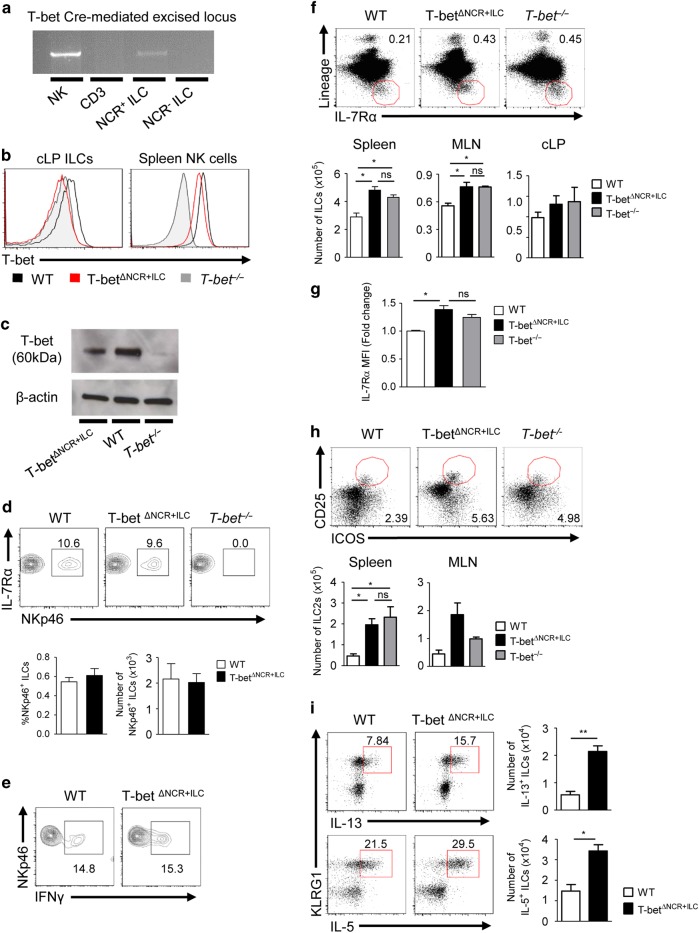
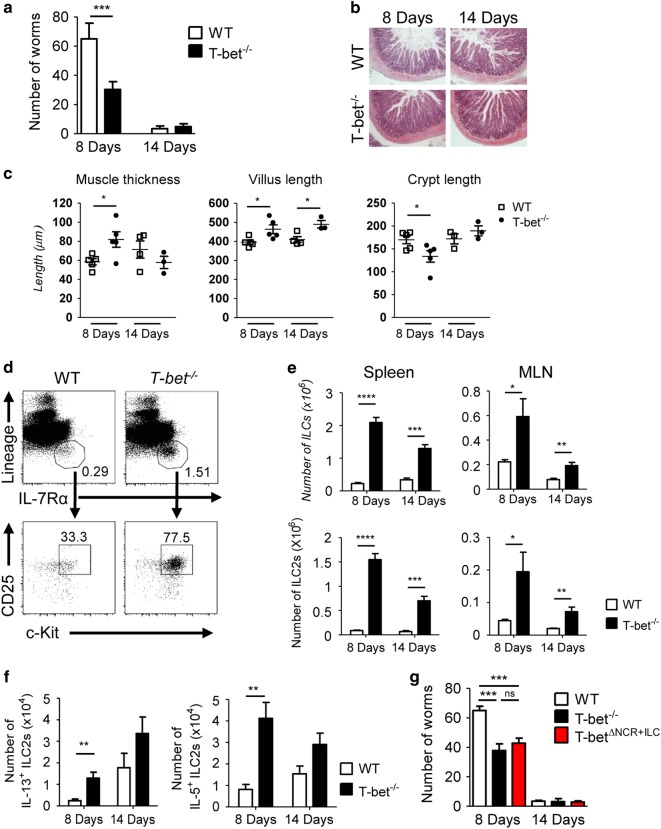
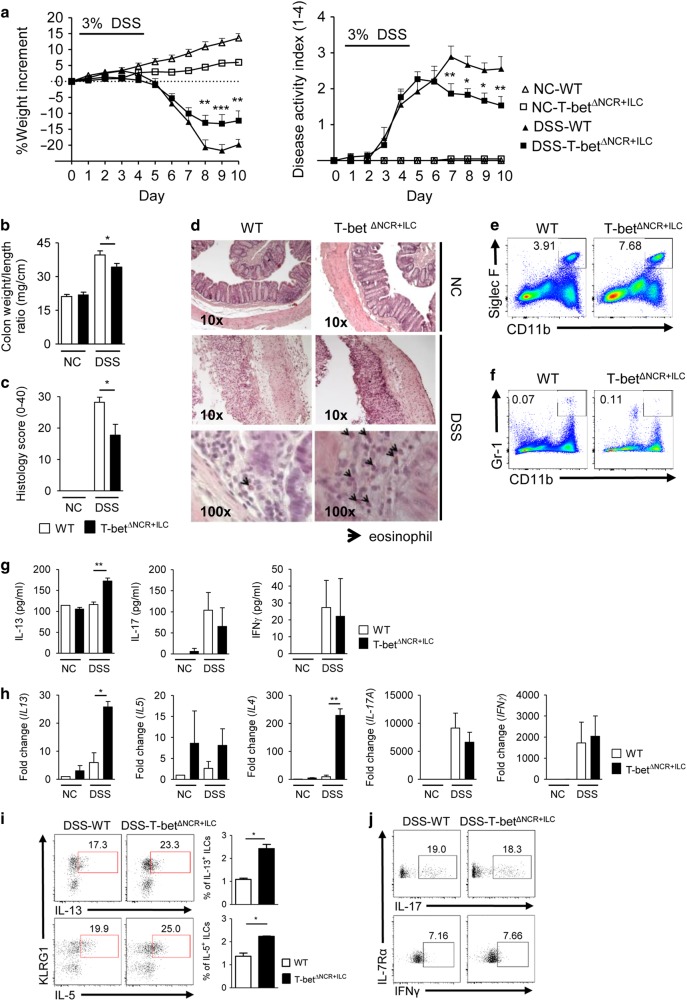
Innate lymphoid cells (ILCs) play an important role in regulating immune responses at mucosal surfaces. The transcription factor T-bet is crucial for the function of ILC1s and NCR+ ILC3s and constitutive deletion of T-bet prevents the development of these subsets. Lack of T-bet in the absence of an adaptive immune system causes microbiota-dependent colitis to occur due to aberrant ILC3 responses. Thus, T-bet expression in the innate immune system has been considered to dampen pathogenic immune responses. Here, we show that T-bet plays an unexpected role in negatively regulating innate type 2 responses, in the context of an otherwise intact immune system. Selective loss of T-bet in ILCs leads to the expansion and increased activity of ILC2s, which has a functionally important impact on mucosal immunity, including enhanced protection from Trichinella spiralis infection and inflammatory colitis. Mechanistically, we show that T-bet controls the intestinal ILC pool through regulation of IL-7 receptor signalling. These data demonstrate that T-bet expression in ILCs acts as the key transcriptional checkpoint in regulating pathogenic vs. protective mucosal immune responses, which has significant implications for the understanding of the pathogenesis of inflammatory bowel diseases and intestinal infections.


Conflict of interest statement

The authors declare no competing interests.

Figures

Fig. 1
Fig. 1
ILC2s are expanded in immunocompetent T-bet-deficient mice. ag Flow cytometry analysis of the different ILC populations in WT and T-bet−/− mice showing: a Representative plots showing the ILC population within CD45+ cells in the spleen. Absolute cell numbers of ILCs in the indicated tissues; b Representative plots and percentage of NKp46+ cells within the ILC population and IFNγ-producing ILCs within the CD45+ live cell population in the cLP; c Representative plots showing the ILC2 population within cLP ILCs. Absolute cell numbers of ILC2s and percentage of ILC2s within the CD45+ live cell population in the cLP; d Representative plots showing IL-13 and IL-5 cytokine expression by KLRG1+ ILCs from the cLP. Percentage of IL-13+ and IL-5+ ILCs within the CD45+ live cell population in the cLP; e Representative plots showing the ILC2 population within splenic ILCs. Absolute cell numbers of ILC2s and percentage of ILC2s within the CD45+ live cell population in the indicated tissues. ILCs are defined as CD45+Lin-IL-7Rα+ cells; ILC2s are defined as CD45+Lin-IL-7Rα+ICOS+KLRG1+ (cLP) and as CD45+LinIL-7Rα+CD25+c-Kit+ (spleen and MLN) cells. f-g IL-13 concentration in the supernatants of cultured: f T-cells-depleted leucocytes from the spleen and cLP and g FACS-sorted ILC2s from the cLP of WT and T-bet−/− mice, unstimulated (-) or stimulated with IL-25 or/and IL-33 (50 ng/ml, 24 h), or PMA (50 ng/ml) and ionomycin (1 μg/ml). ILC2s were FACS-sorted as CD45+Lin-IL-7Rα+ICOS+KLRG1+ cells. Data are expressed as mean ± SEM and are representative of at least three independent experiments (n = 3). ns: non-significant; *p < 0.05; **p < 0.01; ***p < 0.001. See also Supplemental Figs. 1–4
Fig. 2
Fig. 2
ILC2 expansion also occurs in T-bet−/− x RAG2−/−mice. Flow cytometry analysis of the different ILC populations in RAG2−/−and TRnUC mice showing: a Representative plots showing the ILC population within CD45+ cells from the spleen. Absolute numbers of ILCs in the indicated tissues; b Representative plots showing the ILC2 population within ILCs from the spleen and absolute numbers of ILC2s in the spleen and MLN; c Representative plots showing the ILC2 population within ILCs from the cLP and absolute numbers of ILC2s in the cLP; d Representative plots showing IL-5 and IL-13 expression by KLRG1+ ILCs and numbers of IL-5 and IL-13-producing ILCs in the cLP. Data are expressed as mean ± SEM and are representative of at least three independent experiments (n = 3). *p < 0.05; **p < 0.01; ***p < 0.001. ILCs are defined as CD45+IL-7Rα+ cells and ILC2s as CD45+IL-7Rα+cKit+CD25+ (spleen and MLN) and CD45+IL-7Rα+KLRG1+ICOS+ (cLP) cells
Fig. 3
Fig. 3
In vitro targeting of T-bet in ILCs promotes the ILC2 phenotype. ad Representative flow cytometry plots and histograms showing: a T-bet expression and IFNγ production (numbers indicate mean fluorescent intensity (MFI)) and percentage of T-bet+ ILCs; b IL-17A and IFNγ production (numbers indicate percentage of cells); c GATA-3 and KLRG1 expression and d IL-5 and IL-13 production (numbers indicate percentage of cells); e Concentration of IL-13 in the culture supernatants. FACS-sorted cLP ILCs (CD45+LinIL-7Rα+cells) from T-betfl/fl mice were treated with TAT-Cre recombinase (100 μg/ml) and maintained in culture with IL-2 (100 UI/ml) and IL-7 (10 ng/ml) for a week. Intracellular cytokine staining was performed after PMA and ionomycin stimulation. For IL-13 determination in the culture supernatant cells were previously stimulated with IL-25 and IL-33 (50 ng/ml) for 24 h. Data are expressed as mean ± SEM and are representative of at least three independent experiments (n = 3)
Fig. 4
Fig. 4
T-bet de-repression of IL-7Rα in ILCs stabilises IL-7 signalling and STAT-5 phosphorylation. a Density of IL-7Rα expression in ILCs from the cLP of WT vs. T-bet−/− mice measured by flow cytometry. Fold change expressed as mean ± SEM vs. WT group. b GATA-3 expression levels in ILCs from WT vs T-bet−/− mice. c Absolute cell numbers of GATA-3+ ILCs in the cLP of WT and T-bet−/− mice. de Representative flow cytometry analysis of the phosphorylation of STAT-5 in ILCs from the spleen (d) and cLP (de) of WT and T-bet−/−mice after stimulation with: d IL-7 (50 ng/ml, 60 min) and e IL-7 (20 ng/ml, 30 or 60 min). Numbers indicate the median fluorescence intensity (MFI). f Representative flow cytometry analysis of Ki67 expression in ILC2s from the spleen, MLN and cLP of WT and T-bet−/−mice. Data are expressed as mean ± SEM and are representative of at least three independent experiments (n = 3).*p < 0.05; ****p < 0.0001. ILCs were defined as CD45+Lin-IL-7Rα+ and ILC2s as CD45+Lin-IL-7Rα+ICOS+cKit+CD25+ (spleen and MLN) and CD45+LinIL-7Rα+KLRG1+ICOS+ (cLP) cells. See also Supplemental Figs. 5 and 6
Fig. 5
Fig. 5
Selective deletion of T-bet in ILCs in vivo. a Agarose gel electrophoresis (1.5%) of PCR products following specific genomic DNA PCR for the Cre-mediated excised locus of T-bet in FACS-sorted NK cells (CD45+IL-7RαNK1.1+NKp46+), T-cells (CD3+), NCR+ ILCs (CD3-IL-7Rα+NKp46+) and NCR ILCs (CD3IL-7Rα+NKp46) from T-betΔNCR+ILC mice. b Representative histograms showing intracellular staining for T-bet in ILCs from the cLP and in NK cells from the spleen of WT, T-betΔNCR+ILC and T-bet−/−mice. c Analysis of T-bet expression by western blot in FACS-sorted NK cells from the spleen. d Representative flow cytometry plots showing the percentage of NCR+ ILCs and percentage within the CD45+ live cell population and absolute numbers of NCR+ ILCs in the cLP of WT, T-betΔNCR+ILC and T-bet−/−mice. e Representative flow cytometry plots showing IFNγ production by NCR+ ILCs in the cLP of WT and T-betΔNCR+ILC mice. f Representative flow cytometry plots showing the percentages of ILCs in the spleen and absolute numbers of ILCs in the indicated tissues. g Density of IL-7Rα expression in ILCs from WT vs. T-betΔNCR+ILC mice measured by flow cytometry. Fold change expressed as mean ± SEM vs. WT group. h Representative flow cytometry plots showing the percentages of ILC2s within the CD45+ live cell population in the spleen and absolute cell numbers of ILC2s in the indicated tissues of WT, T-betΔNCR+ILC and T-bet−/−mice. i Representative flow cytometry analysis of IL-5 and IL-13 expression by ILCs and absolute cell numbers of IL-5+ and IL-13+ ILCs in the cLP of WT and T-betΔNCR+ILC mice. Data are expressed as mean ± SEM and are representative of at least three independent experiments (n = 3). ns: non-significant; *p < 0.05; **p < 0.01. ILCs were defined as CD45+LinIL-7Rα+ cells and ILC2s were defined as CD45+LinIL-7Rα+CD25+ICOS+ (spleen and MLN) and CD45+LinIL-7Rα+ICOS+KLRG1+ (cLP) cells. See also Supplemental Figs. 7–9
Fig. 6
Fig. 6
T-bet deficiency enhances the mucosal immune response against intestinal parasites. a Number of worms in the SI of WT and T-bet−/− mice 8 and 14 days after the infection with 300 larvae of T. spiralis. b Representative H&E-stained histological sections and c Quantification of the muscle thickness, villus length and crypt depth in SI histological sections from T. spiralis infected mice. d Representative flow cytometry analysis of CD45+ cells from the spleen of T. spiralis infected mice showing percentages of ILCs and of ILC2s in T-bet−/− mice 8 days after the infection. e Absolute cell numbers of ILCs and ILC2s in the indicated tissues, and f Absolute cell numbers of IL-5+ and IL-13+ ILC2s in the spleen of T. spiralis infected mice, 8 and 14 days after the infection. g Number of worms in the SI of WT, T-bet−/− and T-betΔNCR+ILC mice 8 and 14 days after the infection with 300 larvae of T. spiralis. Data are expressed as mean ± SEM and are representative of at least three independent experiments (n = 5). ns: non-significant; *p < 0.05; **p < 0.01; ***p < 0.001; ****p < 0.0001. ILCs are defined as CD45+LinIL-7Rα+ cells and ILC2s as CD45+LinIL-7Rα+CD25+c-Kit+ (spleen and MLN) and CD45+LinIL-7Rα+KLRG1+ (cLP) cells
Fig. 7
Fig. 7
T-bet deficiency in ILCs protects from the development of inflammatory colitis. a Weight increment (%) (left panel) and disease activity index (DAI) values (right panel) of NC and DSS WT and T-betΔNCR+ILC mice over the 10-day experimental period (n = 10). DAI values were calculated based on the criteria proposed previously. b Colon weight/length ratio and c Spleen weight of NC and DSS WT and T-betΔNCR+ILC mice (n = 10). c Microscopic damage score assigned to colonic sections according the criteria described in supplemental table (n = 10) and d Representative H&E-stained colonic sections from NC and DSS WT and T-betΔNCR+ILC (arrows indicate eosinophils). e, f Representative flow cytometry plots showing the presence of e SiglecF+CD11b+ eosinophils and f Gr1+CD11b+ neutrophils, in the cLP of WT and T-betΔNCR+ILC mice. g Concentration of the indicated cytokines in the culture supernatants of explant colon organ cultures and h Real-time PCR measuring the transcripts of the indicated cytokines in the colon of NC and DSS WT and T-betΔNCR+ILC mice (n = 3). Fold change expressed as mean ± SEM vs. NC WT group. i, j Representative flow cytometry analysis of intracellular cytokine production showing: i IL-5 and IL-13 production and percentages of IL-5+ and IL-13+ ILCs within the CD45+ live cell population (n = 3) and j IL-17 and IFNγ production by cLP ILCs from DSS WT and T-betΔNCR+ILC mice. Data are expressed as mean ± SEM and are representative of at least three independent experiments. *p < 0.05; **p < 0.01; ***p < 0.001. ILCs are defined as CD45+LinIL-7Rα+ cells and ILC2s as CD45+LinIL-7Rα+CD25+c-Kit+ (spleen and MLN) and CD45+LinIL-7Rα+KLRG1+ (cLP) cells. Eosinophils and neutrophils are gated on live CD45+ cells. NC and DSS represent non-colitic and DSS-treated mice, respectively. See also Supplemental Fig. 10

Similar articles

Cited by

References

    1. Artis D, Spits H. The biology of innate lymphoid cells. Nature. 2015;517:293–301. doi: 10.1038/nature14189. - DOI - PubMed
    1. Klose CSN, et al. A T-bet gradient controls the fate and function of CCR6-RORγt + innate lymphoid cells. Nature. 2013;494:261–265. doi: 10.1038/nature11813. - DOI - PubMed
    1. Hoyler T, Connor CA, Kiss EA, Diefenbach A. T-bet and Gata3 in controlling type 1 and type 2 immunity mediated by innate lymphoid cells. Curr. Opin. Immunol. 2013;25:139–147. doi: 10.1016/j.coi.2013.02.007. - DOI - PubMed
    1. Sciumé G, et al. Distinct requirements for T-bet in gut innate lymphoid cells. J. Exp. Med. 2012;209:2331–2338. doi: 10.1084/jem.20122097. - DOI - PMC - PubMed
    1. Powell N, et al. The transcription factor T-bet regulates intestinal inflammation mediated by interleukin−7 receptor + innate lymphoid cells. Immunity. 2012;37:674–684. doi: 10.1016/j.immuni.2012.09.008. - DOI - PMC - PubMed

Publication types

Substances