. 2018 Oct 24;9(1):4429.
doi: 10.1038/s41467-018-06841-7.

Nuclear lactate dehydrogenase A senses ROS to produce α-hydroxybutyrate for HPV-induced cervical tumor growth

Affiliations

Nuclear lactate dehydrogenase A senses ROS to produce α-hydroxybutyrate for HPV-induced cervical tumor growth

Yuan Liu et al. Nat Commun. .

Abstract

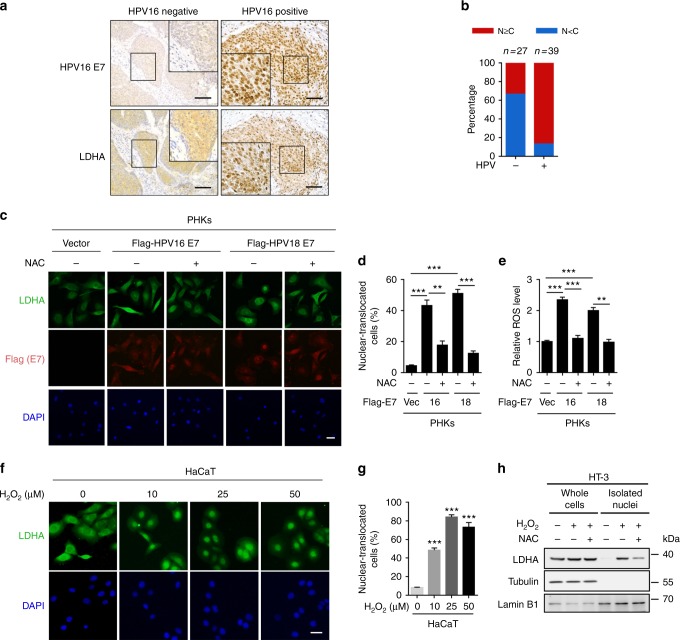
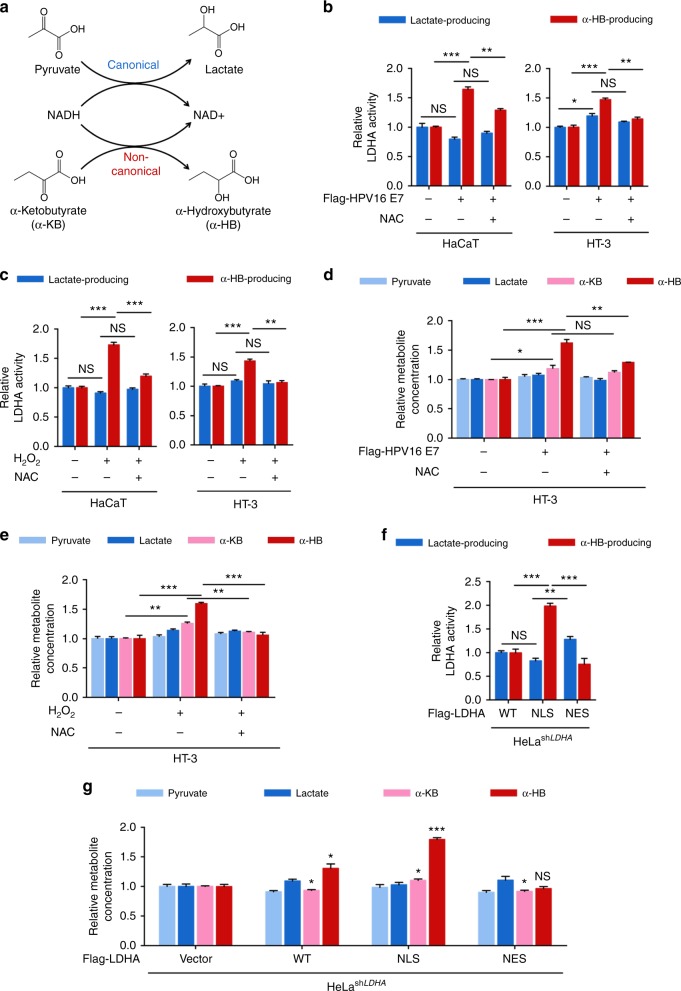
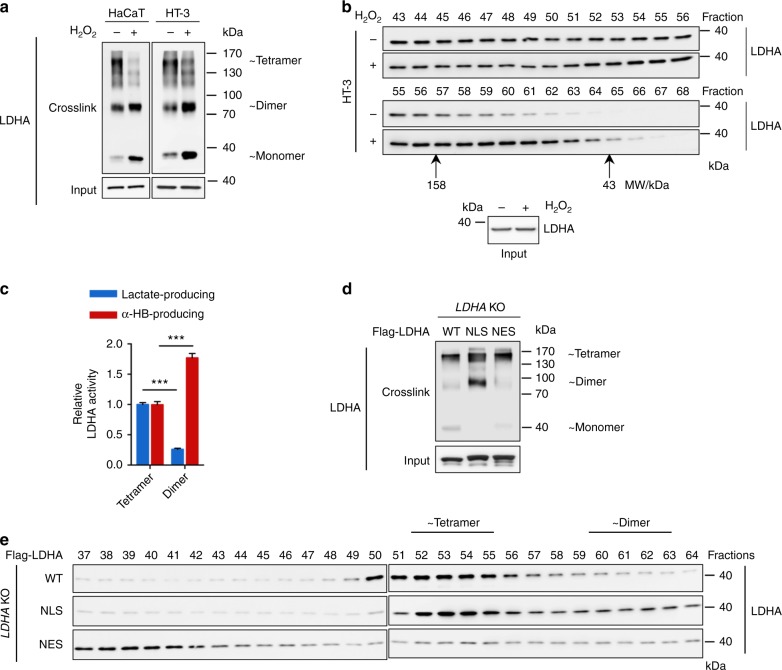
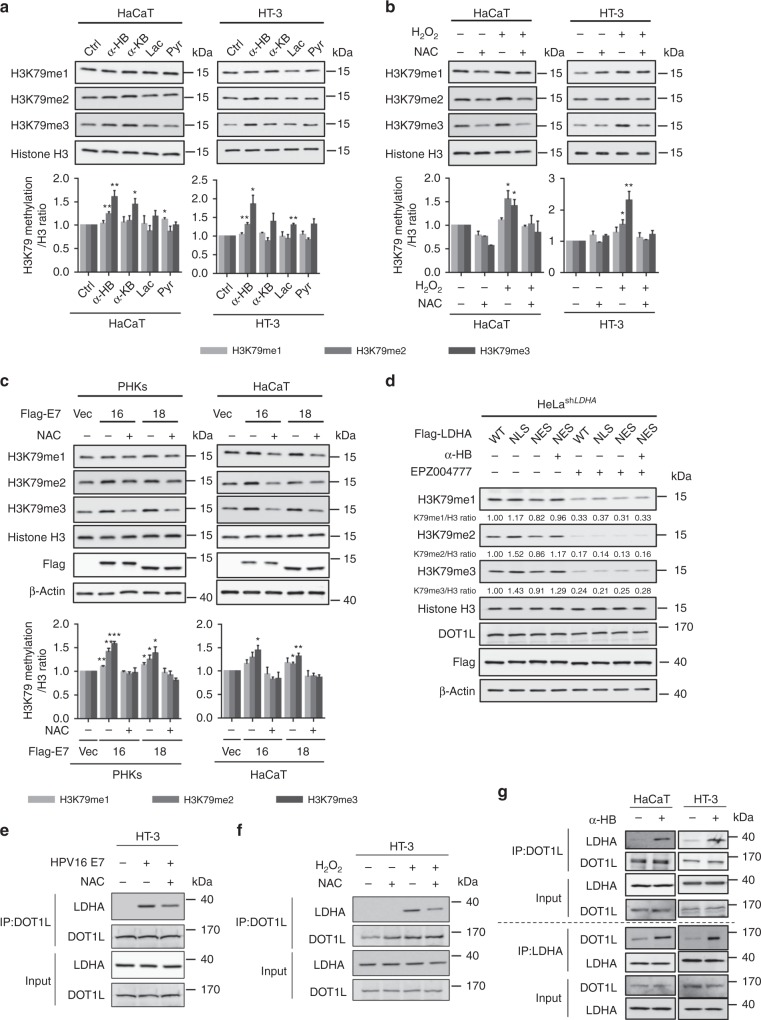
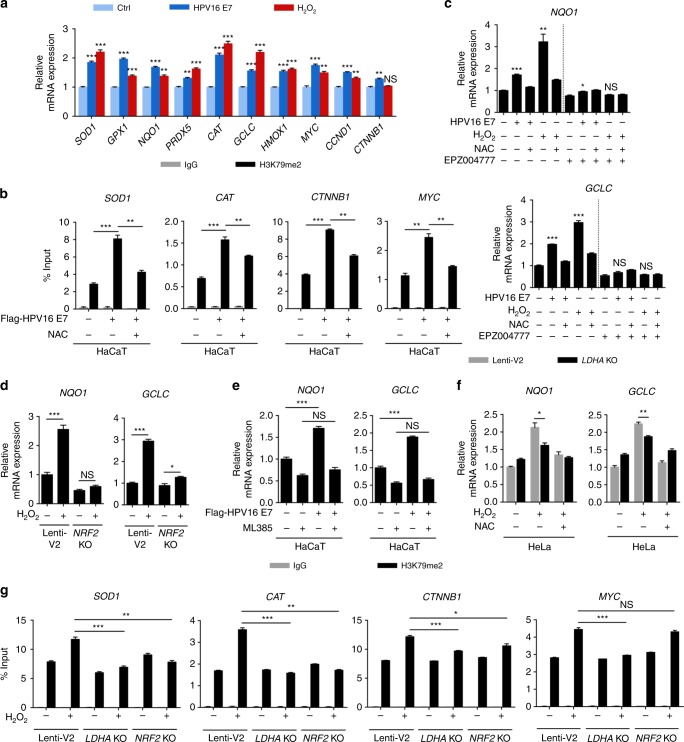
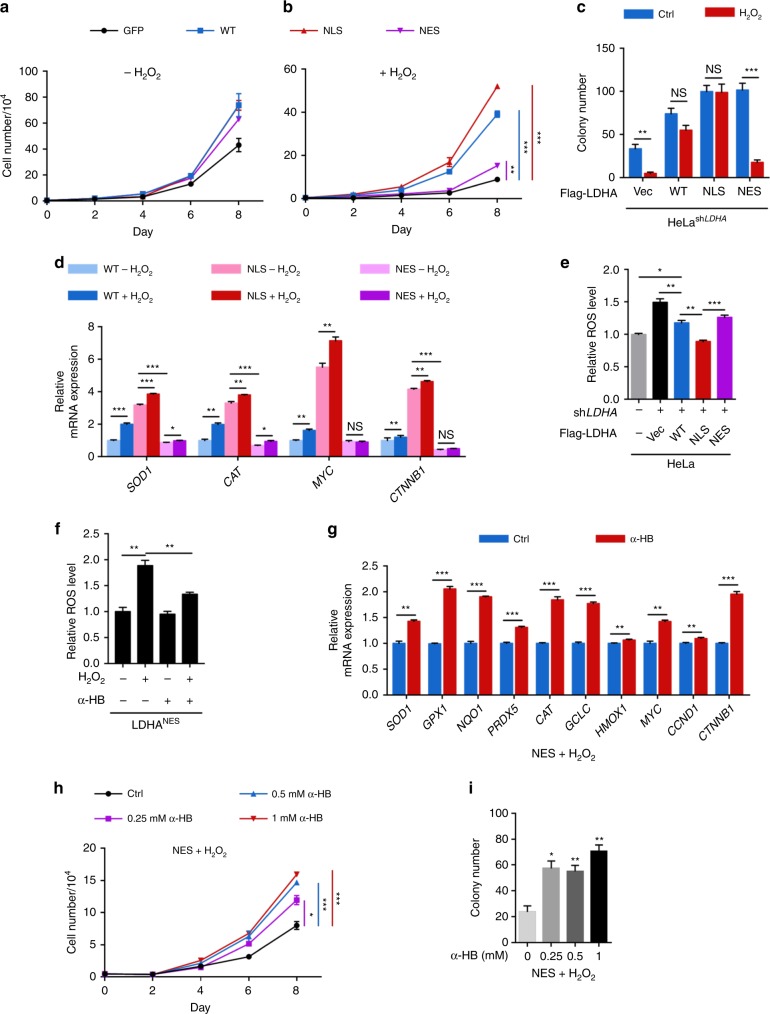
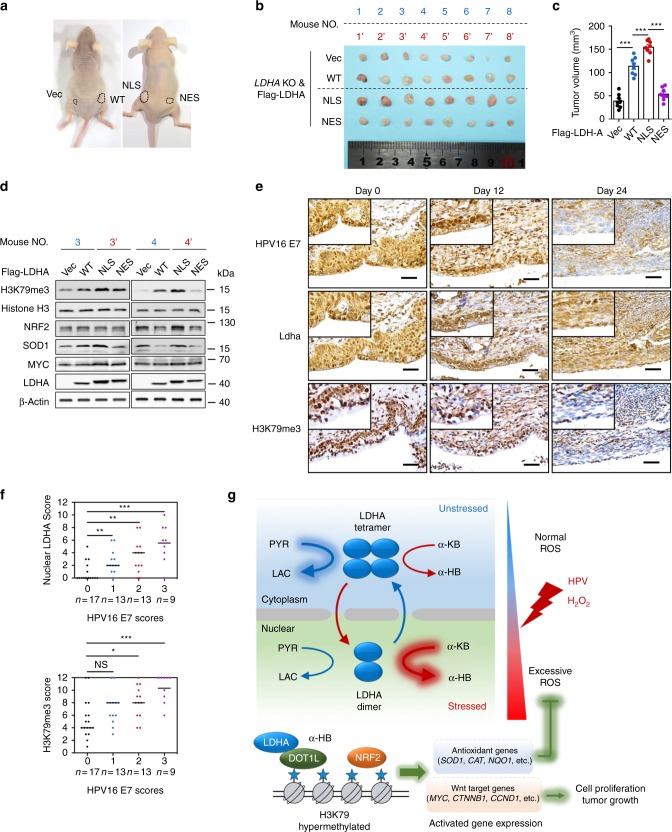
It is well known that high-risk human papilloma virus (HR-HPV) infection is strongly associated with cervical cancer and E7 was identified as one of the key initiators in HPV-mediated carcinogenesis. Here we show that lactate dehydrogenase A (LDHA) preferably locates in the nucleus in HPV16-positive cervical tumors due to E7-induced intracellular reactive oxygen species (ROS) accumulation. Surprisingly, nuclear LDHA gains a non-canonical enzyme activity to produce α-hydroxybutyrate and triggers DOT1L (disruptor of telomeric silencing 1-like)-mediated histone H3K79 hypermethylation, resulting in the activation of antioxidant responses and Wnt signaling pathway. Furthermore, HPV16 E7 knocking-out reduces LDHA nuclear translocation and H3K79 tri-methylation in K14-HPV16 transgenic mouse model. HPV16 E7 level is significantly positively correlated with nuclear LDHA and H3K79 tri-methylation in cervical cancer. Collectively, our findings uncover a non-canonical enzyme activity of nuclear LDHA to epigenetically control cellular redox balance and cell proliferation facilitating HPV-induced cervical cancer development.


Conflict of interest statement

The authors declare no competing interests.

Figures

Fig. 1
Fig. 1
HPV16/18 E7 induces LDHA nuclear translocation by ROS accumulation. a LDHA is significantly translocated into nucleus in HPV16 positive cervical cancer tissues. Representative IHC images for LDHA localization in HPV16-negative and positive cervical tumor samples. Scale bar, 100 μm. b Nuclear LDHA is dramatically increased in HPV16-positive cervical cancer tissues. Semi-quantitative cytoplasmic LDHA and nuclear LDHA scoring was performed in HPV16 negative (n = 27) and positive (n = 39) cervical tumor samples. c, d HPV16/18 E7 promotes LDHA nuclear translocation in a ROS-dependent manner. Primary human cervix keratinocytes (PHKs) stably expressing vector or Flag-tagged HPV16/18 E7 were treated with or without 1 mM NAC for 6 h, followed by staining with anti-LDHA (green), anti-Flag (red) antibodies, and DAPI (blue). Scale bars, 10 μm (c). The percentage of cells with nucleus-localized LDHA compared to total cell number was quantified (d). e HPV16/18 E7 enhances ROS production. Cellular ROS were measured in PHKs stably expressing vector or HPV16/18 E7 coupled with or without 1 mM NAC treatment for 6 h, followed by using the ROS-sensitive fluorescent dye (CM-H2DCFDA) with flow cytometry according to the manufacturer’s protocol. f, g LDHA nuclear translocation is profoundly increased in an H2O2-dose-dependent manner. Immunofluorescent images of LDHA (green) in HaCaT cells upon different dose of H2O2 treatment as indicated. DAPI, blue. Scale bars, 10 μm (f). The percentage of cells with nucleus-localized LDHA compared with total cell number was quantified (g). h ROS promote LDHA nuclear translocation. HT-3 cells were treated with or without 10 μM H2O2 for 6 h, and supplemented with or without 1 mM NAC for extended 6 h as indicated for nuclear isolating, followed by blotting with LDHA, Tubulin, and Lamin B1. Results are representative of three independent experiments. All data are shown as mean ± SEM. The p values were determined by two-tailed t-test. The values of p < 0.05 were considered statistically significant. *, **, and *** denote p < 0.05, p < 0.01, and p < 0.001, respectively. NS means non significant
Fig. 2
Fig. 2
Nuclear LDHA gains a noncanonical enzyme activity to produce α-HB. a Schematic of the canonical and noncanonical LDHA enzyme activity. b HPV16 E7 enhances the noncanonical enzyme activity of LDHA. The canonical and noncanonical LDHA enzyme activities were measured in HaCaT and HT-3 cells stably expressing vector or HPV16 E7 coupled with or without 1 mM NAC treatment for 6 h. c ROS elevate the noncanonical enzyme activity of LDHA. HaCaT and HT-3 cells were treated with or without 10 μM H2O2 for 6 h, and supplemented with or without 1 mM NAC for extended 6 h as indicated for measurement of the canonical and noncanonical LDHA enzyme activities. d HPV16 E7 expression accumulates cellular α-HB. The extracted metabolite samples from the HT-3 cells stably expressing vector or HPV16 E7 coupled with or without 1 mM NAC treatment for 6 h as indicated were analyzed by LC-MS/MS, relative abundance (by metabolite peak area) was shown. e ROS accumulate cellular α-HB. The extracted metabolite samples from HT-3 cells treated with or without 10 μM H2O2 for 6 h, and supplemented with or without 1 mM NAC for extended 6 h as indicated were analyzed by liquid chromatography coupled to triple quadrupole tandem mass spectrometry (LC-MS/MS), relative abundance (by metabolite peak area) was shown. f Nuclear LDHA presents higher noncanonical enzyme activity. The canonical and noncanonical enzyme activities were measured in HeLa stable cells with LDHA knockdown and Vec/WT/NLS/NES rescue. Vec, vector; WT, wild-type; NLS, nuclear localization signal; NES, nuclear export signal. g LDHA nuclear translocation accumulates cellular α-HB. The extracted metabolite samples from HeLa stable cells with LDHA knockdown and Vec/WT/NLS/NES rescue were analyzed by LC-MS/MS, relative abundance (by metabolite peak area) was shown. LDHA enzyme activities were normalized to LDHA protein level. Relative metabolite abundances were normalized to cell number. Results are representative of three independent experiments. All data are shown as mean ± SEM. The p values were determined by two-tailed t-test. The values of p < 0.05 were considered statistically significant. *, **, and *** denote p < 0.05, p < 0.01, and p < 0.001, respectively. NS means non significant
Fig. 3
Fig. 3
ROS disrupt LDHA tetramer formation and promote noncanonical enzyme activity. a, b ROS disrupt LDHA tetramer formation. HaCaT and HT-3 cell extracts with or without 10 μM H2O2 treatment were crosslinked by 0.025 % glutaraldehyde and analyzed by western blotting using LDHA antibody. Tetrameric, dimeric, and monomeric LDHA were indicated (a). HT-3 cell extracts were prepared from 1 × 107 cells with or without 10 μM H2O2 treatment and passed over the gel filtration column. Fractions were collected every 0.25 ml per tube and analyzed by western blot for LDHA protein. Molecular mass, 158 and 43 kDa marked below the blots, were determined by Gel Filtration Calibration Kit HMW (GE Healthcare). The loading inputs for gel filtration were shown below (b). c Dimer LDHA presents the noncanonical enzyme activity. The canonical and noncanonical LDHA enzyme activity assays were measured on tetramer fractions (Fraction #56, #57) and dimer fractions (Fraction #60, #61) separated from gel filtration. d, e More dimers form in the LDHANLS group compare with that of LDHANES group. Cell extracts from HEK293T LDHA KO cells expressing Flag-tagged WT, NLS, and NES LDHA were crosslinked by 0.025 % glutaraldehyde and analyzed by western blotting using LDHA antibody. Tetrameric, dimeric, and monomeric LDHA were indicated (d). Cell extracts from HEK293T LDHA KO cells expressing Flag-tagged WT, NLS, and NES LDHA were passed over the gel filtration column. Fractions were collected every 0.25 ml per tube and analyzed by western blot for LDHA protein. Molecular mass was determined by Gel Filtration Calibration Kit HMW (GE Healthcare). Results are representative of three independent experiments. All data are shown as mean ± SEM. The p values were determined by two-tailed t-test. The values of p < 0.05 were considered statistically significant. *, **, and *** denote p < 0.05, p < 0.01, and p < 0.001, respectively. NS means non significant
Fig. 4
Fig. 4
DOT1L mediates α-HB-induced H3K79 hypermethylation. a α-HB upregulates H3K79 trimethylation. H3K79 methylation levels were analyzed in HaCaT and HT-3 cells upon 1 mM four LDHA-related metabolite treatments for 24 h. Ctrl, control; α-HB, sodium α-hydroxybutyrate; α-KB, sodium α-ketobutyrate; Lac, sodium l-lactate; Pyr, sodium pyruvate. H3K79 methylation / H3 ratio was quantified. b ROS increase H3K79 trimethylation. H3K79 methylation levels were analyzed in HaCaT and HT-3 cells upon 10 μM H2O2 for 6 h with or without 1 mM NAC pretreatment for 1 h as indicated. H3K79 methylation/H3 ratio was quantified. c E7 expression enhances H3K79 trimethylation. H3K79 methylation levels were analyzed in PHKs and HaCaT cells stably expressing vector or Flag-tagged HPV16/18 E7 coupled with or without 1 mM NAC treatment for 6 h. H3K79 methylation/H3 ratio was quantified. d DOT1L mediates nuclear LDHA-induced H3K79 hypermethylation. HeLa stable cells with LDHA knockdown and Flag-tagged Vec/WT/NLS/NES rescue were treated with or without 3 μM EPZ004777 for 48 h, combined with or without 1 mM sodium α-HB for 48 h as indicated. β-actin and histone H3 used as loading control in all immunoblots. e E7 triggers the binding of DOT1L with LDHA. Endogenous coimmunoprecipitation of DOT1L in HT-3 cells stably expressing vector or HPV16 E7 coupled with or without 1 mM NAC treatment for 6 h, and blotting of LDHA and DOT1L. f ROS trigger the binding of DOT1L with LDHA. Endogenous coimmunoprecipitation of DOT1L in HT-3 cells with or without 10 μM H2O2 for 6 h or 1 mM NAC for 6 h as indicated, followed by blotting with LDHA and DOT1L. g α-HB induces the binding of DOT1L with LDHA. Reversible endogenous coimmunoprecipitation of DOT1L and LDHA in HaCaT and HT-3 cells with or without 1 mM α-HB for 24 h, followed by blotting with LDHA and DOT1L. Results are representative of three independent experiments. All data are shown as mean ± SEM. The p values were determined by two-tailed t-test. The values of p < 0.05 were considered statistically significant. *, **, and *** denote p < 0.05, p < 0.01, and p < 0.001, respectively. NS means non significant
Fig. 5
Fig. 5
NRF2 is required for nuclear LDHA-induced antioxidant responses. a E7 induces the expression of antioxidant and Wnt target genes. qPCR detecting antioxidant and Wnt target genes in vector (treated with or without H2O2) or HPV16 E7-expressing HT-3 cells treated with or without NAC as indicated. b E7 enhances the H3K79 dimethylation level at gene bodies. ChIP-qPCR showing the percentage of H3K79me2 enrichment at SOD1, CAT, CTNNB1, and MYC gene body relative to input genomic DNA in vector or HPV16 E7-expressing HaCaT cells treated with or without NAC. c EPZ004777 blocks increased NQO1 and GCLC gene expression induced by E7 and H2O2. qPCR detecting NQO1 and GCLC genes in vector (treated with or without H2O2) or HPV16 E7-expressing HaCaT cells treated with or without NAC and 3 μM EPZ004777 for 24 h as indicated. d, e NRF2 KO or NRF2 inhibition blocks increased NQO1 and GCLC gene expression induced by E7 and H2O2. qPCR detecting NQO1 and GCLC genes in HeLa NRF2 KO cells treated with or without H2O2 (e), and vector or HPV16 E7-expressing HaCaT cells treated with or without 10 μM ML385 for 24 h (f) as indicated. f LDHA KO decreases NQO1 and GCLC gene expression activated by H2O2. qPCR detecting NQO1 and GCLC genes in HeLa LDHA KO cells upon H2O2 coupled with or without extended NAC treatment as indicated. g LDHA KO attenuates the H3K79 dimethylation level at gene bodies. ChIP-qPCR showing the percentage of H3K79me2 enrichment at SOD1, CAT, CTNNB1, and MYC gene body relative to input genomic DNA in HeLa LDHA KO and NRF2 KO cells treated with or without H2O2. For ChIP-qPCR assay, rabbit IgG was included as a negative control. H2O2 was used as 10 μM for 6 h, and NAC was used as 1 mM for 6 h. Results are representative of three independent experiments. All data are shown as mean ± SEM. The p values were determined by two-tailed t-test. The values of p < 0.05 were considered statistically significant. *, **, and *** denote p < 0.05, p < 0.01, and p < 0.001, respectively. NS means non significant
Fig. 6
Fig. 6
Nuclear LDHA produced α-HB protects cervical cancer cells from oxidative stress. a, b Nuclear LDHA promotes cell growth under oxidative stress. Growth curve of HeLa stable cells with LDHA knockdown and Vec/WT/NLS/NES rescue were measured with or without 10 μM H2O2 treatment. c Nuclear LDHA increases colony formation under oxidative stress. Colony-formation assay of HeLa stable cells treated with or without 10 μM H2O2. d ROS enhance target gene expressions in LDHAWT and LDHANLS but not LDHANES stable cells. qPCR of antioxidant and Wnt target genes in HeLa stable cells with or without 10 μM H2O2 treatment for 6 h. e Nuclear LDHA downregulates cellular ROS level. Cellular ROS were measured in HeLa or HeLa stable cells using the ROS-sensitive fluorescent dye CM-H2DCFDA by flow cytometry. f α-HB balances cellular ROS level in LDHANES stable cells under oxidative stress. Cellular ROS were measured in HeLa LDHANES stable cells treated with 1 mM sodium α-HB supplement for 48 h coupled with or without 50 μM H2O2 treatment for 30 min, using the ROS-sensitive fluorescent dye CM-H2DCFDA by flow cytometry. g α-HB restores gene expressions in LDHANES stable cells under oxidative stress. qPCR of antioxidant and Wnt target genes in HeLa LDHANES stable cells treated with 10 μM H2O2 for 6 h, with or without 1 mM sodium α-HB supplement for 24 h. h α-HB rescues LDHANES cell growth under oxidative stress. Growth curve of HeLa LDHANES stable cells treated with 10 μM H2O2, with or without different dose of sodium α-hydroxybutyrate supplement. i α-HB restores LDHANES colony formation under oxidative stress. Colony-formation assay of HeLa LDHANES stable cells treated with 10 μM H2O2, with or without different dose of sodium α-hydroxybutyrate supplement. For cell proliferation and colony-formation assay, the media were exchanged every 24 h concerned for H2O2 decomposition. Results are representative of three independent experiments. All data are shown as mean ± SEM. The p values were determined by two-tailed t-test. The values of p < 0.05 were considered statistically significant. *, **, and *** denote p < 0.05, p < 0.01, and p < 0.001, respectively. NS means non significant
Fig. 7
Fig. 7
HPV16 E7-induced LDHA nuclear translocation implicates in cervical cancer development. a, b, c LDHANLS increases tumor growth in xenograft nude mice model. Representative images (mouse NO. 1 with Vec on the left flank and WT on the right flank, and mouse NO. 1′ with NLS on the left flank and NES on the right flank) of HeLa LDHA KO with Vec/WT/NLS/NES putback xenograft mice (a). Dissected tumors in xenograft mice transplanted with HeLa LDHA KO with Vec/WT/NLS/NES putback cells (b) and the tumor volumes on day 30 were represented (c). d LDHANLS tumor shows an elevated H3K79me2, NRF2, SOD1, and MYC levels. The level of H3K79me2 and the expression of NRF2, SOD1, and MYC in two pairs of representative tumors were analyzed by western blotting. β-actin and histone H3 were used as loading control. e LDHA nuclear translocation are positively correlated with H3K79 trimethylation in K14-HPV16 transgenic mice. Representative IHC images of HPV16 E7 expression, LDHA localization, and H3K79me3 level at indicated time point in TALEN-mediated targeting E7 of K14-HPV16 transgenic mice. n = 3 per group. Scale bar, 50 μm. f HPV16 E7 levels, LDHA nuclear translocation and H3K79 trimethylation are positively correlated with each other in human cervical tumor tissues. The 52 cases were divided into four groups on the basis of their tumor HPV16 E7 expression scores. Horizontal lines represent the median. Data are shown as mean ± SEM. The p values were determined by two-tailed t-test. The values of p < 0.05 were considered statistically significant. *, **, and *** denote p < 0.05, p < 0.01, and p < 0.001, respectively. NS means non significant. g Proposed molecular mechanism model of a noncanonical role for LDHA in responds to HR-HPV infection. PYR, pyruvate, LAC, lactate, α-KB, α-ketobutyrate, and α-HB, α-hydroxybutyrate

Similar articles

Cited by

References

    1. Ferlay J, et al. Cancer incidence and mortality worldwide: sources, methods and major patterns in GLOBOCAN 2012. Int. J. Cancer. 2015;136:E359–E386. doi: 10.1002/ijc.29210. - DOI - PubMed
    1. Schiffman M, et al. Human papillomavirus testing in the prevention of cervical cancer. J. Natl. Cancer Inst. 2011;103:368–383. doi: 10.1093/jnci/djq562. - DOI - PMC - PubMed
    1. Doorbar J. Molecular biology of human papillomavirus infection and cervical cancer. Clin. Sci. (Lond.) 2006;110:525–541. doi: 10.1042/CS20050369. - DOI - PubMed
    1. Stoler MH, et al. Human papillomavirus type 16 and 18 gene expression in cervical neoplasias. Hum. Pathol. 1992;23:117–128. doi: 10.1016/0046-8177(92)90232-R. - DOI - PubMed
    1. Mirabello L, et al. HPV16 E7 genetic conservation is critical to carcinogenesis. Cell. 2017;170:1164–1174 e1166. doi: 10.1016/j.cell.2017.08.001. - DOI - PMC - PubMed

Publication types

MeSH terms