. 2018 Nov;563(7732):514-521.
doi: 10.1038/s41586-018-0650-9. Epub 2018 Oct 24.

Mechanoresponsive stem cells acquire neural crest fate in jaw regeneration

Affiliations

Mechanoresponsive stem cells acquire neural crest fate in jaw regeneration

Ryan C Ransom et al. Nature. 2018 Nov.

Abstract

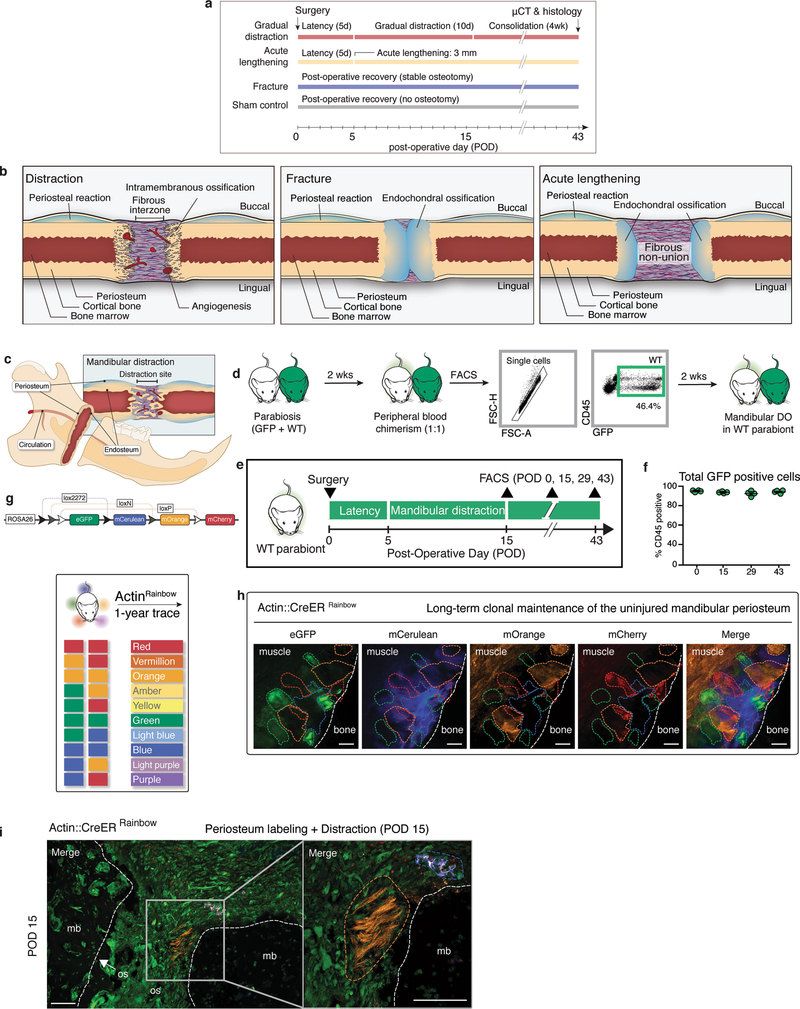
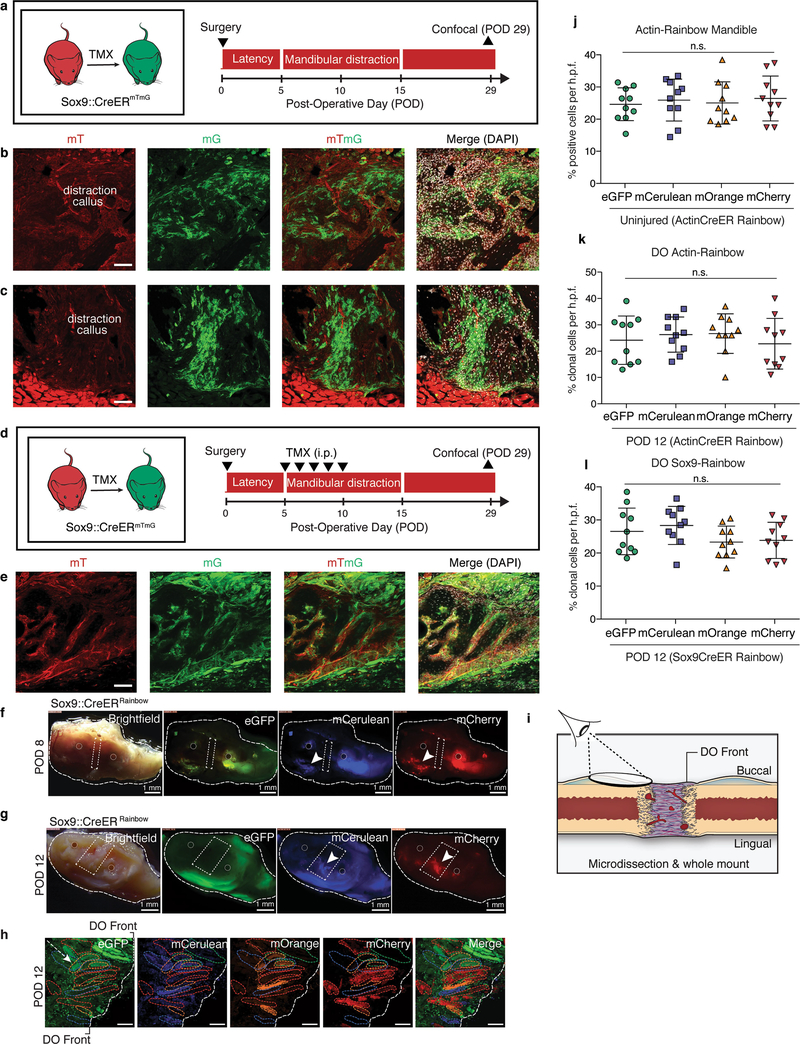
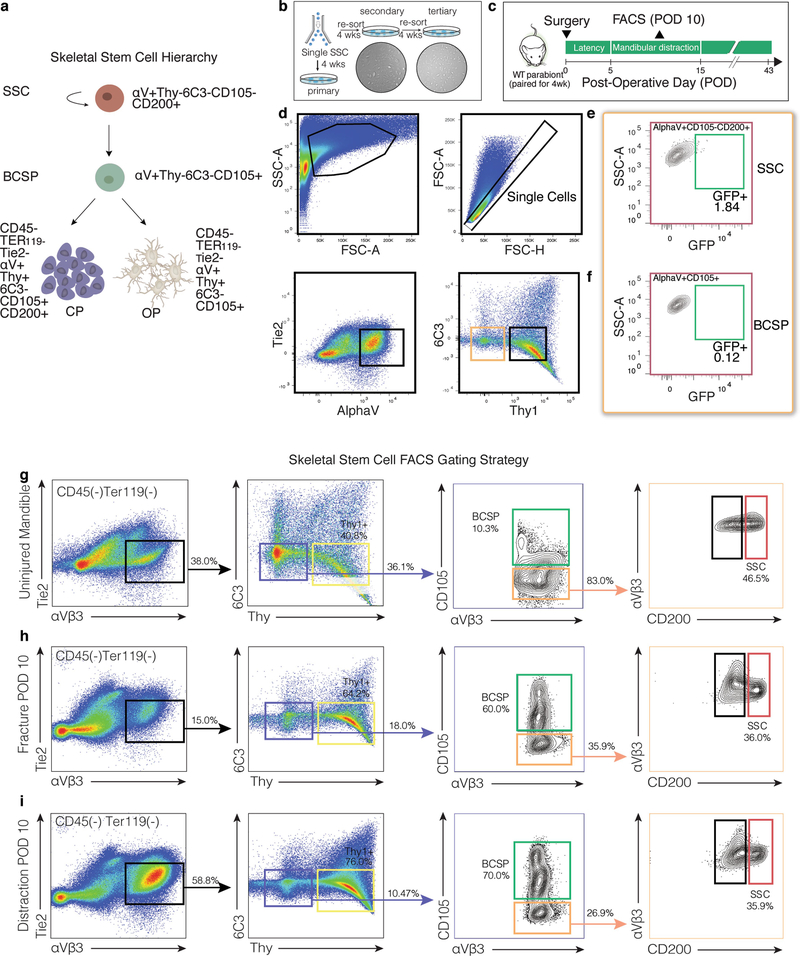
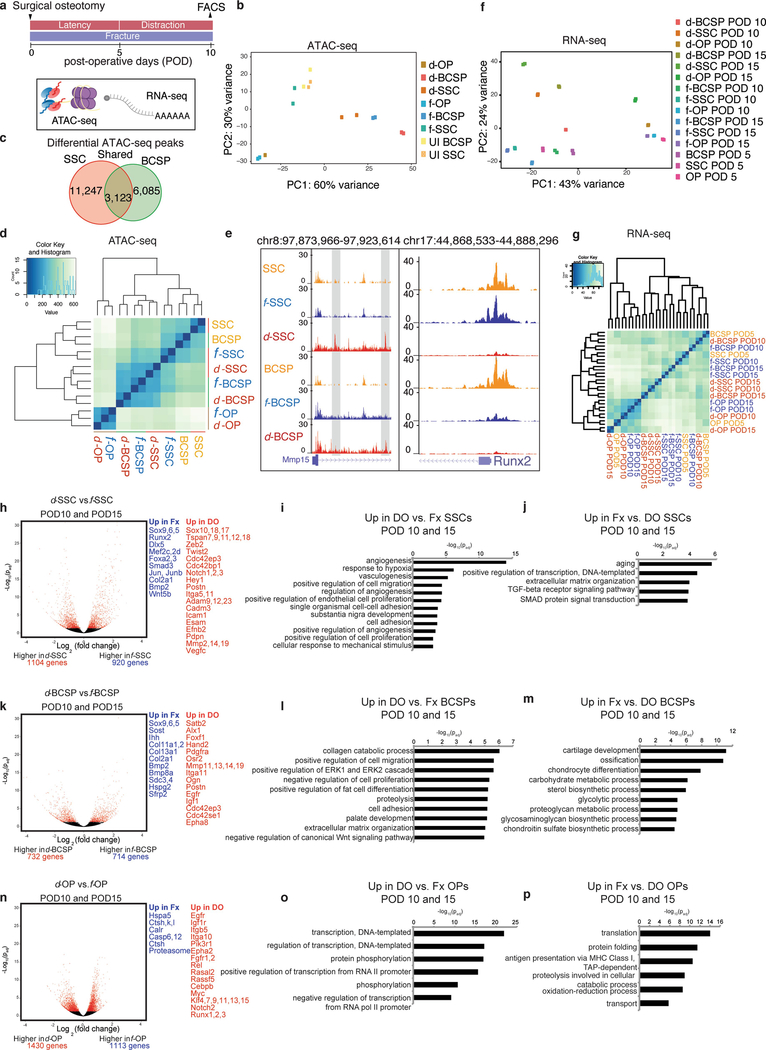
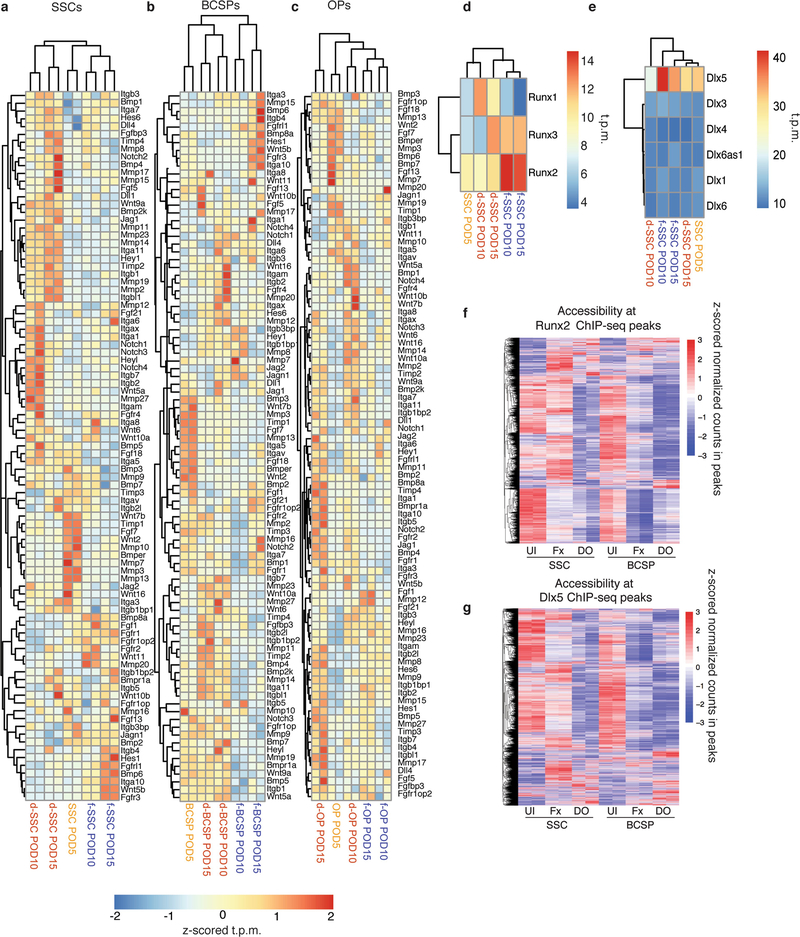
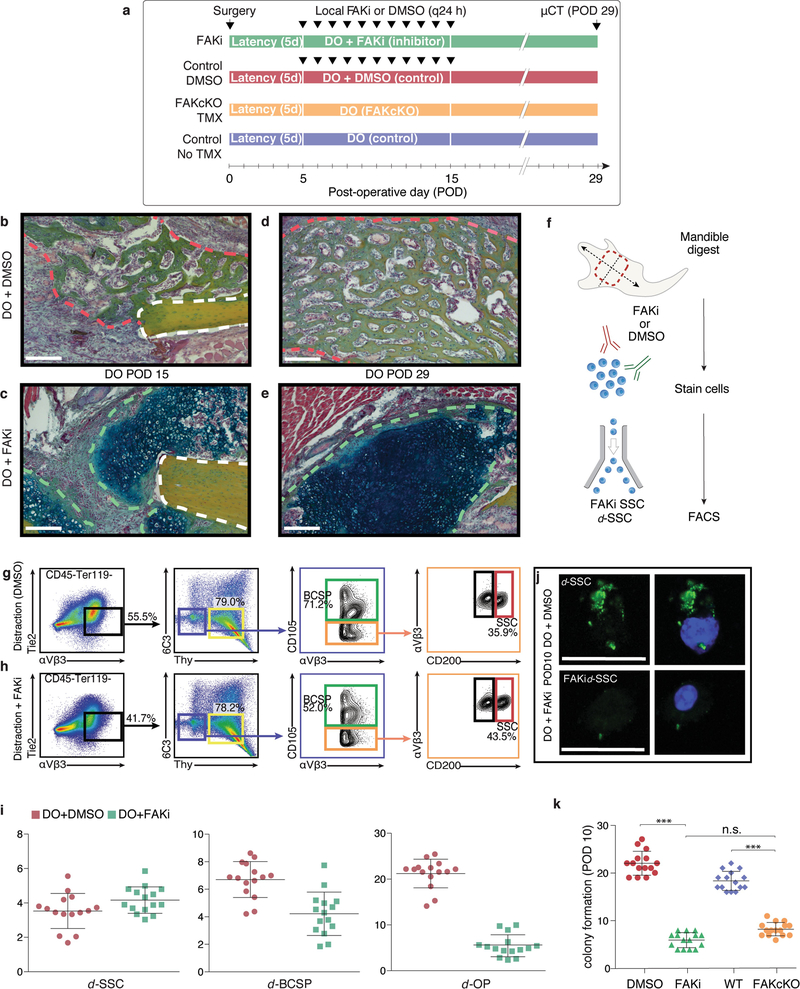
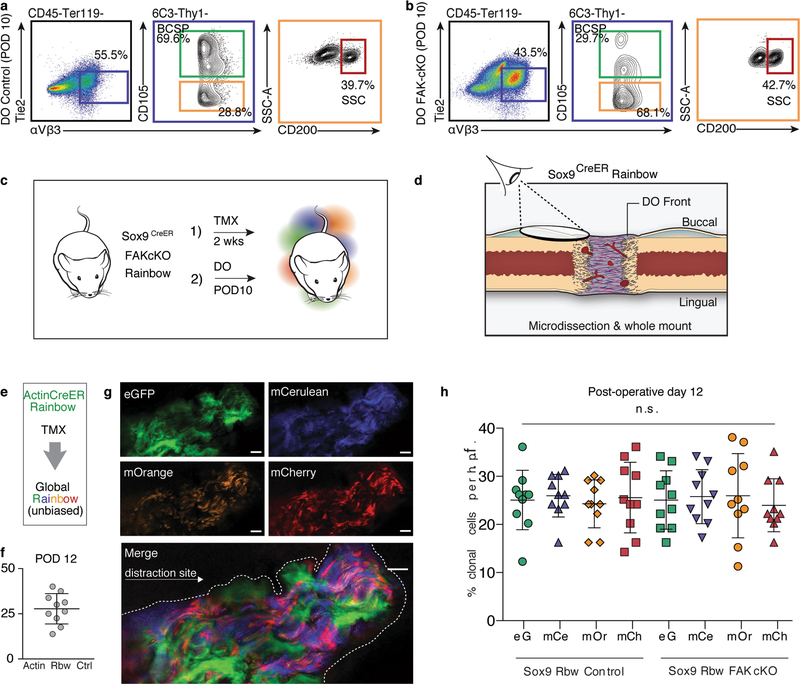
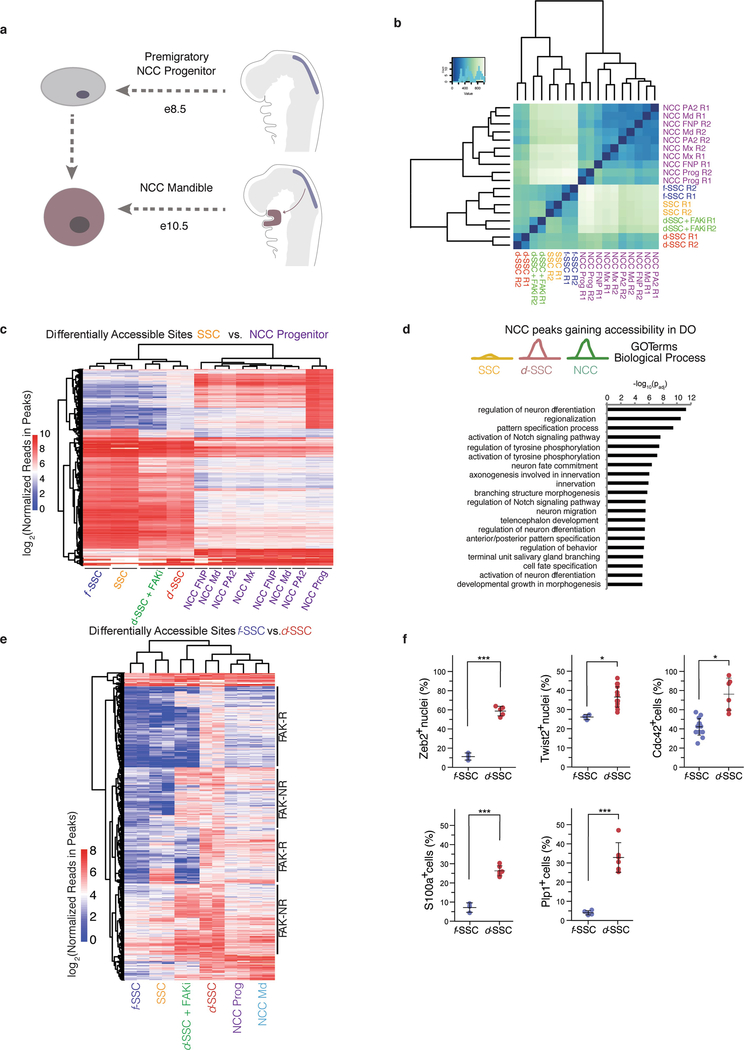
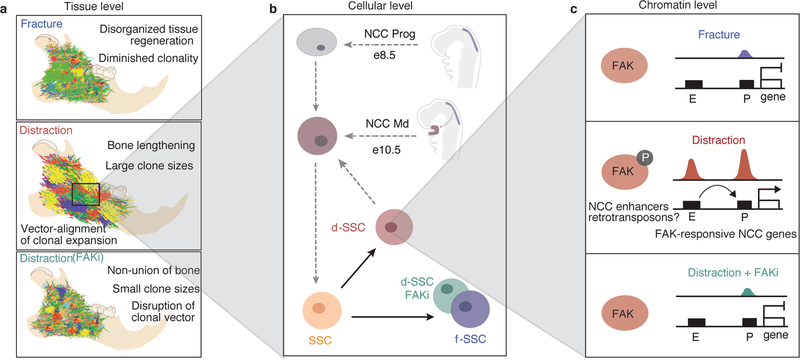
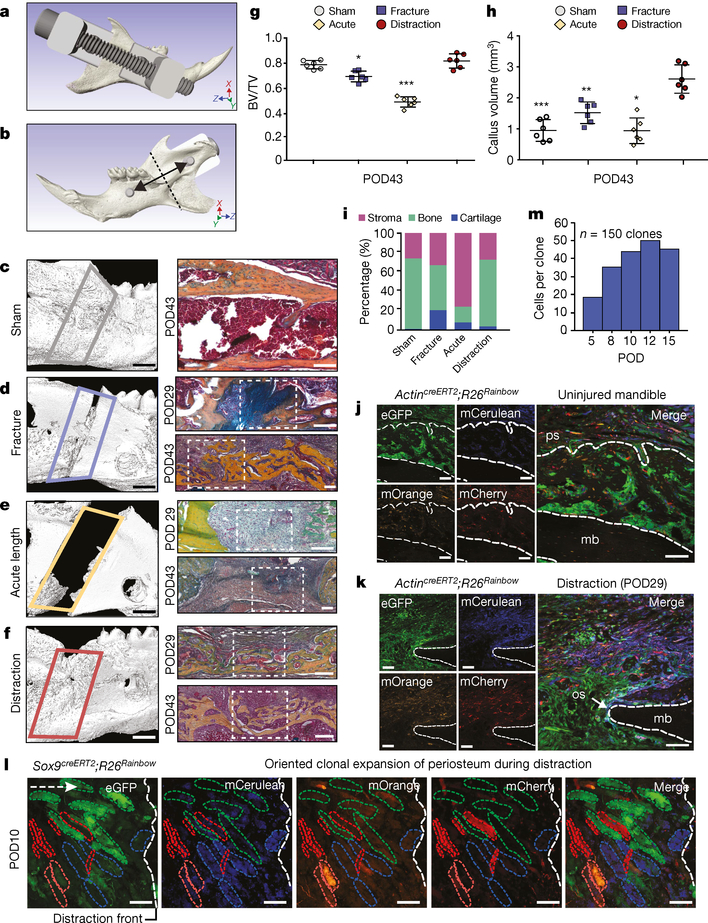
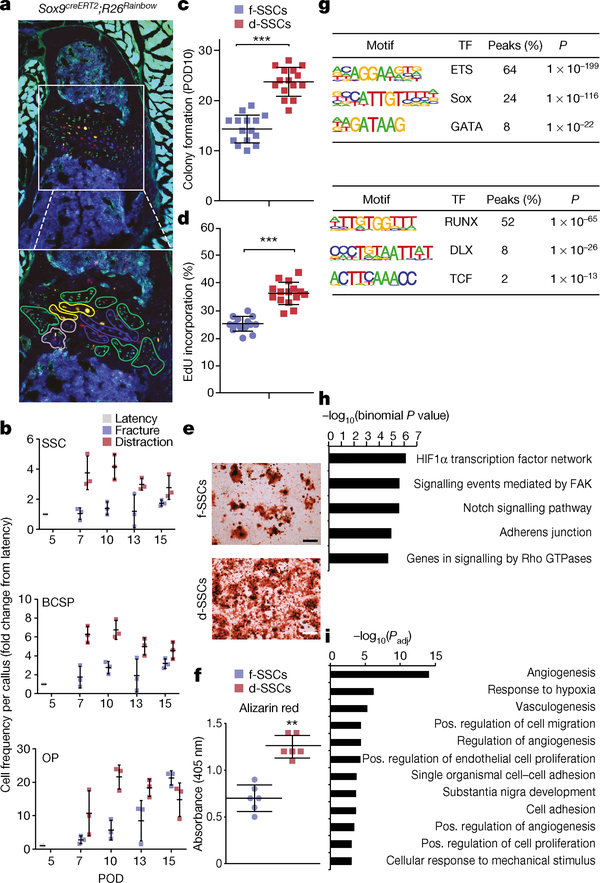
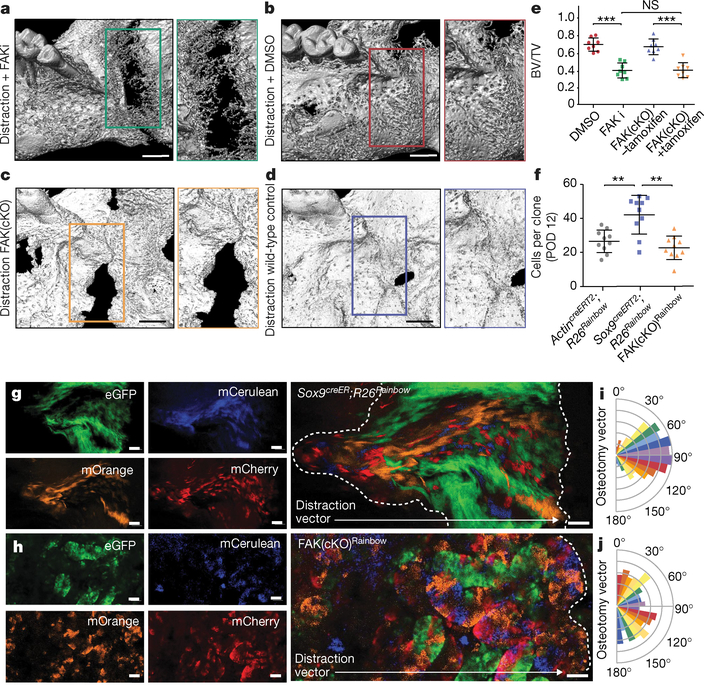
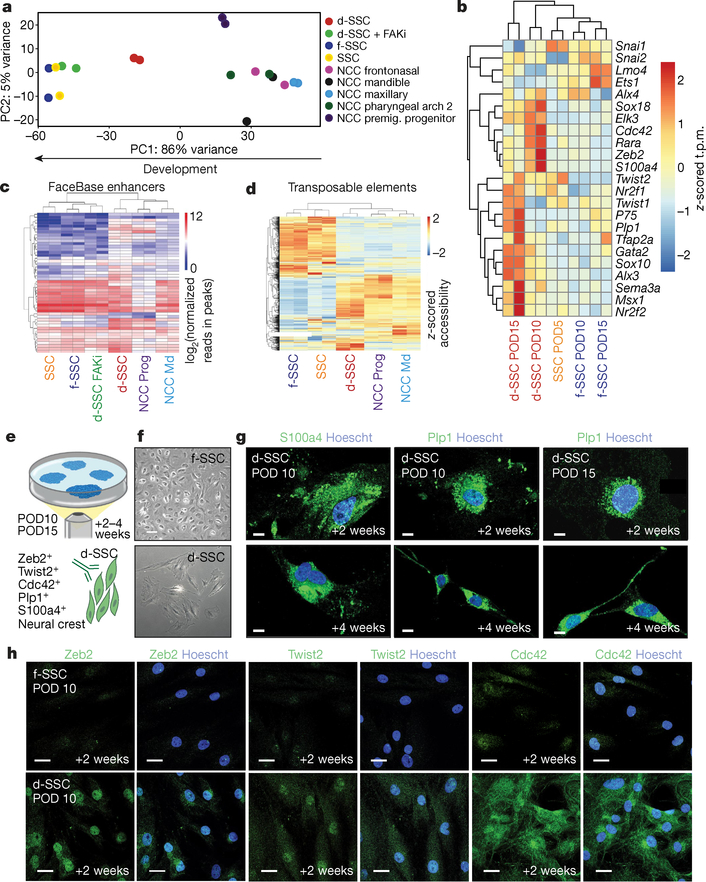
During both embryonic development and adult tissue regeneration, changes in chromatin structure driven by master transcription factors lead to stimulus-responsive transcriptional programs. A thorough understanding of how stem cells in the skeleton interpret mechanical stimuli and enact regeneration would shed light on how forces are transduced to the nucleus in regenerative processes. Here we develop a genetically dissectible mouse model of mandibular distraction osteogenesis-which is a process that is used in humans to correct an undersized lower jaw that involves surgically separating the jaw bone, which elicits new bone growth in the gap. We use this model to show that regions of newly formed bone are clonally derived from stem cells that reside in the skeleton. Using chromatin and transcriptional profiling, we show that these stem-cell populations gain activity within the focal adhesion kinase (FAK) signalling pathway, and that inhibiting FAK abolishes new bone formation. Mechanotransduction via FAK in skeletal stem cells during distraction activates a gene-regulatory program and retrotransposons that are normally active in primitive neural crest cells, from which skeletal stem cells arise during development. This reversion to a developmental state underlies the robust tissue growth that facilitates stem-cell-based regeneration of adult skeletal tissue.


Conflict of interest statement

Competing interests The authors declare no competing interests.

Figures

Extended Data Fig. 1 |
Extended Data Fig. 1 |. Analysis of tissue sources of regeneration in distraction
a, Experimental timeline of distraction model. b, Illustration of the tissue response (at POD15) in the mouse model of mandibular distraction (left), fracture (middle) and acute lengthening (right). c, Putative cellular sources of bone regeneration in mandibular distraction, including periosteum, endosteum and circulating progenitors. d, Experimental scheme for detecting circulating progenitor cells in mandibular distraction. GFP mice are surgically fused to their wild-type (WT) littermates through parabiosis. Peripheral blood chimaerism is confirmed via flow cytometry. After GFP-positive cells are confirmed in the WT through FACS, mandibular distraction is performed on the WT parabiont. FSC-A, forward scatter area; FSC-H, forward scatter height. e, Upon detection of 1/1 blood chimaerism, WT parabionts undergo mandibular distraction according to the timeline outlined. f, Quantification of the haematopoietic fraction of GFP-positive cells obtained from distraction calluses (n = 4 biological replicates per time point). g, Representation of the Rainbow reporter construct at the R26 locus and the colours produced by random recombination. h, One-year tracing of mandibles under normal homeostasis (uninjured), with confocal micrographs of whole-mount periosteum one year after recombination. Clones are shown with coloured dotted outlines. The white dotted line demarcates skeletal muscle (upper left quadrant) from the periosteum. The view is a buccal-to-lingual view of the posterior periosteum overlying the body of the mandible. n = 50 clones, with 16–151 cells per clone. i, Confocal micrograph of the transverse mandible section from a Rainbow mouse at POD15 after targeted labelling of the periosteum for subsequent mandibular distraction (n = 8). Coloured outlines indicate single clones; the white dotted outline indicates mandibular bone (mb) at the distraction site. n refers to the number of animals in each independent experiment.
Extended Data Fig. 2 |
Extended Data Fig. 2 |. Skeletal lineage tracing demonstrates labelling of bone regenerate in mandibular distraction
a, Experimental scheme for using tamoxifen (TMX; administered at 9 weeks of age, before surgery at 10 weeks) to induce recombination in Sox9creERT2;R26mT/mG mice to carry out skeletal lineage tracing, with isolation of mandibles at POD29 (n = 6). b, Confocal micrograph (lingual mandible) of the distraction callus in Sox9creERT2;R26mT/mG mice after TMX induction. Filters are shown in the following order from left to right: mT (mTomato, background), mG (mGFP, Sox9 lineage), mTmG (merged) and merged (mTmG with DAPI) (n = 6). c, As for b, but for the buccal mandible. d, Experimental scheme for tamoxifen induction of Sox9creERT2;R26mT/mG mice during the early phase of distraction (POD5–10) for lineage tracing of Sox9+ cells during distraction. Mandibles were isolated at POD29 for confocal microscopy (n = 4). i.p., intraperitoneal. e, Confocal micrographs showing the contribution of the skeletal lineage (mGFP, Sox9 lineage) to new bone formed in mandibular distraction. f, Low-magnification images of the Sox9creERT2;R26Rainbow mandible during distraction at POD8, including bright-field, eGFP, mCerulean and mCherry filters under a dissection microscope. The induced Rainbow-coloured clones (white arrowheads) are anterior and posterior to the site of distraction (dotted white box) between the pin holes (dotted white circles) (n = 8). g, As for f, but for POD12. h, As for Fig. 1l, but for POD12 (n = 5). i, Schematic showing the vantage point for clonal analysis of the skeletal-lineage (Sox9creERT2;R26Rainbow) contribution to regeneration during distraction, through the use of whole-mount specimens from mandibular callus microdissection. DO, distraction osteogenesis. j–l, Quantification of clones (whole-mount imaging) that are positive for each fluorophore per high-pass filter (h.p.f.; ×40 magnification) two weeks after tamoxifen induction (one injection per day, five days total) plus distraction until POD12 using ActincreERT2;R26Rainbow mice (j, k) and Sox9creERT2;R26Rainbow mice (l). Means ± s.d. are shown Scale bars, 200 μm (b, c, e), 1 mm (f). n refers to the number of animals in each independent experiment.
Extended Data Fig. 3 |
Extended Data Fig. 3 |. Dynamics of SSCs and progenitor cells in parabiosis and distraction
a, The skeletal stem cell lineage, showing the immunological phenotype of each cell. CP, chondroprogenitor; OP, osteoprogenitor. b, FACS isolation of single SSCs for evaluation of serial colony-forming potential in vitro. Secondary (left) and tertiary (right) colonies are shown. c, Experimental scheme for detecting circulating cells in mandibular distraction at POD10. d, FACS gating of Thy16C3 cells (light brown box) for detection of circulating SSCs (green box in e) and progenitor cells (green box in f) in mandibular distraction. e, FACS gating shows an absence of circulating (GFP+) SSCs in mandibular distraction (n = 8; mean = 2.02 ± 0.78). f, As for e, but for BCSPs (n = 8; mean = 1.83 ± 0.91). g–i, FACS isolation from uninjured (g; 38.0% αVβ3-positive events within the gate) versus fracture (h; 15.0%) and distraction (i; 58.8%) conditions reveal expansion of the SSC hierarchy (left column) in response to distraction by POD10. Representative of three independent experiments. n refers to the number of animals in each independent experiment.
Extended Data Fig. 4 |
Extended Data Fig. 4 |. Changes in gene regulation in response to distraction
a, Schematic showing FACS isolation of stem and progenitor cells from uninjured, fractured and distracted mandibles for ATAC-seq (assay for accessibility of chromatin, which is shown with purple spheres and yellow lines, to depict nucleosomes) and RNA-seq (shown with a polyA strand). Samples were collected in duplicate for ATAC-seq at POD10 and in duplicate for RNA-seq at PODs 5, 10 and 15. b, PCA showing PC1 and PC2 for all ATAC-seq data (n = 164,266 peaks). UI, uninjured. c, Venn diagram showing the number of differential peaks between the fracture and diffraction conditions in both SSCs and BCSPs. Overlap between these (shared peaks; twofold change with P < 0.05 in both SSCs and BCSPs) is shown in the centre. d, Cluster dendrogram for ATAC-seq, showing clustering of samples based on all ATAC-seq peaks from SSCs, BCSPs and OPs. e, Example loci (Mmp15 and Runx2, with their locations on chromosomes 8 and 17, respectively, shown at the top), revealing accessibility that is distraction-specific (Mmp15) and fracture-specific (Runx2), respectively. The height of the genome browser tracks shows the number of reads normalized by read depth and overall peak enrichment in the library. f, PCA showing PC1 and PC2 for all RNA-seq data at PODs 5,10 and 15 (n = 17,491 genes). g, Cluster dendrogram for RNA-seq, showing clustering of samples based on all genes from SSCs, BCSPs and OPs on PODs 5, 10 and 15. h, Volcano plot showing differential gene expression between d-SSCs at PODs 10 and 15 and f-SSCs at PODs 10 and 15. Red dots represent genes that are significantly differentially expressed with an adjusted P-value cut-off of 0.05 (DESeq2). Differentially expressed genes that are upregulated in f-SSCs (Fx) are shown in blue (fold change greater than 1.5; Padj less than 0.05), and differentially expressed genes that are upregulated in d-SSCs (DO) are shown in red. i, Significantly enriched GO terms for genes upregulated in d-SSCs at PODs 10 and 15, from GREAT version 3.0.0, with P values (one-sided binomial) corrected using the Benjamini–Hochberg correction. j, Significantly enriched GO terms for genes upregulated in f-SSCs at PODs 10 and 15 from GREAT, with P values (one-sided binomial) corrected using the Benjamini–Hochberg correction. k, As for h, but for BCSPs. l, As for i, but for BCSPs. m, As for j, but for BCSPs. n, As for h, but for OPs. o, As for i, but for OPs. p, As for j, but for OPs.
Extended Data Fig. 5 |
Extended Data Fig. 5 |. Expression of core signalling genes during distraction
a, Heat map showing the expression of Wnt, Notch, bone morphogenetic protein (BMP) and FGF family members, as well as integrins, matrix metalloproteinases (MMPs) and tissue inhibitors of metalloproteinases (TIMPs), in SSCs. Values from RNA-seq in transcripts per million (t.p.m.) are z-scored for each gene to reflect differences across conditions and time. Only genes that are expressed (t.p.m. > 3) in at least one sample are shown. b, As for a, but for BCSPs. c, As for a, but for OPs. d, Heat map showing expression (in t.p.m.) of Runx-family transcription factors in POD5 SSCs, and in POD10 and POD15 f-SSCs and d-SSCs. e, As for d, but for Dlx-family transcription factors. f, Heat map showing accessibility from ATAC-seq in SSCs and BCSPs at Runx2 chromatin immunoprecipitation (ChIP)-seq peaks from MC3T3 preosteoblasts;12,673 binding sites from ChIP-seq are shown. Plotted are the row z-scored normalized counts from SSC and BCSP ATAC-seq data. g, As for f, but for Dlx5 ChIP-seq data. ChIP-seq binding sites (24,365) from MC3T3 preosteoblasts are shown.
Extended Data Fig. 6 |
Extended Data Fig. 6 |. Expansion of SSCs and progenitor cells depends on FAK
a, Timeline for FAK inhibition and conditional genetic knockout during distraction, with respective control conditions, for μCT analysis (Fig. 3a–d) at mid-consolidation (POD29). b, Pentachrome staining of transverse section from mandibles treated with DMSO during distraction osteogenesis and collected at POD15. The white dotted line indicates cortical bone at the osteotomy site; the red dotted line indicates bone that newly formed in response to distraction. Representative of three independent replicates. c, As for b, but for FAKi treatment. The green dotted line indicates cartilage that newly formed in response to FAKi during distraction osteogenesis. d, As for b, but for POD29. e, As for c, but for POD29. f, Schematic showing FACS isolation of SSCs and BCSPs from mandible calluses for subsequent in vitro analyses. g, h, FACS isolation of SSCs and BCSPs from distraction control mandibles receiving DMSO injections (g; 55.5%) versus FAK-inhibitor injections (FAKi) (h; 41.7%), revealing diminished expansion of the SCC hierarchy (first column, black gate) in response to FAK inhibition by POD10. The ratio of SSCs (red gate) to their committed bone progenitors (BCSPs, green gate) during distraction was substantially disrupted by FAK inhibition, such that the proportion of SSCs was higher. Representative of three independent replicates. i, Quantification of the frequency of d-SSCs, d-BCSPs and d-OPs within mandibular calluses collected at POD10 after FAKi or control injections (n = 6; error bars indicate s.d. from the mean). j, Representative fluorescence micrographs showing phosphorylated-FAK activity (left column, green) in d-SSCs after treatment with DMSO (top) or with FAK inhibitor (bottom). Right column, phospho-FAK fluorescence merged with DAPI fluorescence. Representative of three independent replicates. k, Quantification of d-SSC colony formation in vitro in response to FAKi and in a FAK(cKO), compared with their respective control conditions (n = 15 per condition; ***P < 0.001, Tukey’s multiple comparisons; means ± s.d.). Direct comparison of colony formation in FAKi and FAK(cKO) conditions was not significantly different. n refers to the number of animals in each independent experiment.
Extended Data Fig. 7 |
Extended Data Fig. 7 |. Cellular dynamics during distraction osteogenesis in FAK(cKO) mice
a, b, FACS isolation of cells from control mice (a, Sox9creERT2;Ptk2fl/fl, no TMX) and FAK(cKO) mice (b, Sox9creERT2;Ptk2fl/fl, TMX treatment) shows that the SSC hierarchy (first column, black gate) is disrupted similarly in FAK(cKO) mice and in FAKi (Extended Data Fig. 6h). In the FAK(cKO) mice, the proportion of downstream multipotent BCSPs (green gate) compared with SSCs (orange and red gates) is lower than in controls. Representative of three independent replicates. c, Experimental strategy for clonal analysis of FAK(cKO) Rainbow contribution to regeneration in response to distraction, using whole-mount specimens from callus microdissection of mandibles in Sox9creERT2;R26Rainbow mice. d, Vantage point for the acquisition of the confocal images of whole-mount specimens shown in Fig. 3g, h. e, Experimental strategy for clonal analysis in ActincreERT2;R26Rainbow mice. f, Quantification of average clone size at POD12 during distraction osteogenesis in ActincreERT2;R26Rainbow mice (n = 10; mean ± s.d.). g, Whole-mount imaging at the site of distraction at POD12 in ActincreERT2;R26Rainbow mice. The view is a lateral-to-medial view of callus overlying the distraction site (indicated by the white dotted outline overlying the distraction gap). The distraction gap contains large clones with a migratory spreading phenotype (n = 4 for each of three independent replicates). h, Quantification of clones (whole-mount imaging) that are positive for each fluorophore per h.p.f. (×40 magnification) two weeks after tamoxifen induction (one injection per day, five days total) plus distraction until POD12, using Sox9creERT2;R26Rainbow mice (left) and FAK(cKO)Rainbow mice (right) (n = 10; mean ± s.d.). n refers to the number of animals in each independent experiment.
Extended Data Fig. 8 |
Extended Data Fig. 8 |. Involvement of neural crest transcription factors in SSCs during distraction
a, Motifs enriched in FAK-R and FAK-NR sites in SSCs and BCSPs. The size of each diamond represents the negative P value for enrichment (one-sided binomial, Benjamini–Hochberg correction); colours represent the percentage of sites in target/percentage of sites in background. b, Heat map showing expression of Sox-family transcription factors. Colours represent z-scored t.p.m. values from RNA-seq at PODs 5, 10 and 15 for d-SSCs and f-SSCs. Only factors with t.p.m. greater than or equal to 3 in at least one sample are shown. c, As for b, but for Ets-family transcription factors. d, The Sox10 locus (with its location on chromosome 15 shown at the top), showing accessibility at the promoter that is distraction-specific (red), congruent with the expression data in b and the RNA-seq track below. The signal for tracks is normalized by read depth and overall peak enrichment in the library. Tracks are representative of two biological replicates. e, Experimental scheme for tamoxifen induction of Sox10creERT2;R26mT/mG mice during the early and mid-distraction phase (POD5–10) to trace the Sox10+ lineage in a distraction-specific context. Mandibles were collected for confocal microscopy at POD29 (n = 4). f, Confocal micrograph of Sox10creERT2;R26mT/mG mandible at POD29, demonstrating the capability of Sox10+ cells to give rise to the distraction regenerate. Filters are, from left to right, mT (mTomato, background), mG (mGFP, Sox10+ lineage), mTmG (merged) and merged (mTmG with DAPI). g, Confocal micrograph of Sox10creERT2;R26mT/mG mandible at POD29, showing the presence of Sox10-lineage cells within surrounding callus and periosteum to give rise to the regenerate. Scale bars, 200 μm (b, c). n refers to the number of animals in each independent experiment.
Extended Data Fig. 9 |
Extended Data Fig. 9 |. NCC transcriptional networks in d-SSCs
a, Diagram showing the developmental origin of NCC-derived SSCs. e, embryonic day of development. b, Clustering of SSC and NCC samples using all accessible sites in SSCs and NCCs merged. c, Heat map showing all accessible sites that are significantly differentially accessible between uninjured SSCs and NCC progenitors. Colour represents the log2-transformed normalized read counts within peak regions. d, GO terms enriched in sets of genes near peaks that are more accessible in NCC and d-SSCs than in uninjured SSCs. GO terms shown are those that are significantly enriched after false discovery rate correction in GREAT (two-sided binomial P value shown). e, Heat map showing all accessible sites that are differentially accessible between f-SSCs and d-SSCs. The sites that are FAK-R or FAK-NR are highlighted along the right. Colour represents the log2-transformed normalized read counts within peak regions. f, Quantification of immunofluorescence staining for each of the NCC markers observed on RNA-seq analysis and evaluated in this figure, including nuclear Zeb2 (n = 15, ***P < 0.001), nuclear Twist2 (n = 15, *P < 0.05), Cdc42 (n = 6, P < 0.05), S100a (n = 6, ***P < 0.001) and Plp1 (n = 6, ***P < 0.001) (Student’s t-test; shown are means ± s.d.). n refers to the number of animals in each independent experiment.
Extended Data Fig. 10 |
Extended Data Fig. 10 |. Controlled mechanical advancement of the lower jaw unlocks neural crest potential for regeneration of the mandible
a, At the tissue level, clonality within the mandible during distraction (middle) is observed to occur in a highly linear and directional manner in parallel to the vector of distraction. By contrast, clonality observed in fracture (top) and distraction plus FAKi (bottom) was highly mesenchymal with less apparent organization in its morphology, indicating a nondirectional clonal proliferation. b, The cellular level: the developmental origin of the NCC-derived SSCs of the mandible (top), and the postnatal SSCs of the mandible (bottom) that are present in our experiments. During distraction the d-SSC (shown in pink) demonstrates plasticity and takes on an NCC- derived signature, whereas the f-SSC (purple) retains its postnatal SSC characteristics with no NCC signature. In the absence of FAK signalling, the d-SSC FAKi (green) reverts functionally and epigenomically to the fracture state without emergence of the NCC signature. ‘NCC Prog’ indicates the premigratory (e8.5) NCC progenitor population; ‘NCC Md’ indicates the postmigratory (e10.5) NCC population arriving within the mandible. c, At the chromatin level, distraction induces a gain in accessibility at promoters (P) of FAK-responsive NCC craniofacial genes through the activation of their enhancers (E), with a parallel gain in accessibility of retroviral elements near NCC-specific craniofacial enhancers. Thus mechanotransduction during mandible distraction unlocks FAK-responsive craniofacial enhancers, potentially through retrotransposons, enacting a developmental NCC program in d-SSCs similar to that of the e10.5 NCC Md population (b). This does not occur under fracture conditions (top) or during distraction plus FAKi (bottom). These differential epigenomic responses correlate with the degree of clonality and patterning seen in Rainbow mice (a) that occurs in response to distraction. Circled P represents phosphorylation.
Fig. 1 |
Fig. 1 |. Tissue-resident stem and progenitor cells enact bone regeneration in distraction osteogenesis
a, Computer-assisted design of a distraction device using 3D μCT of the C57BL/6 mouse hemimandible. b, The lingual aspect illustrates the location of the osteotomy (dotted line), perpendicular to the vector of bidirectional distraction (solid arrow). c, Three-dimensional μCT of a sham-operated mandible (left, lateral view), with pentachrome staining of a transverse section (right) at POD43. The outlined area (left) indicates the volume analysed for new bone formation (n = 5). d, As for c, but for a fractured mandible, and also showing POD29. The white dotted lines indicate the osteotomy area. e, As for d, but for an acutely lengthened mandible. f, As for d, but for a gradually distracted mandible. g, Quantification of bone volume/total tissue volume (BV/TV) analysed at POD43 from μCT (n = 6, *P ≤ 0.05, ***P ≤ 0.001; Tukey’s multiple comparisons). h, Quantification of new bone callus volume formed at POD43 (n = 6, *P ≤ 0.05, **P ≤ 0.01, ***P ≤ 0.001; Tukey’s multiple comparisons). i, Tissue fraction of bone, cartilage and stroma from pentachrome histology at POD43 (n = 6). j, Confocal micrographs of uninjured transverse mandible sections after one week (n = 4). Uninjured mandibular bone (mb) is between the dotted lines. eGFP, enhanced green fluorescent protein; mCerulean, membrane cerulean (blue fluorescence signal); mCherry, membrane cherry (red fluorescence signal); mOrange, membrane orange (orange fluorescence signal); ps, periosteum. k, As for j, but for POD29 of distraction osteogenesis (n = 4). The dotted outline indicates the mandibular bone at the distraction site. os, osteotomy site. l, Confocal micrographs of whole-mount periosteum at POD10 (clones are indicated by coloured dotted outlines) (n = 5). The vector of distraction is indicated by the dotted white arrow (left). Buccal to lingual view of periosteal callus overlying the distraction sites. m, Quantification of average clone size within the regenerate during distraction (POD5–15; n = 5). Scale bars, 1 mm (cf left), 200 μm (cf right, jl).
Fig. 2 |
Fig. 2 |. Transcriptional regulation underlying SSC function
a, Top, confocal micrograph of a transverse section from a Sox9creERT2;R26Rainbow mandibular condyle (n = 6); bottom, expanded image of the area in the white box. Coloured outlines indicate single-colour clones. b, Quantification of cellular frequency within mandibular calluses in fracture and distraction conditions (n = 3 per time point; boundaries indicate standard deviation (s.d.)). c, Quantification of colonies formed from f- or d-SSCs isolated at POD10 (n = 15, ***P < 0.0001; t-test). d- (n = 15, **P < 0.01) and f- (n = 15, *P < 0.05) SSCs demonstrated elevated colony-forming capacity compared with uninjured SSCs (n = 6). d, Quantification of proliferation rate via incorporation of 5-ethynyl-2′-deoxyuridine (EdU) into SSCs at POD10 (n = 15, ***P < 0.0001; t-test). e, f, Alizarin red staining of f- versus d-SSCs (n = 6, **P = 0.001; t-test) at POD10. g, Motif analysis for differential peaks shared between SSCs and BCSPs. Top, chromatin sites that are more accessible in distraction than in fracture (n = 1,617 sites). Bottom, sites that are more accessible in fracture than in distraction (n = 1,506 sites). The top three motifs and the transcription factors (TFs) that bind them, the percentage of sites that contain the motif and the one-sided binomial P-values with Benjamini–Hochberg corrections are shown. h, GO terms, identified by ATAC-seq, enriched for genes near peaks that are more accessible in d- than in f-SSCs and BCSPs (n = 1,617 sites). Selected GO terms (right) with significant P-values (one-sided binomial, with Benjamini–Hochberg corrections; left) are shown. i, GO terms enriched for genes upregulated in d- versus f-SSCs at PODs 10 and 15, identified by RNA-seq. Select GO terms with significant P-values (one-sided binomial, with Benjamini–Hochberg corrections) are shown. Scale bars, 200 μm (a, e).
Fig. 3 |
Fig. 3 |. FAK inhibition disrupts bone formation during distraction
a, Three-dimensional μCT of a distracted mandible treated with FAK inhibitor (FAKi) during distraction osteogenesis, collected at POD29. An absence of bone union is indicated by the green outline (with high magnification shown at the right). The view is a lingual aspect. n = 5. b, As for a, but using dimethylsulfoxide (DMSO) as a control in place of the FAK inhibitor. c, As for a, but using conditional FAK knockout (FAK(cKO)) animals treated with tamoxifen two weeks before distraction. d, As for a, but using wild-type animals and a corn-oil control treatment. e, BV/TV analysed at POD29 (n = 8, ***P ≤ 0.001; NS, not significant; Tukey’s multiple comparisons). f, Quantification of average clone size within the regenerate over the course of distraction (POD12) in ActincreERT2;R26Rainbow, Sox9creERT2;R26Rainbow, and FAK(cKO)Rainbow mice (n = 10 per condition; Tukey’s multiple comparisons). g, Lateral to medial view of the callus overlying the distraction site. Confocal micrographs of whole-mount Sox9creERT2;R26Rainbow periosteum at POD12 (the white dotted outline shows the distraction gap; n = 6). h, As for g, but for FAK(cKO)Rainbow mandible. i, Quantification of angular clonal expansion in Sox9creERT2;R26Rainbow mice at POD12. j, As for i, but for FAK(cKO)Rainbow mice. Scale bars, 1 mm (ad), 200 μm (g, h).
Fig. 4 |
Fig. 4 |. Changes in chromatin state during distraction osteogenesis with FAK inhibition
a, Heat map showing differential peaks (log2(normalized reads in peaks)) between SSCs, f-SSCs and d-SSCs. k-means clusters are indicated by coloured bars at the left. Enriched GO terms for each cluster are shown at the right. b, Graphical demonstration of FAK-R sites. c, Pie charts showing the proportion of accessible sites that are FAK-R in SSCs and BCSPs. For SSCs, 4,432/9,937 sites (44.6%) that are more accessible in the distraction condition than in the fracture condition are FAK-R, versus 167/4,523 sites (3.7%) in the fracture condition (P < 1 × 10⁻¹⁶; one-sided Fisher’s exact test). For BCSPs, 1,738/4,883 sites (35.6%) that are more accessible in distraction are FAK-R, versus 495/4,415 sites (11.2%) that are more accessible in the fracture condition (P < 2.2 × 10⁻¹⁶; one-sided Fisher’s exact test). d, Genomic enrichment for peaks in five categories of SSC: R, FAK-R; NR, FAK-NR; DO, distraction osteogenesis; Fx, fracture; and FAKi. e, Expression of Sox9, Sox10 and Sox18 as determined by RNA-seq in d- and f-SSCs from PODs 5, 10 and 15. The y-axis shows the average t.p.m. (transcripts per million) from two biological replicates. All genes are significantly differentially expressed (P < 0.05, from DESEq2; see Methods) between the fracture and distraction conditions at at least one time point. f, Confocal micrographs of a distraction regenerate in a Sox10creERT2;R26mT/mG mandible collected at POD29 (the area of new bone is outlined with the dotted white lines). mTomato, background; mGFP, Sox10-expressing lineage; white, 4′,6-diamidino-2-phenylindole (DAPI) staining. Representative of three independent experiments. Scale bar, 200 μm.
Fig. 5 |
Fig. 5 |. SSCs adopt an NCC-like state during distraction
a, Principal component analysis (for principal components (PC) 1 and 2) of ATAC-seq data from SSCs and NCCs (n = 269,900 peaks). The arrow at the bottom shows the direction of cellular differentiation from NCC to SSC. b, Heat map of neural crest gene expression in d- and f-SSCs at PODs 5,10 and 15. The z-scored t.p.m. refers to the number of standard deviations from the mean for each t.p.m. value in a sample. P75 is also known as Ngfr. c, Accessibility at mouse neural crest enhancers (from FaceBase,) at neural crest genes. Shown are log2(reads in peaks) for ATAC-seq peaks that overlap the annotated enhancers. d, Heat map of z-scored accessibility at all families of transposable elements from ATAC-seq data. e, Schematic showing f- or d-SSC culture and staining from postoperative mandibles. FACS-isolated f-SSCs and d-SSCs at PODs 10 and 15 form colonies at two weeks and four weeks in culture (top). Then d- and f-SSCs (bottom right, green cells) are stained with the known NCC markers indicated at the bottom left (indicated by the green antigen). f, Representative images of d- or f-SSCs plated and cultured for two weeks. g, Immunofluorescent staining of POD10 and POD15 d-SSCs for NCC markers (S100a4 and Plp1; green) at two and four weeks in culture. Images are representative of three independent experiments. Blue (Hoechst) staining identifies the nucleus. h, Immunofluorescent staining of f-SSCs versus d-SSCs at POD10 for the markers Zeb2, Twist2 or Cdc42 (green) and nuclear staining (blue) (representative of three independent experiments). Scale bars, 200 μm (f), 100 μm (g, h).

References

    1. Ilizarov GA The tension-stress effect on the genesis and growth of tissues: part II. The influence of the rate and frequency of distraction. Clin. Orthop. Relat. Res 239, 263–285 (1989). - PubMed
    1. Ilizarov GA The tension-stress effect on the genesis and growth of tissues. Part I. The influence of stability of fixation and soft-tissue preservation. Clin. Orthop. Relat. Res 238, 249–281 (1989). - PubMed
    1. Tahiri Y, Viezel-Mathieu A, Aldekhayel S, Lee J & Gilardino M The effectiveness of mandibular distraction in improving airway obstruction in the pediatric population. Plast. Reconstr. Surg 133, 352e–359e (2014). - PubMed
    1. McCarthy JG, Schreiber J, Karp N, Thorne CH & Grayson BH Lengthening the human mandible by gradual distraction. Plast. Reconstr. Surg 89, 1–8 (1992). - PubMed
    1. Khansa I et al. Airway and feeding outcomes of mandibular distraction, tongue-lip adhesion, and conservative management in Pierre Robin sequence: a prospective study. Plast. Reconstr. Surg 139, 975e–983e (2017). - PubMed

Publication types

MeSH terms