. 2018 Jul;7(3):255-264.
doi: 10.1016/j.jshs.2018.05.005. Epub 2018 Jun 2.

Why are muscles strong, and why do they require little energy in eccentric action?

Affiliations

Why are muscles strong, and why do they require little energy in eccentric action?

Walter Herzog. J Sport Health Sci. 2018 Jul.

Abstract

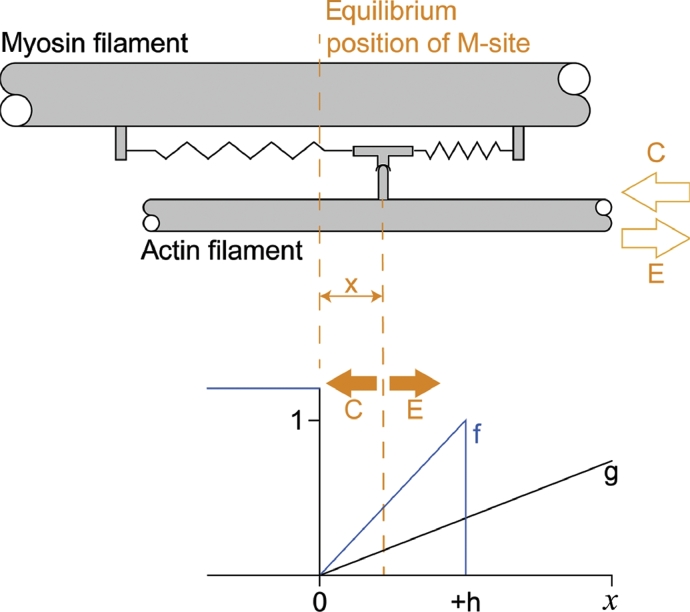
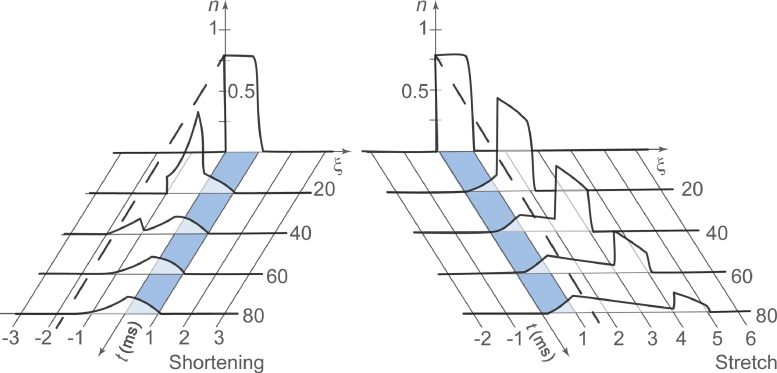
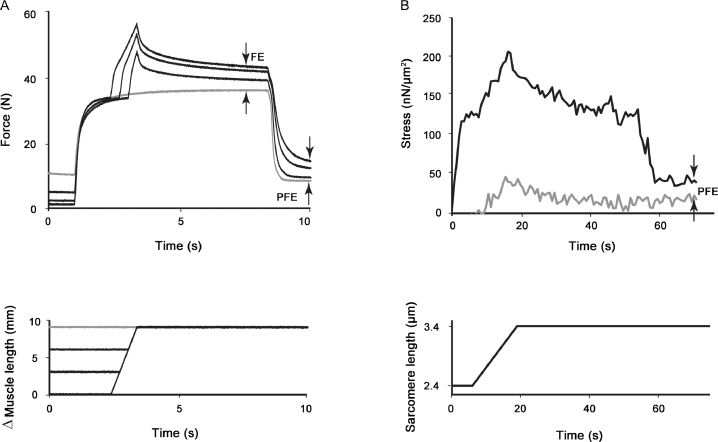
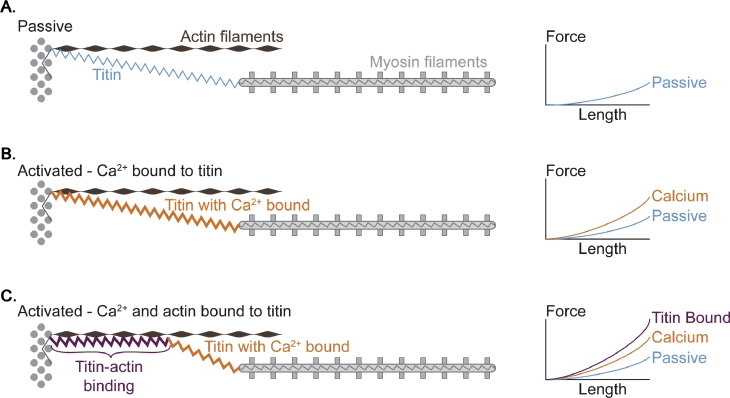
It is well acknowledged that muscles that are elongated while activated (i.e., eccentric muscle action) are stronger and require less energy (per unit of force) than muscles that are shortening (i.e., concentric contraction) or that remain at a constant length (i.e., isometric contraction). Although the cross-bridge theory of muscle contraction provides a good explanation for the increase in force in active muscle lengthening, it does not explain the residual increase in force following active lengthening (residual force enhancement), or except with additional assumptions, the reduced metabolic requirement of muscle during and following active stretch. Aside from the cross-bridge theory, 2 other primary explanations for the mechanical properties of actively stretched muscles have emerged: (1) the so-called sarcomere length nonuniformity theory and (2) the engagement of a passive structural element theory. In this article, these theories are discussed, and it is shown that the last of these-the engagement of a passive structural element in eccentric muscle action-offers a simple and complete explanation for many hitherto unexplained observations in actively lengthening muscle. Although by no means fully proven, the theory has great appeal for its simplicity and beauty, and even if over time it is shown to be wrong, it nevertheless forms a useful framework for direct hypothesis testing.

Keywords: Cross-bridge theory; Eccentric; Force–length relationship; Residual force enhancement; Titin.


Figures

Fig 1
Fig. 1
Original cross-bridge model developed by A. F. Huxley (1957). Top panel: The cross-bridge head (M) is attached to the myosin filament via linearly elastic springs with its equilibrium position at 0. The cross bridge can attach to its nearest binding site on actin (A), and x designates the distance of the cross bridge's equilibrium position to the nearest eligible binding site. Bottom panel: Rate functions of attachment (f) and detachment (g) of cross-bridges from actin; +h designates the maximal range of possible cross-bridge attachments to actin. Note that the attachment and detachment functions depend on x exclusively. Adapted from Huxley with permission.
Fig 2
Fig. 2
Imagine a cross bridge attached at an actin binding site as shown in the top panel of the figure. Its force is given by the force in the linear elastic spring that attaches the cross bridge to the myosin filament, which depends exclusively on how far the cross bridge is from its equilibrium position, given by x. If the cross-bridge attachment occurs during a concentric contraction (C), the muscle is shortening and the actin filament will move to the left relative to the myosin filament, thereby decreasing the cross-bridge x-distance and thus the force exerted by the cross bridge on actin. In contrast, if the cross-bridge attachment occurs during an eccentric action (E), the actin filament will move to the right relative to the myosin filament, thereby increasing the cross bridge's x-distance and thus its force. f = rate function of attachment; g = rate function of detachment; +h = the maximal range of possible cross-bridge attachments to actin; M = the myosin cross bridge.
Fig 3
Fig. 3
Depiction of the cross-bridge attachment distribution function (n) in a concentric (shortening, left panel) and an eccentric (stretch, right panel) contraction of equal speed as a function of time. The speed of shortening or stretch corresponds to the maximal speed of shortening of the muscle. The exact solution is predicted by Huxley's equation. Note how in the shortening contraction the x-distances decrease as a function of time, whereas in the stretch contraction they increase. Note also that for any given instant in time, the proportion of attached cross bridges (the areas under the attachment distribution curves) is greater for the eccentric than for the concentric conditions. Integers on the x-axis correspond to multiples of the allowable attachment rate function; that is, 1 corresponds to the distance over which a cross bridge can reach and attach to actin. Adapted from Zahalak and Ma with permission.
Fig 4
Fig. 4
Sarcomere force–length relationship for a frog skeletal muscle. The blue sarcomeres indicate schematically an isometric contraction with all sarcomeres at essentially the same length; thus, they have the same force. The brown sarcomeres indicate schematically an isometric contraction following an eccentric muscle action with sarcomeres becoming nonuniform in length. Some of the sarcomeres remain shorter than the sarcomeres for the purely isometric contraction, whereas others are pulled beyond actin-myosin filament overlap (they “pop”) and are rescued by the passive force of the sarcomere. Note that the average sarcomere length for the blue and brown sarcomeres is the same, and thus the muscle, fiber, and myofibril length is also the same. Once in force equilibrium, the nonuniform sarcomeres are higher up on the descending limb of the force–length relationship and are presumed to be stronger than the uniform sarcomeres of the purely isometric contraction. This sarcomere length nonuniformity has been thought (erroneously) to be the major (if not the exclusive) mechanism producing the so-called RFE property of skeletal muscle. RFE = residual force enhancement. Adapted from Gordon et al. with permission.
Fig 5
Fig. 5
Stress (force per cross-sectional area) time plot (A) and sarcomere length–time plot (B) for a single sarcomere stretched from an initial length of 2.4 µm to a final length of 3.4 µm. FE indicates the difference between the isometric steady-state force for a purely isometric contraction (grey line) and the corresponding isometric steady-state force following active stretching of this single sarcomere. Note that the isometric steady-state force following active stretching is about 3 times greater than the corresponding purely isometric force and is also about 25% greater than the isometric steady-state force at the plateau of the force–length relationship (OFE). Because single sarcomeres can have substantial FE and can exceed the purely isometric reference forces at the optimal sarcomere length (the length where the sarcomere is strongest), this result cannot be explained with sarcomere length nonuniformity. FE = force enhancement; OFE = force enhancement above the optimal force at the plateau of the force–length relationship.
Fig 6
Fig. 6
(A) Force-time trace of the cat soleus muscle (at 37°C) stretched by different amounts. Note the increased FE and increased PFE with increasing stretch magnitude. The gray line represents the isometric reference contraction, whereas the black lines represent the corresponding active stretch contractions. (B) Force-time trace of a single, isolated myofibril from rabbit psoas muscle showing PFE following active stretching of the myofibril. The gray line represents a passive muscle stretch, whereas the black line represents the active stretch contraction and subsequent deactivation. FE = force enhancement; PFE = passive force enhancement.
Fig 7
Fig. 7
Schematic illustration of titin mechanics in passive (A) and active (B, C) sarcomeres. (A) Passive stretching is associated with elongation of the entire I-band region of titin in accordance with the mechanical properties of the individual titin subfragments. (B) Upon activation (increase in calcium in the contractile space), calcium binds to titin and increases titin's stiffness; thus, when sarcomeres are stretched in the active compared to the passive state, titin force is greater. (C) Upon activation and stretching, titin is thought to bind to actin, thereby reducing its free spring length, and only the segments distal to the titin binding site can be used for elongation. This mechanism has the potential to vary titin stiffness differentially, depending on the length of the sarcomere where activation and stretching occurs.
Fig 8
Fig. 8
Unfolding force of titin immunoglobulin domains (cardiac I27 domains) in the absence (Control) and the presence of physiologically relevant concentrations of calcium (Calcium). Note that unfolding of the immunoglobulin domains requires substantially more force in the Calcium (activated) compared to the Control (passive) condition. Means ± SE are shown. In some of the symbols, the standard error cannot be seen because it is smaller than the dimension of the symbol. Adapted from Duvall et al. with permission.
Fig 9
Fig. 9
Titin segmental elongations for passive (A) and active (B) stretching of sarcomeres. (A) For passive stretches, the proximal segment of titin (diamond symbols) for both myofibrils shown here elongates with sarcomere elongation up to a sarcomere length of 4.0 µm, as shown for myofibril 1. (B) For active stretches, the proximal segment of titin (diamond symbols) elongates for part of sarcomere stretching but then stops elongating and remains at a constant length for the remainder of the sarcomere stretch. We interpret these data as shown in the schematic figures to the right of the raw data figures; that is, titin somehow binds to actin during active sarcomere or muscle stretching, and its proximal segments cannot elongate any farther because they are fixed on the “rigid” backbone of actin. PEVK = region of titin rich in proline, glutamate, valine, and lysine. M-line indicates the middle of the sarcomere and Z-line indicates the end of the sarcomere.
Fig 10
Fig. 10
Possible model of muscle contraction incorporating titin as the third force-regulating filament other than actin and myosin. (A) Electron micrograph of a single myofibril (top panel) with a sarcomere isolated (middle panel) and a schematic illustration of the three-filament sarcomere that includes actin, myosin, and titin (bottom panel). (B) Schematic proposal of muscle contraction including titin as a force-regulating protein. In the top panel, we have 2 (half) sarcomeres with a short (left) and a long (right) initial length. If passively stretched from these 2 initial configurations, the passive force at the stretched length is the same (middle panel, passive stretch). If, however, the sarcomeres are activated first at the short and long lengths, respectively (top panel), titin will bind to actin at a more proximal (short initial length) or a more distal (long initial length) site, thus experiencing more stretch for the remnant-free spring when the initial sarcomere length is short rather than when it is long. Simultaneously, calcium binds to specific sites on titin upon activation, providing an additional increase in stiffness to the remnant-free spring, thereby adding even more titin-based force when sarcomeres are stretched actively compared with when they are stretched passively. (C) Active and passive sarcomere force–length relationships. Note that in this model, the passive (titin-based) force increases upon activation because of the calcium binding to titin and the reduction of titin's free-spring length. The shift of the passive force curve upon activation depends crucially on the initial sarcomere length at which activation occurs, because that will determine where titin binds to actin. The black-filled circle shows the expected force of an isometric contraction at the initial (prestretch) length, the open diamond represents the expected force of an isometric contractions at the final (end-stretch) length, and the orange diamond represents the FE following active stretching of a muscle from the initial to the final length. This FE is associated exclusively with the increase in titin-based passive force upon muscle activation and active stretching. FE = force enhancement. A indicates the A-band of the sarcomere, I indicates the I-band of the sarcomere, M indicates the M-line, and Z indicates the Z-line. Adapted from Herzog with permission.

Similar articles

Cited by

References

    1. Hill AV. The heat of shortening and the dynamic constants of muscle. Proc R Soc Lond. 1938;126:136–195.
    1. Huxley AF. Muscle structure and theories of contraction. Prog Biophys Biophys Chem. 1957;7:255–318. - PubMed
    1. Huxley AF. Liverpool University Press; Liverpool: 1980. Reflections on muscle.
    1. Morgan DL. New insights into the behavior of muscle during active lengthening. Biophys J. 1990;57:209–221. - PMC - PubMed
    1. Herzog W, Schappacher G, Duvall M, Leonard TR, Herzog JA. Residual force enhancement following eccentric contractions: a new mechanism involving titin. Physiology. 2016;31:300–312. - PubMed