Review
. 2018 Jul;7(3):282-293.
doi: 10.1016/j.jshs.2018.06.003. Epub 2018 Jun 21.

Spinal and supraspinal control of motor function during maximal eccentric muscle contraction: Effects of resistance training

Affiliations
Review

Spinal and supraspinal control of motor function during maximal eccentric muscle contraction: Effects of resistance training

Per Aagaard. J Sport Health Sci. 2018 Jul.

Erratum in

Abstract

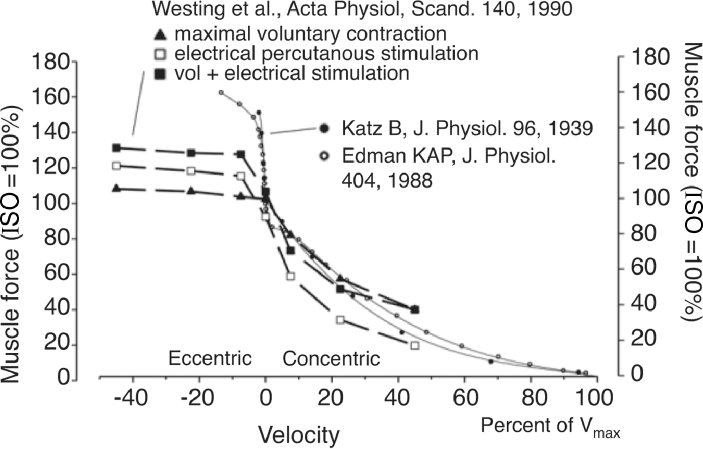
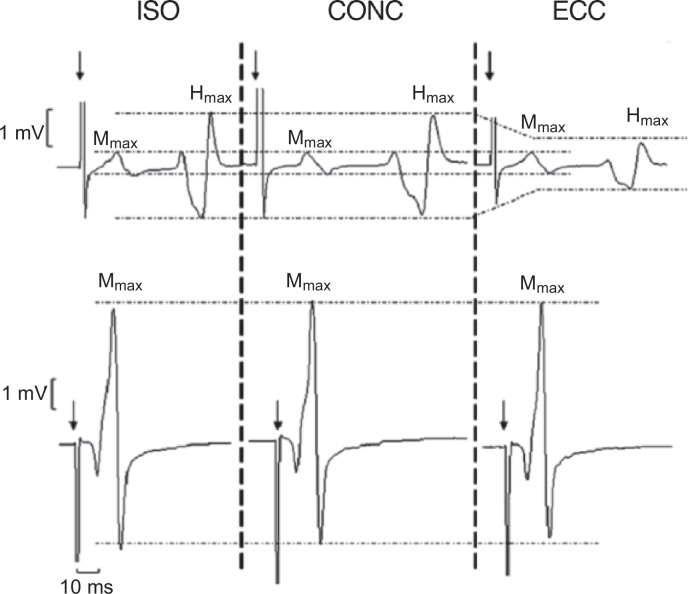
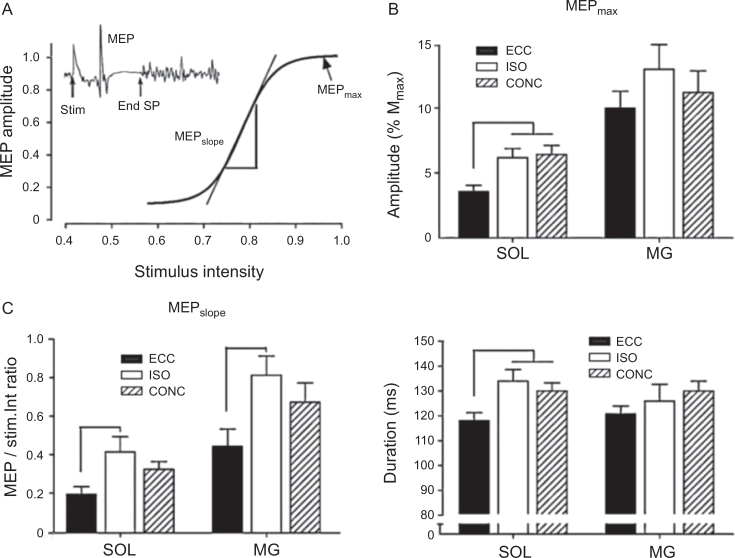
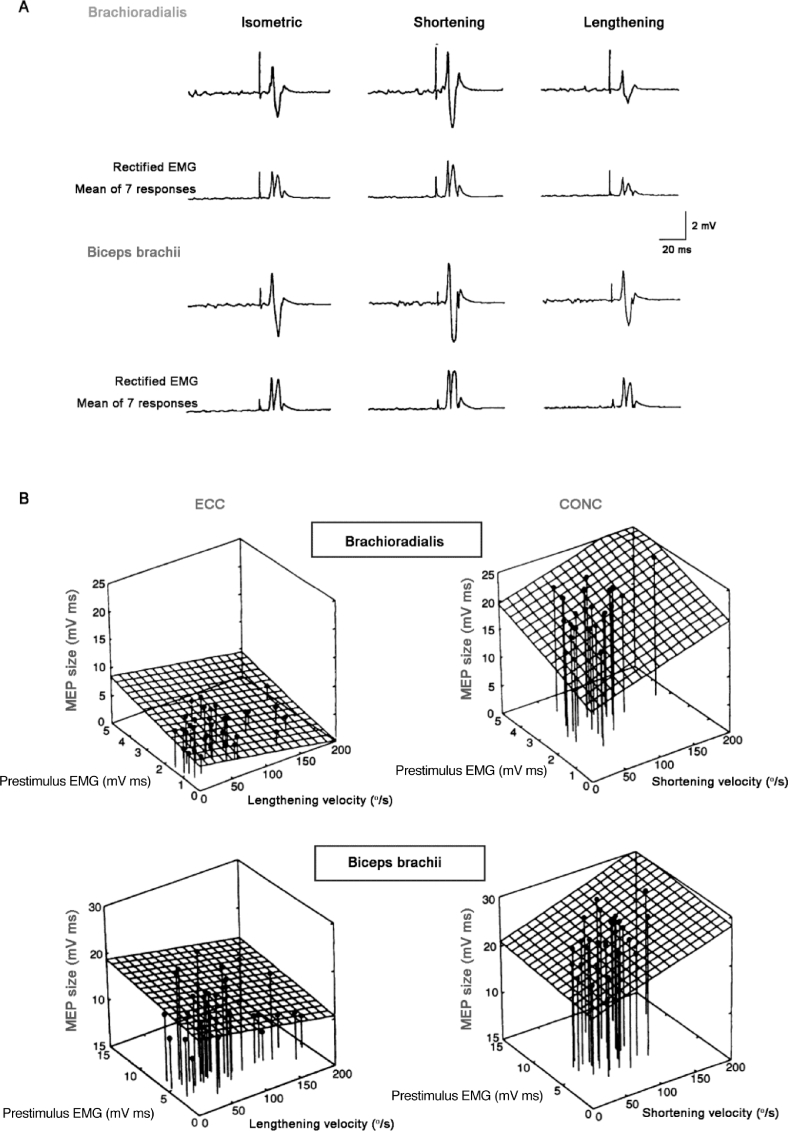
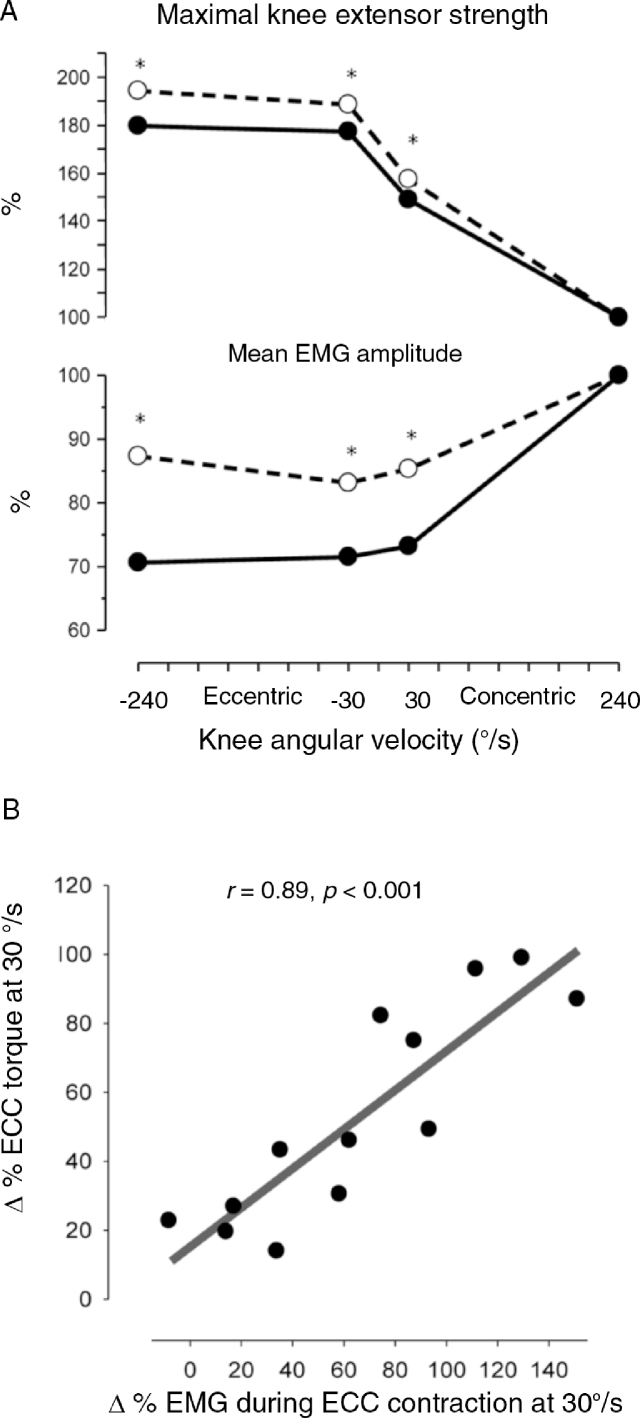
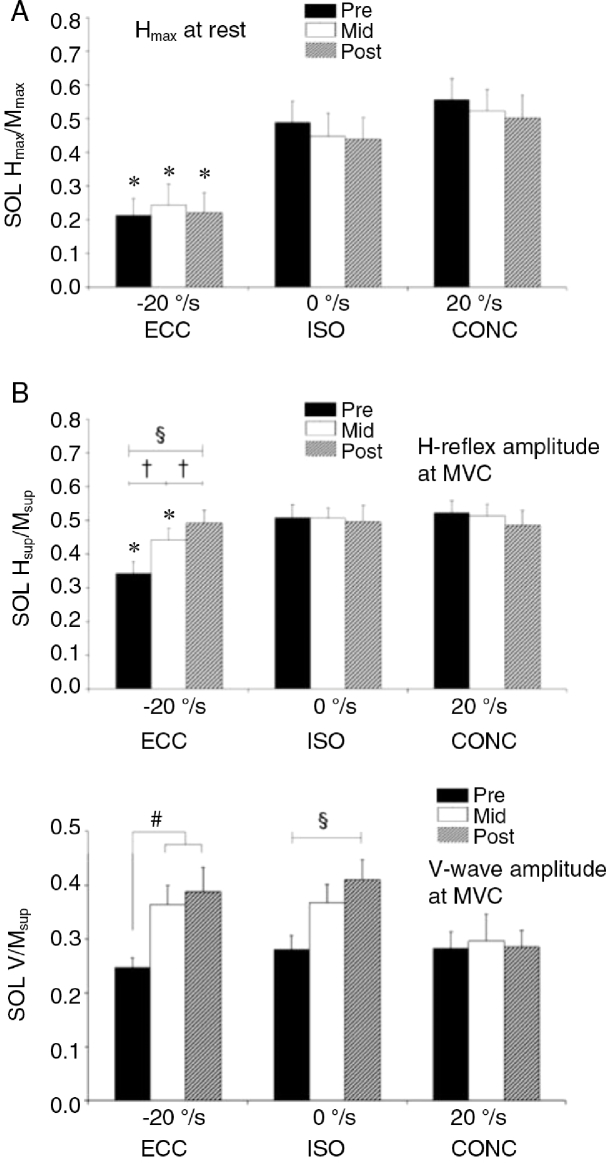
Neuromuscular activity is suppressed during maximal eccentric (ECC) muscle contraction in untrained subjects owing to attenuated levels of central activation and reduced spinal motor neuron (MN) excitability indicated by reduced electromyography signal amplitude, diminished evoked H-reflex responses, increased autogenic MN inhibition, and decreased excitability in descending corticospinal motor pathways. Maximum ECC muscle force recorded during maximal voluntary contraction can be increased by superimposed electrical muscle stimulation only in untrained individuals and not in trained strength athletes, indicating that the suppression in MN activation is modifiable by resistance training. In support of this notion, maximum ECC muscle strength can be increased by use of heavy-load resistance training owing to a removed or diminished suppression in neuromuscular activity. Prolonged (weeks to months) of heavy-load resistance training results in increased H-reflex and V-wave responses during maximal ECC muscle actions along with marked gains in maximal ECC muscle strength, indicating increased excitability of spinal MNs, decreased presynaptic and/or postsynaptic MN inhibition, and elevated descending motor drive. Notably, the use of supramaximal ECC resistance training can lead to selectively elevated V-wave responses during maximal ECC contraction, demonstrating that adaptive changes in spinal circuitry function and/or gains in descending motor drive can be achieved during maximal ECC contraction in response to heavy-load resistance training.

Keywords: Corticospinal excitability; Eccentric muscle contraction; H-reflex; Neuromuscular plasticity; Resistance training; V-wave.


Figures

Fig 1
Fig. 1
Contractile force–velocity relationships obtained for shortening (CONC) and lengthening (ECC) contractions in isolated in vitro preparations of whole muscle and single muscle fibres obtained from the frog (Rana Temporaria, m. sartorious at 11.5°C2; anterior tibialis muscle fibers at 1.4°C–1.5°C3). On the vertical axis (muscle force) a unit of 100 corresponds with a maximal ISO contraction force in vitro. On the velocity axis, 100% corresponds with Vmax. Positive and negative velocities denote CONC and ECC muscle actions, respectively. Superimposed curves show muscle strength measured in vivo during maximal voluntary activation and/or when percutaneous electrical stimulation was applied to the knee extensors.In vivo muscle strength was obtained by use of isokinetic dynamometry as the maximal knee extensor torque generated at 60° knee joint angle (0° = full knee extension), during (a) maximal voluntary muscle activation (triangles), (b) electrical muscle stimulation (open boxes), and (c) electrical stimulation superimposed onto maximal voluntary contraction (closed boxes). To scale isokinetic knee joint angular velocity, a maximal angular velocity of 800°/s was assumed for maximal unloaded knee extension, with a force unit of 100, corresponding with the maximal voluntary ISO strength (MVC). CONC = concentric; ECC = eccentric; ISO = isometric; MVC = maximum voluntary contraction; Vmax = maximal unloaded contraction velocity. Adapted from Aagaard et al. with permission.
Fig 2
Fig. 2
Raw tracings of isokinetic knee joint moment and (EMG signals obtained in an untrained male subject during maximal CONC (left) and ECC (right) knee extensor contraction during joint movements performed at slow (A) and fast (B) joint angular speeds (30°/s and 240°/s, respectively). Range of joint motion was from 90° to 10° during CONC contraction and from 10° to 90° during ECC contraction (0° = full knee extension). Note the appearance of large EMG amplitude spikes separated by short interspike periods of no or low neuromuscular activity during ECC contraction conditions, indicating a more nonuniform pattern of muscle activation during maximal ECC compared with CONC muscle actions in untrained individuals. CONC = concentric; ECC = eccentric; EMG = electromyography; VL = vastus lateralis, VM = vasus medialis, RF = rectus femoris. Adapted from Aagaard et al. with permission.
Fig 3
Fig. 3
(A) Maximal CONC and ECC quadriceps muscle strength (moment of force) and (B) neuromuscular activity (VL EMG) obtained in 15 untrained subjects and displayed as a function of knee joint angle (averaged in 10° intervals) and joint angular velocity. Negative and positive velocities denote ECC and CONC muscle contraction, respectively. As seen in (B), a marked suppression in VL EMG appeared during maximal ECC and slow CONC contraction, compared with the EMG amplitudes recorded during fast CONC contraction. Thus, VL EMG was 26%–31% lower in slow ECC and CONC contraction and 47% lower in fast ECC contraction compared with fast CONC contraction when averaged at 60°–90° knee joint angle. In contrast, no suppression in EMG was observed at more extended knee joint positions, e.g., at 10°–40° joint angle. CONC = concentric; ECC = eccentric; VL EMG = vastus lateralis electromyography amplitude. Data adapted from Aagaard et al. with permission.
Fig 4
Fig. 4
Spinal evoked H-reflex responses recorded in the soleus muscle during ISO, CONC, and ECC plantar flexor contractions of maximal voluntary effort. Note the depression in H-reflex amplitude during maximal ECC contraction, suggesting reduced spinal motorneuron excitability and/or increased presynaptic or postsynaptic inhibition. The Mmax remained unchanged across contraction modes (bottom) to verify that the depressed H-reflex response during ECC contraction was not a recording artifact. CONC = concentric; ECC = eccentric; Hmax = maximal H-wave; H-reflex = Hoffman reflex; Mmax = maximal M-wave; ISO = isometric. Adapted from Duclay and Martin with permission.
Fig 5
Fig. 5
Modulation in corticospinal excitability during maximal ECC, ISO, and CONC contractions. (A) MEP and SP evoked in the soleus muscle by TMS and the associated input–output relation for 1 representative subject. The graph displays the amplitude of the MEP recorded in the target muscle expressed relative to TMS stimulus intensity. Main parameters are maximal MEP amplitude (MEPmax), the slope of the steeper part of the input–output relation (MEPslope), and the duration of the silent period (SP) recorded for the greatest stimulus intensity stim. Modulations of (B) MEPmax, (C) MEPslope, and (D) duration of SP during ECC, ISO, and CONC maximum voluntary contractions. Data are means ± SEM (n = 12) for the SOL and MG. *ECC vs. ISO (p < 0.05); ***ECC vs. ISO and CONC (p < 0.001). CONC = concentric; ECC = eccentric; ISO = isometric; MEP = motor evoked potential; MG = medial gastrocnemius; SOL = soleus; SP = silent period; stim. = stimulus artifact; TMS = transcranial magnetic stimulation. Data from Duclay et al. and adapted from Duchateau and Baudry with permission.
Fig 6
Fig. 6
MEPs elicited in the elbow flexors by use of TMS during lengthening (ECC) and shortening (CONC) contractions performed at submaximal contraction intensity (1.5–5.0 kg loads, ∼20%–30% 1 RM). Note that MEP size is markedly decreased during ECC compared with CONC contraction conditions, even at comparable levels of prestimulus EMG activity. 1RM = 1 repetition maximum; CONC = concentric; EMG = electromyography; MEP = motor evoked potential; TMS = transcranial magnetic stimulation. Data adapted from Abbruzzese et al. with permission.
Fig 7
Fig. 7
(A) Maximal contraction strength and neuromuscular activity measured during maximal ECC (negative velocities) and CONC (positive velocities) muscle contractions before (full lines) and after (broken lines) 14 weeks of HLRT. All values are normalized relative to fast CONC contraction. (*after vs. before, p < 0.05). Note that the suppression in neuromuscular activity during ECC and slow CONC contraction before training was reduced after training (more details given in text). (B) The training-induced gain in maximal ECC muscle strength is strongly related to parallel elevations in normalized neuromuscular activity (ΔEMG). CONC = concentric; ECC = eccentric; EMG = electromyography; HLRT = heavy-load resistance training. Graph adapted from Aagaard, data from (A) Aagaard et al. and (B) Andersen et al. with permission.
Fig 8
Fig. 8
Maximal H-reflex (A, B) and V-wave responses (C) obtained before (pre), during (mid), and after (post) 7 weeks of resistance training. Data are expressed as peak-to-peak amplitude normalized to the maximal M-wave while recorded at rest (A) and during MVC (B, C). MVC conditions comprised separate ISO, CONC, and ECC plantar flexor trials. Training consisted of maximal ECC plantar flexor exercise performed in 2–3 sessions per week for 7 weeks (18 sessions in total). *ECC vs. CONC and ISO (p < 0.01); §post vs. pre (p < 0.01); mid vs. pre and post (p < 0.01); #pre vs. mid and post (p < 0.05). Note the marked increase in H-reflex and V-wave amplitudes during ECC MVC efforts after training. Furthermore, the depression in H-reflex amplitude during ECC vs. ISO and CONC MVC trials observed at baseline (pre) was removed after the period of training (post). Also note that training-induced gains in evoked reflex responses were observed during MVC efforts only (B, C) while absent in resting conditions (A). CONC = concentric; ECC = eccentric; Hmax =  H-reflex amplitude at rest; H-reflex = Hoffman reflex; Hsup = maximal H-reflex at MVC; ISO = isometric; Mmax = maximal M-wave amplitude at rest; Msup = maximal M-wave amplitude at MVC; MVC = maximum voluntary contraction; SOL = soleus; V = V-wave amplitude. Data adapted from Duclay et al. with permission.

References

    1. Fenn WO. The relation between the work performed and the energy liberated in muscular contraction. J Physiol. 1924;58:373–395. - PMC - PubMed
    1. Katz B. The relation between force and speed in muscular contraction. J Physiol. 1939;96:45–64. - PMC - PubMed
    1. Edman KA. Double-hyperbolic force-velocity relation in frog muscle fibres. J Physiol. 1988;404:301–321. - PMC - PubMed
    1. Abbott BC, Bigland B, Ritchie JM. The physiological cost of negative work. J Physiol. 1952;117:380–390. - PMC - PubMed
    1. Aagaard P, Simonsen EB, Trolle M, Bangsbo J, Klausen K. Specificity of training velocity and training load on gains in isokinetic knee joint strength. Acta Physiol Scand. 1996;156:123–129. - PubMed