. 2018 Oct 9:12:711.
doi: 10.3389/fnins.2018.00711. eCollection 2018.

FieldTrip Made Easy: An Analysis Protocol for Group Analysis of the Auditory Steady State Brain Response in Time, Frequency, and Space

Affiliations

FieldTrip Made Easy: An Analysis Protocol for Group Analysis of the Auditory Steady State Brain Response in Time, Frequency, and Space

Tzvetan Popov et al. Front Neurosci. .

Abstract

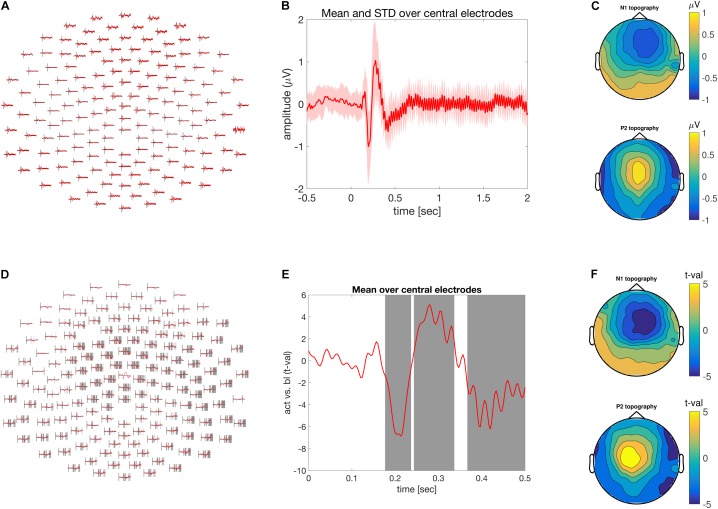
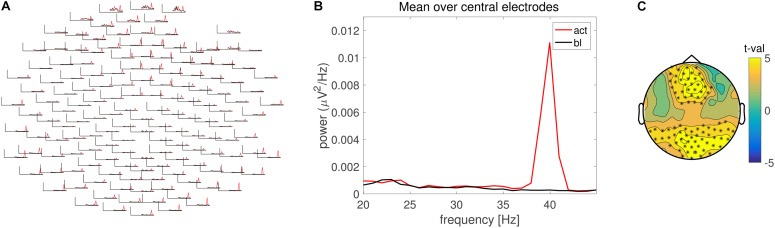
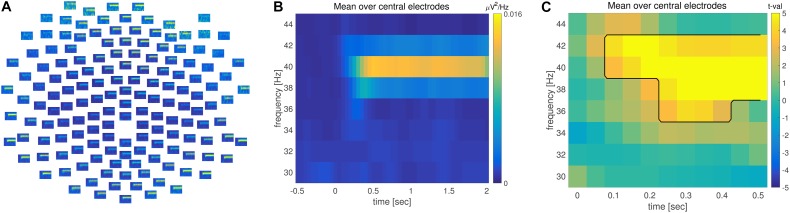
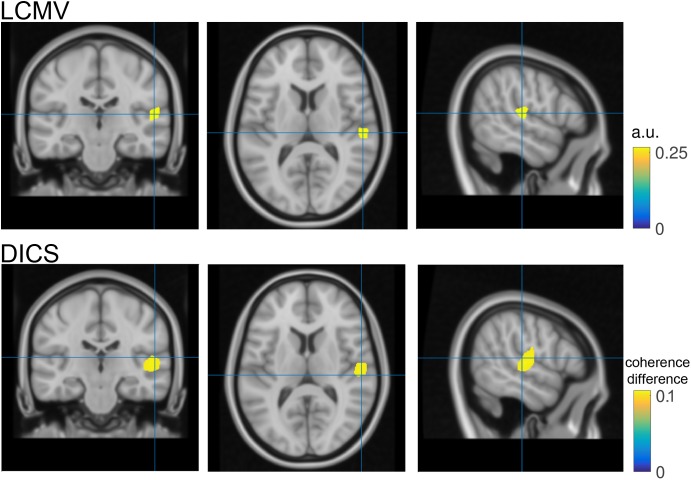
The auditory steady state evoked response (ASSR) is a robust and frequently utilized phenomenon in psychophysiological research. It reflects the auditory cortical response to an amplitude-modulated constant carrier frequency signal. The present report provides a concrete example of a group analysis of the EEG data from 29 healthy human participants, recorded during an ASSR paradigm, using the FieldTrip toolbox. First, we demonstrate sensor-level analysis in the time domain, allowing for a description of the event-related potentials (ERPs), as well as their statistical evaluation. Second, frequency analysis is applied to describe the spectral characteristics of the ASSR, followed by group level statistical analysis in the frequency domain. Third, we show how time- and frequency-domain analysis approaches can be combined in order to describe the temporal and spectral development of the ASSR. Finally, we demonstrate source reconstruction techniques to characterize the primary neural generators of the ASSR. Throughout, we pay special attention to explaining the design of the analysis pipeline for single subjects and for the group level analysis. The pipeline presented here can be adjusted to accommodate other experimental paradigms and may serve as a template for similar analyses.

Keywords: ASSR; EEG; ERP; FieldTrip; beamforming; group analysis.


Figures

FIGURE 1
FIGURE 1
Time-domain analysis. (A) Grand average of the ASSR across multiple electrodes. (B) ASSR averaged across central electrodes. Time is depicted on the abscissa and amplitude on the ordinate. (C) Scalp topography of the N1 top (170–230 ms) and P2 bottom (250–300) components of the grand averaged ASSR. (D) Difference between pre and post-stimulus activity across multiple electrodes expressed as units of t-values. Shaded areas at electrode clusters reflect time clusters motivating the rejection of the null hypothesis. (E) Time course of the difference between pre and post-stimulus activity expressed in units of t-values. Gray areas highlight the time clusters of significant condition differences. Time is depicted on the x-axis and difference strength on the y-axis. (F) Similar to (C), but in units of t-values.
FIGURE 2
FIGURE 2
Frequency domain analysis. (A) Grand average power spectrum for the pre- (black) and post-stimulus (red) ASSR across multiple electrodes. (B) Grand average power spectrum averaged across central electrodes. Line color identical to (A). (C) Scalp topography of the condition difference in 40 Hz power expressed in units of t-values. Electrode clusters on the basis of which the null hypothesis was rejected are highlighted with asterisks.
FIGURE 3
FIGURE 3
Time-frequency analysis. (A) Grand averaged time-frequency representation of power (TFR) across multiple electrodes. (B) TFR averaged across central electrodes. Time is depicted on the x and frequency on the y axis. Warm colors reflect increase of oscillatory power. (C) TFR of the difference between pre and post-stimulus activity. Axis are identical to (B); warm colors correspond to an increase and cold colors to a decrease in power during post-relative to pre-stimulus. The observed time-frequency cluster on the basis of which the null hypothesis is rejected is highlighted by the black line.
FIGURE 4
FIGURE 4
Source reconstruction. Top- Coronal, transversal and axial slices of reconstructed N1 activity in neurological convention. The blue cross hairs correspond to the maximal activation within the right Heschl’s gyrus. Bottom- same as top but utilizing dynamic imaging of coherent sources (DICS) as source reconstruction method. Color code represents the increase in coherence with a surrogate 40 Hz signal during the post-stimulation period as compared to the pre-stimulus baseline.

Similar articles

Cited by

References

    1. Chen J., Gong Q., Wu F. (2016). Deficits in the 30-Hz auditory steady-state response in patients with major depressive disorder. Neuroreport 27 1147–1152. 10.1097/WNR.0000000000000671 - DOI - PubMed
    1. Dalal S. S., Guggisberg A. G., Edwards E., Sekihara K., Findlay A. M., Canolty R. T., et al. (2008). Five-dimensional neuroimaging: localization of the time-frequency dynamics of cortical activity. Neuroimage 40 1686–1700. 10.1016/j.neuroimage.2008.01.023 - DOI - PMC - PubMed
    1. Diesch E., Andermann M., Flor H., Rupp A. (2010). Functional and structural aspects of tinnitus-related enhancement and suppression of auditory cortex activity. Neuroimage 50 1545–1559. 10.1016/j.neuroimage.2010.01.067 - DOI - PubMed
    1. Edgar J. C., Fisk C. L. I. V., Liu S., Pandey J., Herrington J. D., Schultz R. T., et al. (2016). Translating adult electrophysiology findings to younger patient populations: difficulty measuring 40-Hz auditory steady-state responses in typically developing children and children with autism spectrum disorder. Dev. Neurosci. 38 1–14. 10.1159/000441943 - DOI - PMC - PubMed
    1. Gross J., Kujala J., Hamalainen M., Timmermann L., Schnitzler A., Salmelin R. (2001). Dynamic imaging of coherent sources: studying neural interactions in the human brain. Proc. Natl. Acad. Sci. U.S.A. 98 694–699. 10.1073/pnas.98.2.694 - DOI - PMC - PubMed

LinkOut - more resources