. 2018 Oct 9:9:2320.
doi: 10.3389/fimmu.2018.02320. eCollection 2018.

Development of Adjuvant-Free Bivalent Food Poisoning Vaccine by Augmenting the Antigenicity of Clostridium perfringens Enterotoxin

Affiliations

Development of Adjuvant-Free Bivalent Food Poisoning Vaccine by Augmenting the Antigenicity of Clostridium perfringens Enterotoxin

Hidehiko Suzuki et al. Front Immunol. .

Abstract

Clostridium perfringens enterotoxin (CPE) is a common cause of food poisoning and hyperkalemia-associated death. Previously, we reported that fusion of pneumococcal surface protein A (PspA) to C-terminal fragment of CPE (C-CPE) efficiently bound mucosal epithelium so that PspA-specific immune responses could be provoked. In this study, we found that fusion of C-CPE with PspA augmented the antigenicity of C-CPE itself. These findings allowed us to hypothesize that fusion of C-CPE and another food poisoning vaccine act as a bivalent food poisoning vaccine. Therefore, we constructed an adjuvant-free bivalent vaccine against CPE and cholera toxin (CT), which is a major food poisoning in developing country, by genetically fusing CT B subunit to C-CPE. Because of the low antigenicity of C-CPE, immunization of mice with C-CPE alone did not induce C-CPE-specific immune responses. However, immunization with our vaccine induced both C-CPE- and CT-specific neutralizing antibody. The underlying mechanism of the augmented antigenicity of C-CPE included the activation of T cells by CTB. Moreover, neutralizing antibodies lasted for at least 48 weeks and the quality of the antibody was dependent on the binding activity of CTB-C-CPE to its receptors. These findings suggest that our fusion protein is a potential platform for the development of an adjuvant-free bivalent vaccine against CPE and CT.

Keywords: Clostridium perfringens enterotoxin; cholera toxin; food poisoning; mucosal immunity; vaccine.


Figures

Figure 1
Figure 1
Binding activities of CTB–C-CPE. (A) Binding of CTB–C-CPE to claudin-4. Parental and mouse claudin-4-expressing L cells were treated with CTB, C-CPE, or CTB–C-CPE. Receptor binding was detected by using an anti-His tag antibody followed by staining with a fluorescein isothiocyanate (FITC)-labeled secondary antibody. Dashed histograms represent control experiments, and lined histogram is CTB, C-CPE, or CTB–C-CPE. Cells were analyzed by flow cytometry and recorded at least 10,000 cells. Number indicates frequency of FITC-positive cells. MFI, mean fluorescent intensity. Similar results were obtained from two separate experiments. (B) Binding of CTB–C-CPE to GM1–ganglioside. Ninety-six-well immunoplates were coated with GM1–ganglioside and then CTB, C-CPE, or CTB–C-CPE was added to the wells. The binding of protein to GM1–ganglioside was detected by using anti-His tag antibody followed by a horseradish peroxidase-labeled secondary antibody. N.D., not detected. Data are presented as mean ± SD (n = 3/experiment). Similar results were obtained from two separate experiments. (C) Binding of CTB–C-CPE to mouse intestinal epithelium. Intestinal sections (6 μm) were fixed in acetone and stained with biotinylated CTB, C-CPE, or CTB–C-CPE and then stained with Alexa Fluor 546-conjugated streptavidin. Red, biotinylated CTB, C-CPE, or CTB–C-CPE; Blue, DAPI. PP, Peyer's patches. Scale bar, 100 μm. Similar results were obtained from two separate experiments.
Figure 2
Figure 2
CTB–C-CPE, but not C-CPE or a mixture of C-CPE and CT, induced C-CPE-specific neutralizing immune responses. Production of C-CPE-specific antibodies in the systemic and intestinal compartments. Mice were subcutaneously immunized with vehicle, CTB, C-CPE, CTB–C-CPE, or a mixture of C-CPE and CT (CTB: 20 μg, C-CPE: 24 μg, CT: 10 μg). One week after subcutaneous immunization, mice were orally immunized with vehicle, CTB, C-CPE, CTB–C-CPE, or a mixture of C-CPE and CT once a week for 3 weeks. One week after the final immunization, serum and intestinal wash samples were collected and C-CPE-specific serum IgG (A) and intestinal IgA (B) levels were determined by means of an enzyme-linked immunosorbent assay. Data are shown as mean ± SEM. N.S., not statistically significant. (n = 6–10). (C) Neutralizing activity against CPE in vitro. Serum from immunized mice was added to Vero cells and cell viability was measured by means of a WST-8 assay. Vero cells treated without CPE were used as controls. (n = 4–8). (D,E) Protective immunity against CPE-mediated diarrhea. CPE was administered into a surgically constructed intestinal loop (n = 6–13). After 90 min, the weight and length of the loop were measured. (F) Histological damage by CPE. CPE-treated intestinal loop sections (6 μm; n = 5–9) were stained with hematoxylin and eosin. Scale bars, 100 μm. (G) Survival in mice administered CPE. Mice were intravenously injected with CPE and survival was monitored. Data were collected from two separate experiments (n = 8–12). (H) Protection against CPE-mediated hyperkalemia. Mice (n = 3–11) were intravenously injected with CPE. After 4 h, serum was collected and the level of potassium was measured. Orange line indicates upper limit of potassium level (5.0 mmol/L). OD, optical density. N.S., not statistically significant. Box plots: Bar represents the median, top is maximum value, bottom is minimum value. Black, vehicle; Blue, CTB; Green, C-CPE; Red, CTB–C-CPE; Purple, mixture of C-CPE, and CT; Orange, positive control (CPE-treated Vero cells). Values were compared by using the non-parametric Mann–Whitney U-test.
Figure 3
Figure 3
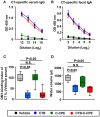
Induction of protective immunity against CT-mediated diarrhea by CTB–C-CPE Mice were subcutaneously immunized with vehicle, CTB, C-CPE, or CTB–C-CPE (CTB: 20 μg, C-CPE: 24 μg). One week after subcutaneous immunization, mice were orally immunized with vehicle, CTB, C-CPE, or CTB–C-CPE once a week for 3 weeks. One week after the final immunization, serum and fecal samples were collected and the levels of CT-specific serum IgG (A) and fecal IgA (B) were determined by means of an enzyme-linked immunosorbent assay. Data are shown as mean ± SEM. OD, optical density (n = 8–9). (C) Neutralizing activity against CT–GM1–ganglioside binding. Serum from CTB–C-CPE immunized mice was added to GM1–ganglioside-coated 96-well immunoplates. The binding of CT and GM1–ganglioside was detected by using rabbit anti-CTB antibody followed by a horseradish peroxidase-labeled secondary antibody. Serum from mice immunized with vehicle was used as the control. N.S., not statistically significant. (n = 8–9). (D) Protective immunity against CT-mediated diarrhea. Eleven days after the final immunization, mice were orally challenged with CT (25 μg). After 13–14 h, intestinal fluid volume was measured. (n = 5–6) Box plots: Bar represents the median, top is maximum value, bottom is minimum value. Grey, vehicle; Blue, CTB; Green, C-CPE; Red, CTB–C-CPE. Values were compared by using the non-parametric Mann–Whitney U-test. N.S., not statistically significant.
Figure 4
Figure 4
T cells activation by CTB–C-CPE. Mice were subcutaneously immunized with vehicle, C-CPE, or CTB–C-CPE (CTB: 20 μg, C-CPE: 24 μg). One week after subcutaneous immunization, mice were orally immunized with vehicle, C-CPE, or CTB–C-CPE once a week for 3 weeks. One week after the final immunization, splenic CD4+ T cells were isolated from the immunized mice. Antigen-presenting cells were isolated from the spleen of naïve mice. Purified CD4+ T cells and antigen-presenting cells were stimulated with vehicle, C-CPE, CTB, or CTB–C-CPE. Five days after culture, proliferation was measured. Stimulation 1, vehicle; 2, CTB; 3, C-CPE; 4, CTB–C-CPE (n = 6–8). Values were compared by using the non-parametric Mann–Whitney U-test.
Figure 5
Figure 5
Long-term antibody production by CTB–C-CPE. (A) Time course of C-CPE-specific antibody production. One week to forty-eight weeks after the final immunization, serum samples were collected and the levels of C-CPE specific serum IgG was determined by ELISA. Data are shown as mean ± SEM (n = 5). (B) Neutralizing activity against CPE in vitro. CPE and serum from immunized mice were added to Vero cells and cell viability was measured by WST-8 assay. Vero cells treated without CPE were used as controls (n = 5). (C) Production of CT-specific antibodies. One week to forty-eight weeks after the final immunization, serum samples were collected and the levels of CT-specific serum IgG was determined by ELISA. Data are shown as mean ± SEM (n = 5). (D) Neutralizing activity against CT–GM1–ganglioside binding. CT and serum from immunized mice were added to GM1–ganglioside-coated 96-well immunoplates. The binding of CT and GM1–ganglioside was detected by using rabbit anti-CTB antibody followed by a horseradish peroxidase-labeled secondary antibody. Serum from naïve mice was used as the control (n = 5). Box plots: Bar represents the median, top is maximum value, bottom is minimum value. Values were compared by using the non-parametric Mann–Whitney U-test.
Figure 6
Figure 6
Binding activity of three CTB–C-CPE mutants to claudin-4 and GM1–ganglioside. (A) Binding of CTB–C-CPE and three CTB–C-CPE mutants to claudin-4. Parent and mouse claudin-4-expressing L cells were treated with the CTB–C-CPE mutants. Binding was detected by using an anti-His tag antibody followed by staining with fluorescein isothiocyanate (FITC)-labeled secondary antibody (n = 3). (B) Binding of CTB–C-CPE and three CTB–C-CPE mutants to GM1–ganglioside. Ninety-six-well immunoplates were coated with GM1–ganglioside, and the CTB–C-CPE mutants were then added to the wells. The binding of the CTB–C-CPE mutants to GM1–ganglioside was detected by using anti-His tag antibody followed by horseradish peroxidase-labeled secondary antibody. (n = 4). Data are shown as mean ± SD. Red, CTB–C-CPE; Blue, CTB (Y12D)–C-CPE; Green, CTB–C-CPE (Y306A/L315A); Purple, CTB (Y12D)–C-CPE (Y306A/L315A).
Figure 7
Figure 7
Immune induction and neutralizing activity by three CTB–C-CPE mutants Immune induction by three CTB–C-CPE mutants. Mice were subcutaneously immunized with CTB–C-CPE mutants (CTB: 20 μg, C-CPE: 24 μg). One week after subcutaneous immunization, mice were orally immunized with the CTB–C-CPE mutants once a week for 3 weeks. One week after the final immunization, serum samples were collected and the levels of CTB–C-CPE-specific serum IgG (A), C-CPE-specific serum IgG (B), and CT-specific serum IgG (C) were determined by means of enzyme-linked immunosorbent assays. Data are shown as mean ± SEM. OD, optical density (n = 4–6). (D) Neutralizing activity against CPE. Vero cells treated with serum from immunized mice was added to Vero cells. Cell viability was measured by means of a WST-8 assay. Control was Vero cells not treated with CPE. (E) Neutralizing activity against CT–GM1–ganglioside binding. CT treated with serum from immunized mice was added to GM1–ganglioside-coated 96-well immunoplates. Binding of CT and GM1–ganglioside was detected by using rabbit anti-CTB antibody followed by a horseradish peroxidase-labeled secondary antibody. Serum from naïve mice was used in control experiments (n = 9–11). Data are shown as mean ± SEM. Box plots: Bar represents median. Red, CTB–C-CPE; Blue, CTB (Y12D)–C-CPE; Green, CTB–C-CPE (Y306A/L315A); Purple, CTB (Y12D)–C-CPE (Y306A/L315A). Values were compared by using the non-parametric Mann–Whitney U-test.

Similar articles

Cited by

References

    1. World Health Organization. Food Safety (2017). Available online at: http://www.who.int/mediacentre/factsheets/fs399/en/
    1. Vital signs: incidence and trends of infection with pathogens transmitted commonly through food-foodborne diseases active surveillance network 10 U.S. sites, 1996–2010. MMWR Morb Mortal Wkly Rep. (2011) 60:749–55. - PubMed
    1. Kirk MD, Pires SM, Black RE, Caipo M, Crump JA, Devleesschauwer B, et al. World Health Organization estimates of the global and regional disease burden of 22 foodborne bacterial, protozoal, and viral diseases, 2010: a data synthesis. PLoS Med. (2015) 12:e1001921 10.1371/journal.pmed.1001921 - DOI - PMC - PubMed
    1. Scharff RL. Economic burden from health losses due to foodborne illness in the United States. J Food Prot. (2012) 75:123–31. 10.4315/0362-028X.JFP-11-058 - DOI - PubMed
    1. Grass JE, Gould LH, Mahon BE. Epidemiology of foodborne disease outbreaks caused by Clostridium perfringens, United States, 1998-2010. Foodborne Pathog Dis. (2013) 10:131–6. 10.1089/fpd.2012.1316 - DOI - PMC - PubMed

Publication types

MeSH terms