. 2018 Oct 9:9:1398.
doi: 10.3389/fphys.2018.01398. eCollection 2018.

Hyperglycemia Aggravates Diet-Induced Coronary Artery Disease and Myocardial Infarction in SR-B1-Knockout/ApoE-Hypomorphic Mice

Affiliations

Hyperglycemia Aggravates Diet-Induced Coronary Artery Disease and Myocardial Infarction in SR-B1-Knockout/ApoE-Hypomorphic Mice

Leticia Gonzalez et al. Front Physiol. .

Abstract

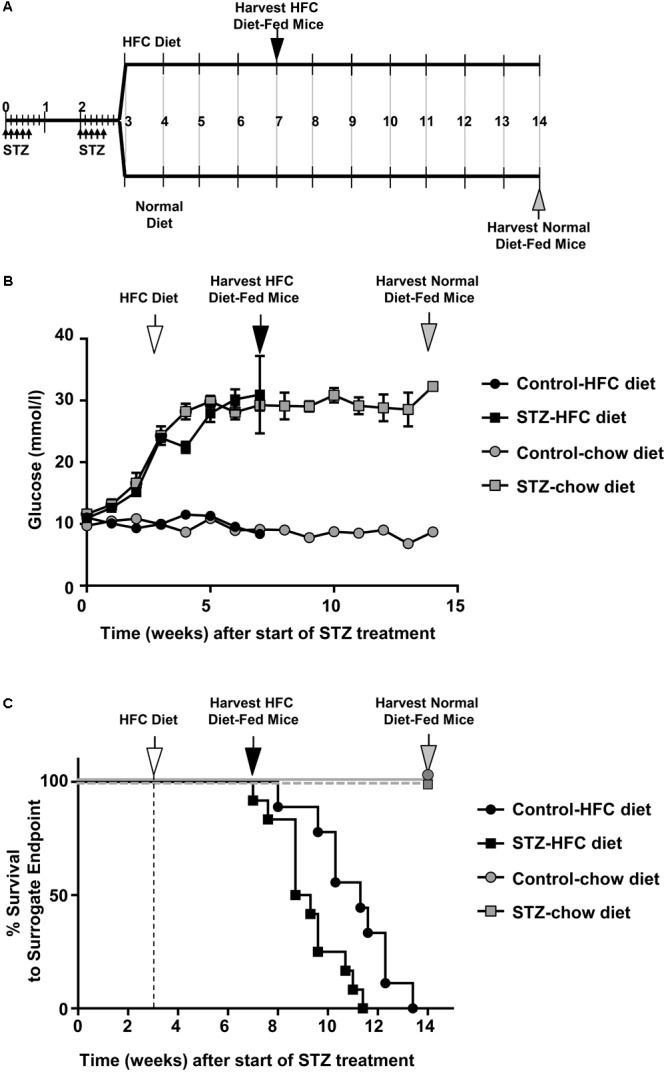
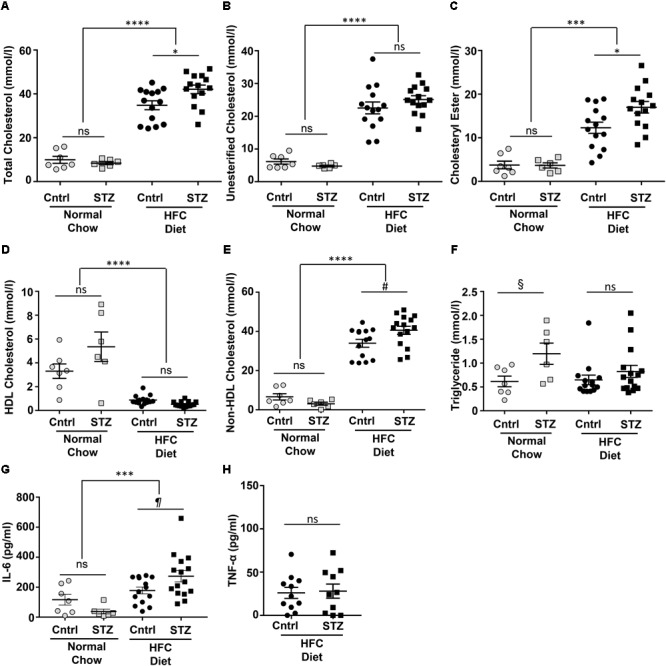
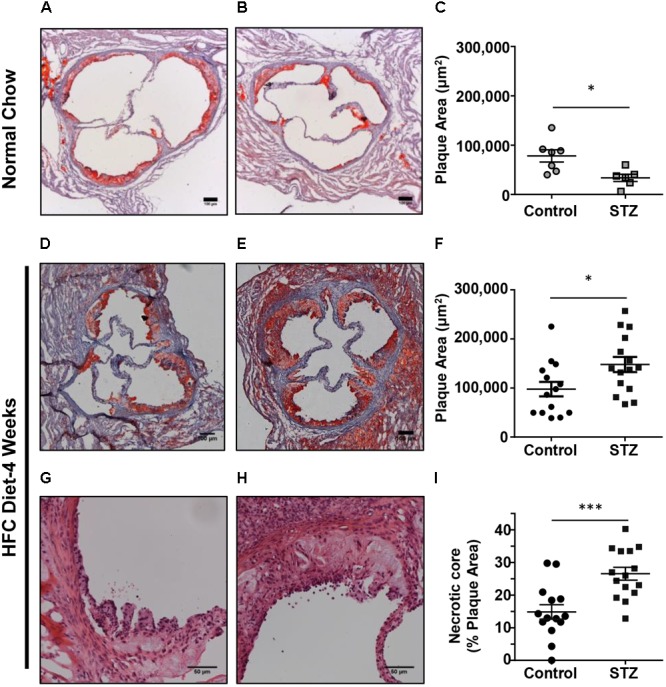
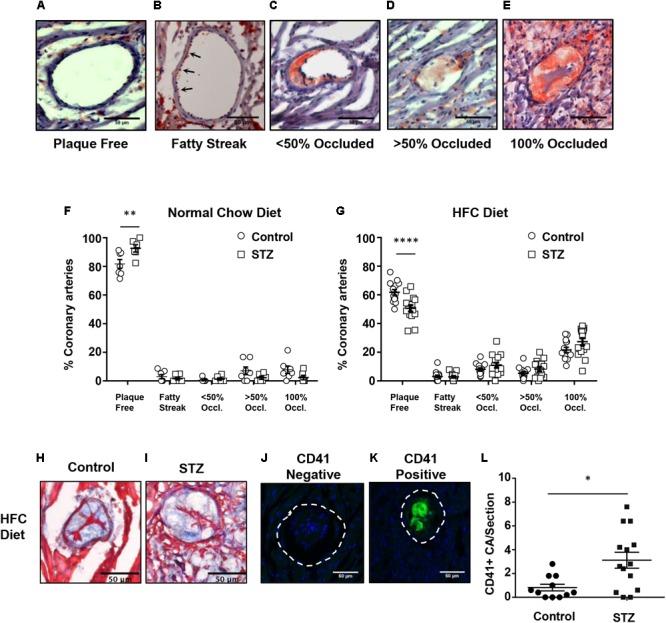
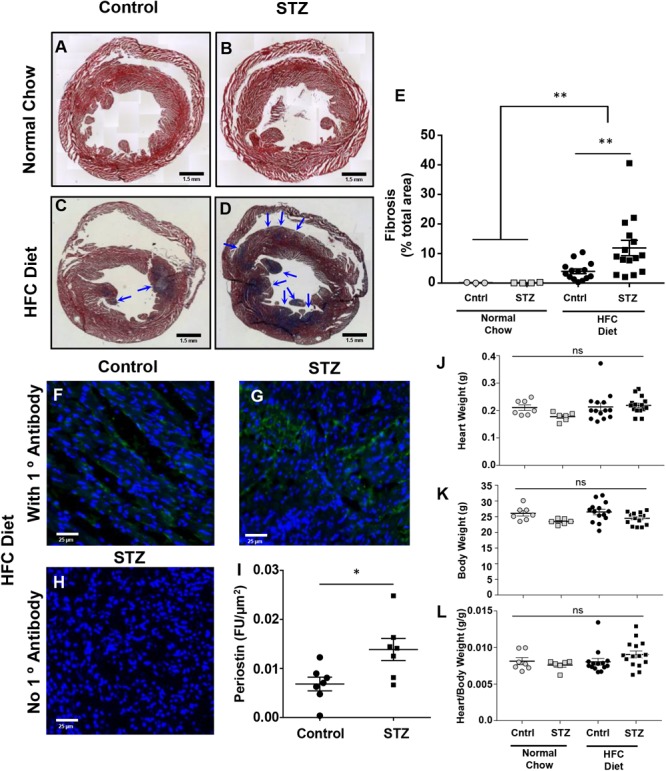
Diabetes is a risk factor for development of atherosclerotic cardiovascular disease. Animal model studies in mice revealed that hyperglycemia increases development of atherosclerosis in the aorta as well as myocardial fibrosis in surgical models of coronary artery ligation; however, the impact of hyperglycemia on coronary artery atherosclerosis and subsequent heart disease is less clear. To investigate the effect of hyperglycemia on atherosclerosis and coronary heart disease, we used a mouse model of diet-induced coronary artery atherosclerosis and myocardial infarction, the high fat/high cholesterol (HFC) diet fed SR-B1 knockout (KO)/apoE-hypomorphic (HypoE) mouse. Hyperglycemia was induced in these mice by streptozotocin (STZ) treatment. This increased HFC diet-dependent atherosclerosis development (p = 0.02) and necrotic core formation (p = 0.0008) in atherosclerotic plaques in the aortic sinus but did not increase the extent of atherosclerosis in coronary arteries. However, it did increase the extent of platelet accumulation in atherosclerotic coronary arteries (p = 0.017). This was accompanied by increased myocardial fibrosis (p = 0.005) and reduced survival (p = 0.01) compared to control-treated, normoglycemic mice. These results demonstrate that STZ-treatment exerted differential effects on the level of atherosclerosis in the aortic sinus and coronary arteries. These results also suggest that SR-B1-KO/HypoE mice may be a useful non-surgical model of diabetic cardiomyopathy in the context of coronary artery atherothrombosis.

Keywords: atherosclerosis; coronary artery; diabetes; fibrosis; hyperglycemia; myocardial infarction.


Figures

FIGURE 1
FIGURE 1
STZ-induced diabetes is associated with reduced survival HFC diet fed SR-B1-KO/hypoE mice. (A) Schematic representation of experimental time course. Male mice were treated with two rounds of low dose (40 mg/kg body weight) STZ injections (daily for 5 days each round) during weeks 1 and 3 (small arrows). Control mice received citrate buffer (not shown). At week 3, mice were fed either a HFC diet containing 15% fat and 1.25% cholesterol, or were maintained on a normal chow diet. Mice were either euthanized for analysis at week 7 (after 4 weeks of feeding the HFC diet; black arrow), week 14 (for normal chow diet; gray arrow) or were monitored for surrogate endpoint at which time they were humanly euthanized. (B) Non-fasting blood glucose levels over the course of the study for(control- (circles) or STZ-treated mice (squares) fed either the normal chow (gray symbols) or switched to the HFC diet (white arrow; black symbols). Symbols represent means ± SEM of n = 7 (control-treated, fed normal chow), n = 6 (STZ-treated, fed normal chow), n = 14 (control-treated, fed HFC diet), and n = 15 (STZ-treated, fed HFC diet). Data were subjected to two-way ANOVA; p < 0.0001 for control- vs STZ-treated mice fed each diet, and for STZ-treated mice fed normal chow vs HFC diet. (C) Survival to surrogate endpoint for control- (circles) or STZ-treated mice (squares) fed either the normal chow diet (gray symbols) or the HFC diet (black symbols). The vertical dashed line and white arrow indicates the start of HFC diet feeding at 3 weeks (after start of STZ- or control citrate buffer treatment). P < 0.0001 for comparison between mice fed the normal chow and HFC diets and p = 0.009 for control- vs STZ-treated mice fed the HFC diet (by Mantel–Cox log-rank test).)
FIGURE 2
FIGURE 2
Plasma lipids and IL-6 in control- and STZ-treated SR-B1-KO/hypoE mice fed the normal chow or HFC diets. Mice were fasted for 4 h prior to humane euthanasia under anesthesia, and blood collection by cardiac puncture into heparinized syringes. Plasma was analyzed for total cholesterol (A), unesterified cholesterol (B), cholesteryl ester (total-unesterified cholesterol; C), HDL cholesterol (D), non-HDL cholesterol (total – HDL cholesterol; E), triglycerides (F) IL-6 (G), and TNF-α (H) using commercially available assay kits as described in Section “Materials and Methods.” Circles represent mice treated with control citrate buffer (Cntrl) and squares represent mice treated with STZ. Gray symbols represent mice maintained on normal chow up to 14 weeks after start of control/STZ-treatment and black symbols represent mice switched to HFC diet 3 weeks after start of control/STZ-treatment and analyzed after 4 weeks of HFC diet feeding. Horizontal bars and error bars represent means and SEM. Data were analyzed by one-way ANOVA with the Tukey’s multiple comparisons test; ns indicates not statistically significant; p < 0.05, ∗∗∗p < 0.001; ∗∗∗∗p < 0.00001. Pairwise comparisons indicated by the symbols #, §, and ¶were done using the Mann–Whitney rank sum test. #p = 0.02; §p = 0.051; p = 0.061.
FIGURE 3
FIGURE 3
Effects of STZ-treatment on atherosclerosis in the aortic sinus. (A,B) Representative images of oil red O/hematoxylin-stained cross sections of the aortic sinus of control- and STZ-treated mice maintained on the normal chow diet up to 14 weeks after the start of STZ-treatment. Scale bars represent 100 μm. (C) Quantification of atherosclerotic plaque area (n = 7 control- and 6 STZ-treated mice; p = 0.01). (D,E) Representative images of oil red O/hematoxylin-stained cross sections of the aortic sinus of control- and STZ-treated mice switched to the HFC diet 3 weeks after the start of STZ-treatment, and analyzed after 4 weeks of HFC diet feeding. Scale bars represent 100 μm. (F) Quantification of atherosclerotic plaque area (n = 14 control- and 15 STZ-treated mice; p = 0.02). (G,H) Representative images of hematoxylin and eosin-stained atherosclerotic plaques in the aortic sinus of control and STZ-treated mice after 4 weeks of HFC diet feeding, showing necrotic cores devoid of nuclei and cells. Scale bars represent 50 μm. (I) Quantification of necrotic core area expressed as a percentage of the total plaque cross-sectional area per section (n = 14 control and 15 STZ treated mice; ∗∗∗p = 0.008). Data were analyzed by the Mann–Whitney rank sum test.
FIGURE 4
FIGURE 4
HFC diet-induced atherosclerosis and platelet accumulation in coronary arteries of control and STZ-treated SR-B1-KO/hypoE mice. Heart cross sections were stained with oil red O and hematoxylin. (A–E) Representative images of coronary arteries classified as having no atherosclerotic plaques (“plaque free”), fatty streaks (arrows), identified as oil red O staining within the wall without the presence of raised plaque, or containing raised atherosclerotic plaques occluding <50, >50, or 100% of the artery lumen (as shown). Quantification of the average proportions of coronary arteries per section classified according to the degree of occlusion in control- (circles) or STZ-treated mice (squares) (F) maintained on normal chow diet for 14 weeks after the start of control- or STZ-treatment (n = 7 and 6, respectively); or (G) switched to the HFC diet 3 weeks after start of treatment and analyzed after 4 weeks of HFC diet feeding (n = 14 and 15, respectively). Representative images of trichrome stained occluded coronary arteries from control- (H) or STZ-treated mice (I) fed the HFC diet for 4 weeks. Representative images of atherosclerotic CA’s stained for activated platelets (CD41, green) and nuclei (DAPI, blue) showing an atherosclerotic coronary artery that is negative (J) and an atherosclerotic coronary artery that is positive (K) for CD41 staining. The dashed line represents the vessel wall. (L) Quantification of the numbers of CD41+ atherosclerotic coronary arteries per section for control-treated (n = 11, circles) and STZ-treated mice that had been fed the HFC diet for 4 weeks (n = 14, squares). Scale bars represent 50 μm. Data in F and G were analyzed by two-way ANOVA with Sidak’s multiple comparisons test. Data in L were analyzed by the Mann–Whitney rank sum test. p = 0.017; ∗∗p < 0.01, ∗∗∗∗p < 0.0001. All other comparisons between control- and STZ-treated samples from F and G were not statistically significantly different.
FIGURE 5
FIGURE 5
Effects of STZ- treatment on myocardial fibrosis in HFC diet fed SR-B1-KO/hypoE mice. Representative composite images of cardiac cross sections from (A) control- and (B) STZ-treated mice fed the normal chow diet and analyzed 14 weeks after the start of treatment, or (C) control- and (D) STZ-treated mice fed the HFC diet beginning 3 weeks after the start of treatment and analyzed after 4 weeks of HFC diet feeding. Sections are stained with Mason’s trichrome – healthy myocardium stains red and collagen stains blue (arrows). Scale bars represent 1.5 mm. (E) Quantification of average fibrotic (blue) area per section. Representative images of periostin staining (green) of cardiac sections from (F) control- and (G) STZ-treated mice fed the HFC diet beginning 3 weeks after the start of treatment and analyzed after 4 weeks of HFC diet feeding. (H) Control section of heart from an STZ-treated mouse fed the HFC diet in which the primary anti-periostin antibody was left out. Sections were counterstained with DAPI (blue). Scale bars represent 25 μm. (I) Quantification of periostin staining intensity per cardiac cross-sectional area for control- or STZ-treated mice that had been fed the HFC diet. (J) Heart weights, (K) body weights, and (L) heart/body weight ratios for control-treated (circles) and STZ-treated mice (squares) either maintained on the normal chow diet for 14 weeks after control/STZ-treatment (gray symbols) or fed the HFC diet for 4 weeks, beginning 3 weeks after control/STZ-treatment (black symbols). Each symbol in E and I–L represents an individual mouse. Means ± SEM are indicated by the horizontal lines and error bars. Data in E and J–L were analyzed by one-way ANOVA with Tukey’s multiple comparisons test and data in I were analyzed by the Mann–Whitney rank sum test; ns indicates not statistically significantly different (p > 0.05; p = 0.018; ∗∗p = 0.005).

Similar articles

Cited by

References

    1. Al-Jarallah A., Igdoura F., Zhang Y., Tenedero C. B., White E. J., MacDonald M. E., et al. (2013). The effect of pomegranate extract on coronary artery atherosclerosis in SR-BI/APOE double knockout mice. Atherosclerosis 228 80–89. 10.1016/j.atherosclerosis.2013.02.025 - DOI - PubMed
    1. Al-Sharea A., Murphy A. J., Huggins L. A., Hu Y., Goldberg I. J., Nagareddy P. R. (2018). SGLT2 inhibition reduces atherosclerosis by enhancing lipoprotein clearance in Ldlr(-/-) type 1 diabetic mice. Atherosclerosis 271 166–176. 10.1016/j.atherosclerosis.2018.02.028 - DOI - PMC - PubMed
    1. Braun A., Trigatti B. L., Post M. J., Sato K., Simons M., Edelberg J. M., et al. (2002). Loss of SR-BI expression leads to the early onset of occlusive atherosclerotic coronary artery disease, spontaneous myocardial infarctions, severe cardiac dysfunction, and premature death in apolipoprotein E-deficient mice. Circ. Res. 90 270–276. - PubMed
    1. Braun A., Zhang S., Miettinen H. E., Ebrahim S., Holm T. M., Vasile E., et al. (2003). Probucol prevents early coronary heart disease and death in the high-density lipoprotein receptor SR-BI/apolipoprotein E double knockout mouse. Proc. Natl. Acad. Sci. U.S.A. 100 7283–7288. 10.1073/pnas.1237725100 - DOI - PMC - PubMed
    1. de Ferranti S. D., de Boer I. H., Fonseca V., Fox C. S., Golden S. H., Lavie C. J., et al. (2014). Type 1 diabetes mellitus and cardiovascular disease: a scientific statement from the American Heart Association and American Diabetes Association. Circulation 130 1110–1130. 10.1161/CIR.0000000000000034 - DOI - PubMed