. 2018 Oct 9:9:357.
doi: 10.3389/fgene.2018.00357. eCollection 2018.

Zinc Finger-Homeodomain Transcriptional Factors (ZHDs) in Upland Cotton (Gossypium hirsutum): Genome-Wide Identification and Expression Analysis in Fiber Development

Affiliations

Zinc Finger-Homeodomain Transcriptional Factors (ZHDs) in Upland Cotton (Gossypium hirsutum): Genome-Wide Identification and Expression Analysis in Fiber Development

Muhammad Abdullah et al. Front Genet. .

Abstract

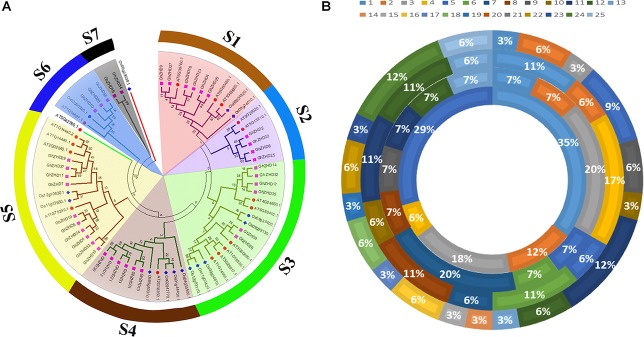
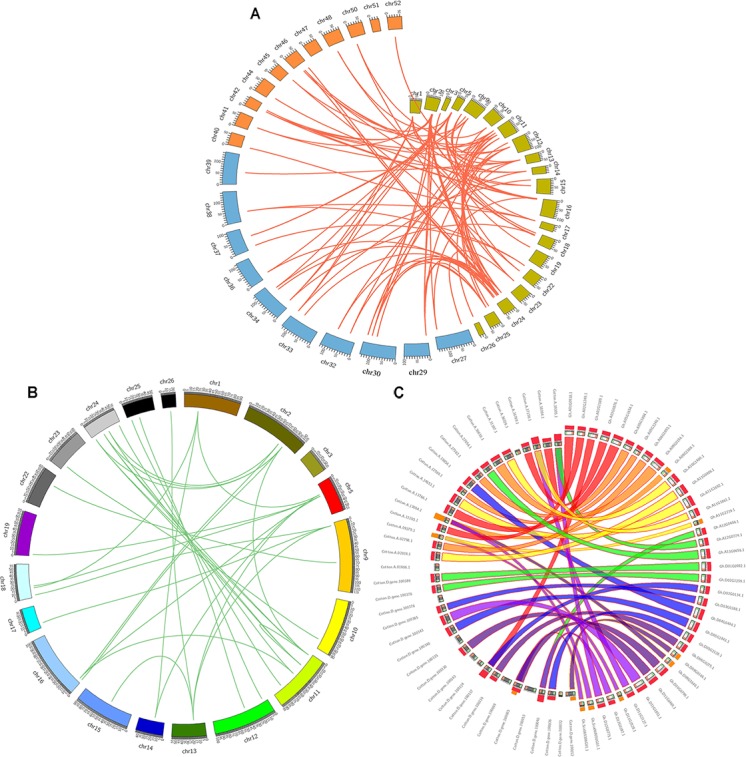
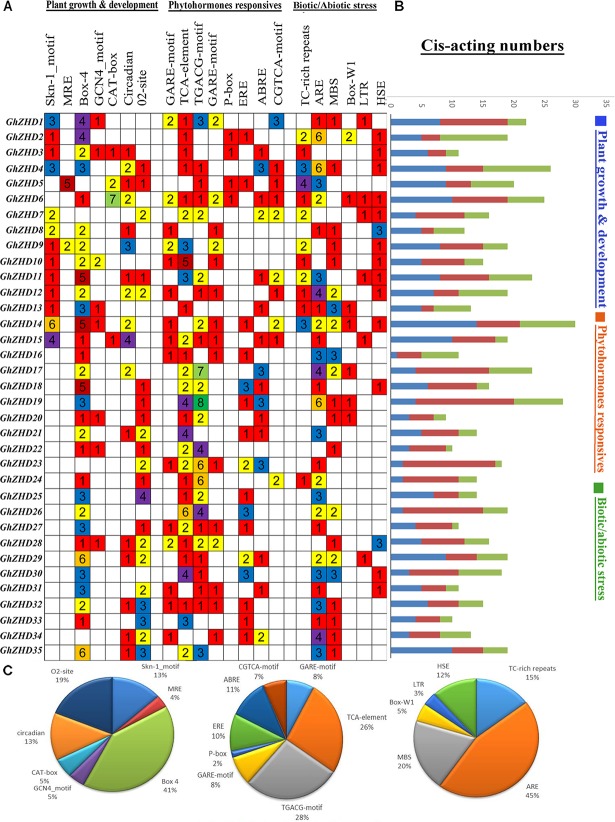
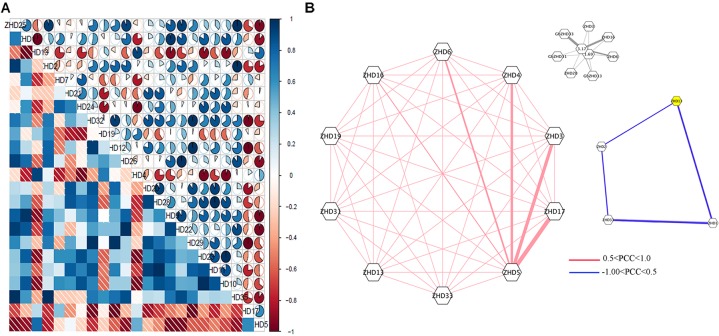
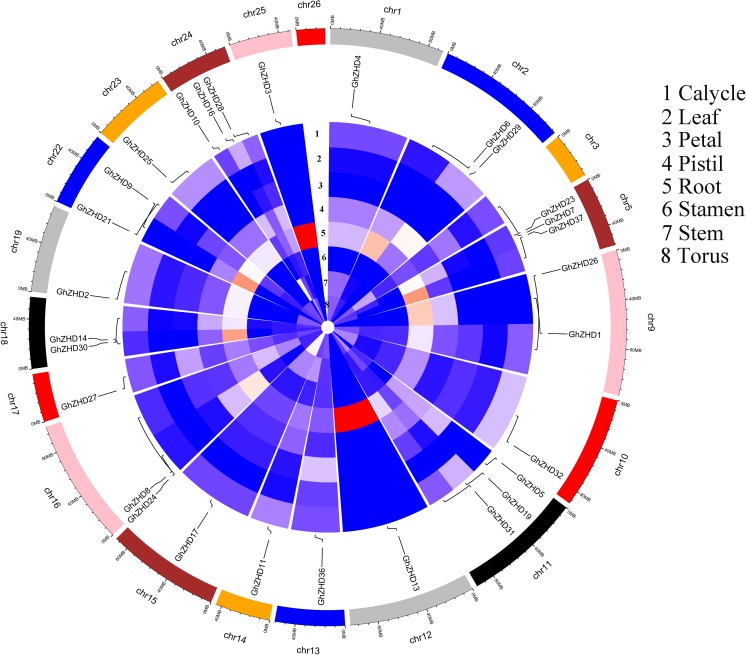
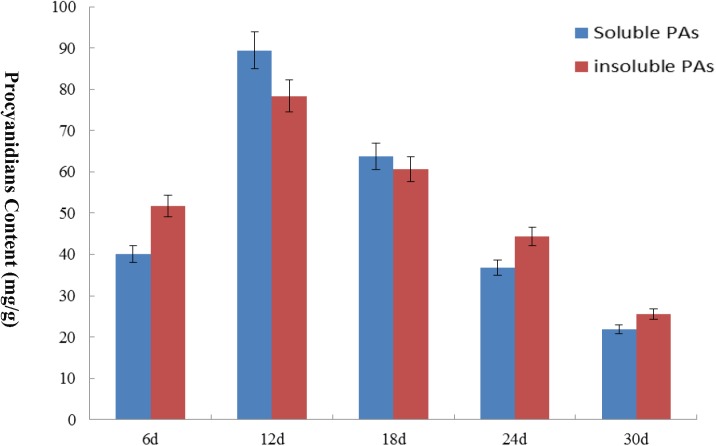
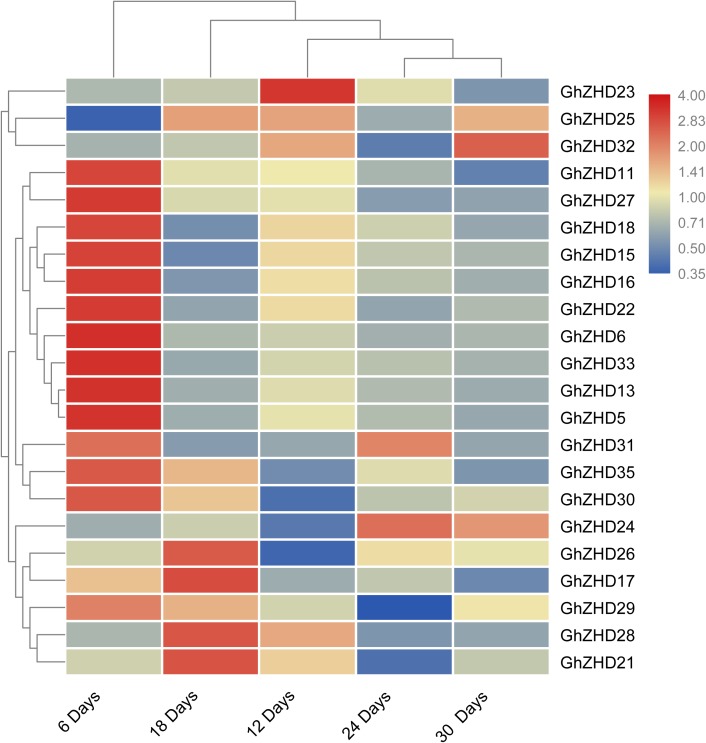
Zinc finger-homeodomain (ZHD) genes encode a family of plant-specific transcription factors that not only participate in the regulation of plant growth and development but also play an important role in the response to abiotic stress. The ZHD gene family has been studied in several model plants, including Solanum lycopersicum, Zea mays, Oryza sativa, and Arabidopsis thaliana. However, a comprehensive study of the genes of the ZHD family and their roles in fiber development and pigmentation in upland cotton has not been completed. To address this gap, we selected a brown fiber cultivar for our study; brown color in cotton is one of the most desired colors in the textile industry. The natural colored fibers require less processing and little dying, thereby eliminating dye costs and chemical residues. Using bioinformatics approaches, we identified 37 GhZHD genes from Gossypium hirsutum and then divided these genes into seven groups based on their phylogeny. The GhZHD genes were mostly conserved in each subfamily with minor variations in motif distribution and gene structure. These genes were largely distributed on 19 of the 26 upland cotton chromosomes. Among the Gossypium genomes, the paralogs and orthologs of the GhZHD genes were identified and further characterized. Furthermore, among the paralogs, we observed that the ZHD family duplications in Gossypium genomes (G. hirsutum, G. arboreum, and G. raimondii) were probably derived from segmental duplication or genome-wide duplication (GWD) events. Through a combination of qRT-PCR and proanthocyanidins (PA) accumulation analyses in brown cotton fibers, we concluded that the candidate genes involved in early fiber development and fiber pigment synthesis include the following: GhZHD29, GhZHD35, GhZHD30, GhZHD31, GhZHD11, GhZHD27, GhZHD18, GhZHD15, GhZHD16, GhZHD22, GhZHD6, GhZHD33, GhZHD13, GhZHD5, and GhZHD23. This study delivers insights into the evolution of the GhZHD genes in brown cotton, serves as a valuable resource for further studies, and identifies the conditions necessary for improving the quality of brown cotton fiber.

Keywords: ZHD; abiotic stress; fiber development; genome-wide analysis; qRT-PCR.


Figures

FIGURE 1
FIGURE 1
Phylogenetic tree of ZHD proteins from upland cotton, rice, maize, and Arabidopsis. The tree was generated with MEGA 5 software using the neighbor-joining method (A). The chromosomal distribution and percentage of ZHD family genes shared in G. hirsutum, G. arboreum, G. raimondii, and Arabidopsis. The outermost circle represents the chromosomes of G. hirsutum, followed by G. arboreum and G. raimondii, with the innermost circle representing Arabidopsis (B).
FIGURE 2
FIGURE 2
Microsynteny regions of ZHD genes among Gossypium genomes. (A) Synteny analyses of ZHD family genes between G. hirsutum, G. arboreum, and G. raimondii. The chromosome numbers of all three species are specified by different colors: olive green, blue, and orange represent the G. hirsutum, G. arboreum, and G. raimondii chromosomes, respectively. (B) Synteny of ZHD genes in the Gossypium hirsutum genome. The chromosome number is indicated on the outside by different colored boxes with the chromosome sequence lengths in megabases. Gene pairs with syntenic relationships are linked by a line. (C) Circles represent the ZHD gene sequence similarity among Gossypium genomes.
FIGURE 3
FIGURE 3
Identification of cis-acting elements in all GhZHD genes of G. hirsutum. (A) The different colors and numbers on the grid indicate the number of different promoter elements in each GhZHD gene. (B) The differently colored histograms represent the sum of cis-acting elements in each category. (C) Pie charts of different sizes indicate the ratio of each promoter element in each category.
FIGURE 4
FIGURE 4
(A) Correlation analysis during abiotic stress. Correlation analysis was carried out using the R package program. Lower squares: correlations indicated by color and shading intensity. Upper circular symbols: each correlation is shown by the shades of blue and red and the size of the fan shape. Blue and red indicate a positive correlation and a negative correlation, respectively. (B) Co-regulatory networks. The co-regulatory networks of 37 GhZHD genes under stress treatments were established based on the Pearson correlation coefficients (PCCs) of these gene pairs using RNA-Seq data. The PCC of co-regulatory gene pairs was considered significant at the 0.05 significance level (p-value). Different color line styles indicate the different significance levels of the co-regulated gene pairs.
FIGURE 5
FIGURE 5
Circular heatmap (visualized using R software) depicting the stage-specific expression profiles of GhZHD genes. The FPKMs were calculated for expression values from RNA-Seq data.
FIGURE 6
FIGURE 6
The PA content of brown cotton at different fiber development stages. The content levels of soluble PA and insoluble PA are expressed in different colors. The x-axis indicates different days of post-anthesis of cotton fibers, and the y-axis indicates the PA content. Error bars indicate SE.
FIGURE 7
FIGURE 7
Expression patterns of GhZHD genes at different fiber developmental stages of brown cotton obtained by performing qRT-PCR. The relative expression levels were calculated using the 2-ΔΔCt method.

References

    1. Abdullah M., Cao Y., Cheng X., Meng D., Chen Y., Shakoor A., et al. (2018a). The sucrose synthase gene family in chinese pear (Pyrus bretschneideri Rehd.): structure, expression, and evolution. Molecules 23 1–16. 10.3390/molecules23051144 - DOI - PMC - PubMed
    1. Abdullah M., Cao Y., Cheng X., Shakoor A., Su X., Gao J., et al. (2018b). Genome-wide analysis characterization and evolution of SBP genes in Fragaria vesca, Pyrus bretschneideri, Prunus persica and Prunus mume. Front. Genet. 9:64. 10.3389/fgene.2018.00064 - DOI - PMC - PubMed
    1. Bailey T. L., Johnson J., Grant C. E., Noble W. S. (2015). The MEME suite. Nucleic Acids Res. 43 W39–W49. 10.1093/nar/gkv416 - DOI - PMC - PubMed
    1. Bateman A. (2002). The Pfam protein families database. Nucleic Acids Res. 30 276–280. 10.1093/nar/30.1.276 - DOI - PMC - PubMed
    1. Bharathan G., Janssen B.-J., Kellogg E. A., Freeling M. (1997). Did homeodomain proteins duplicate before the origin of angiosperms, fungi, and metazoa? Evolution 94 13749–13753. 10.1073/pnas.94.25.13749 - DOI - PMC - PubMed