. 2018 Oct 9:9:1450.
doi: 10.3389/fpls.2018.01450. eCollection 2018.

Overlapping Patterns of Gene Expression Between Gametophyte and Sporophyte Phases in the Fern Polypodium amorphum (Polypodiales)

Affiliations

Overlapping Patterns of Gene Expression Between Gametophyte and Sporophyte Phases in the Fern Polypodium amorphum (Polypodiales)

Erin M Sigel et al. Front Plant Sci. .

Abstract

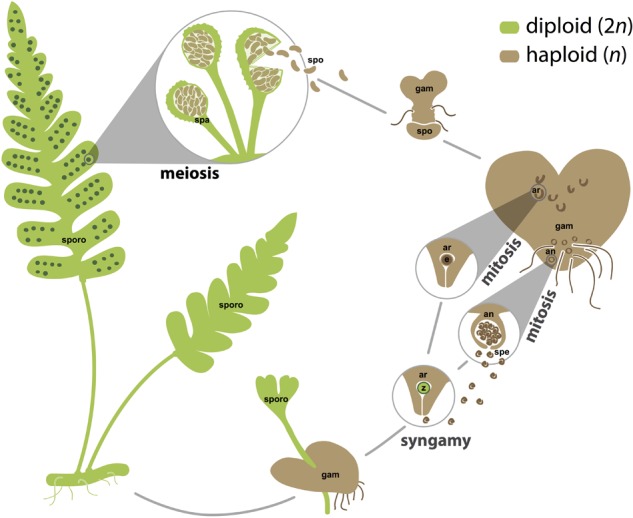
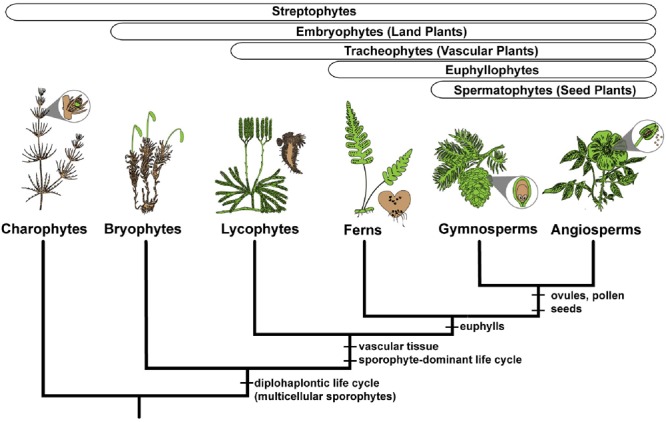
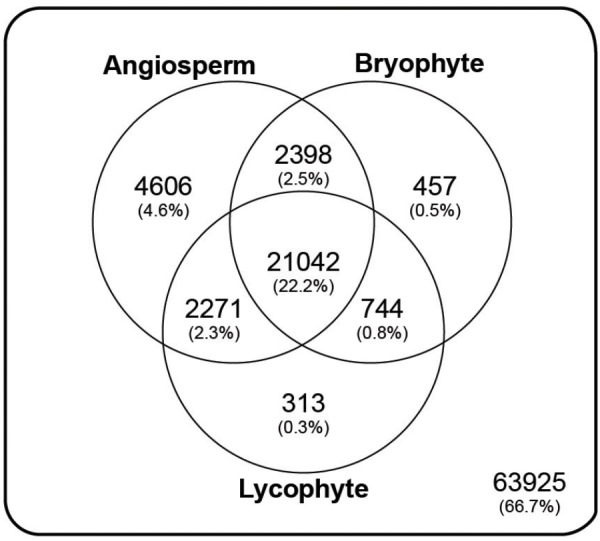
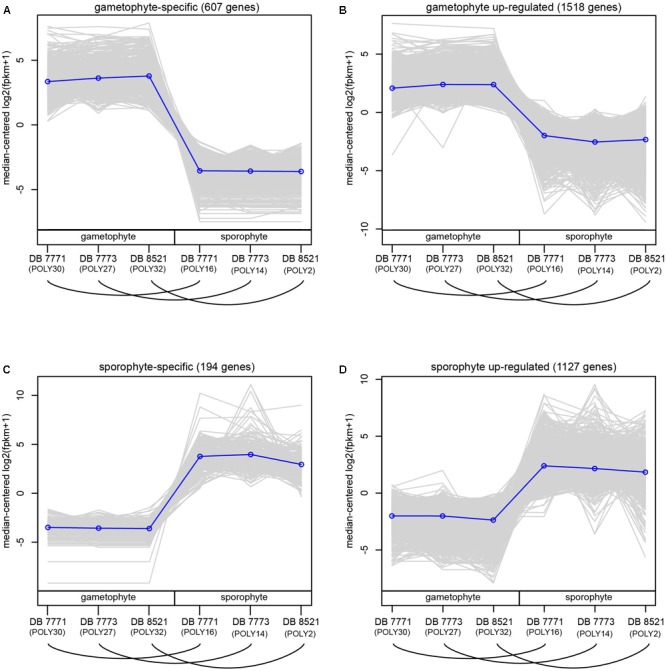
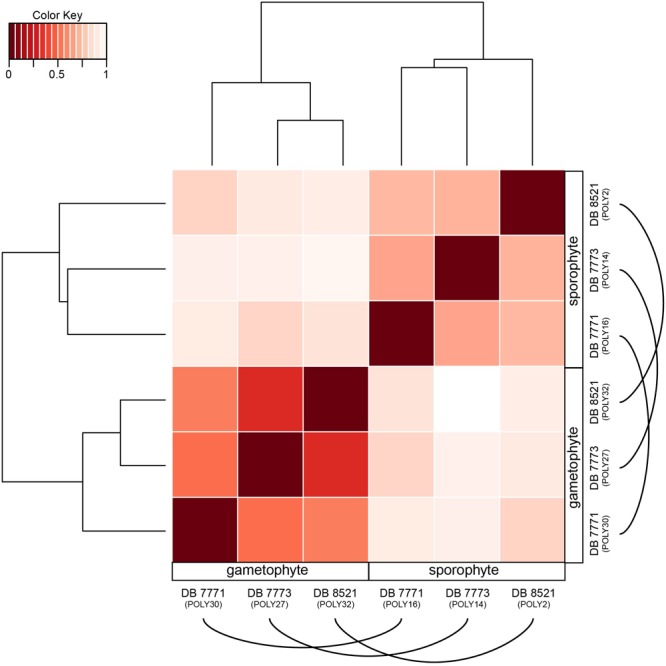
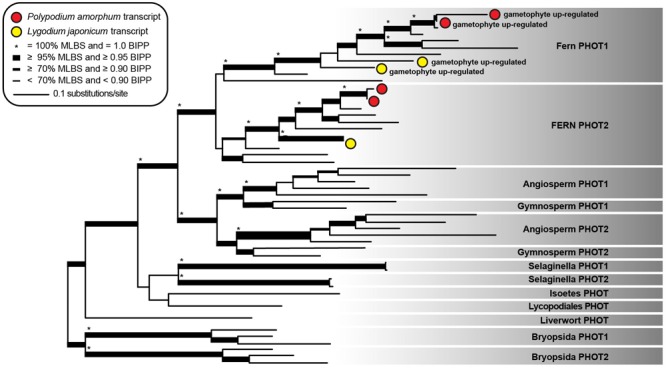
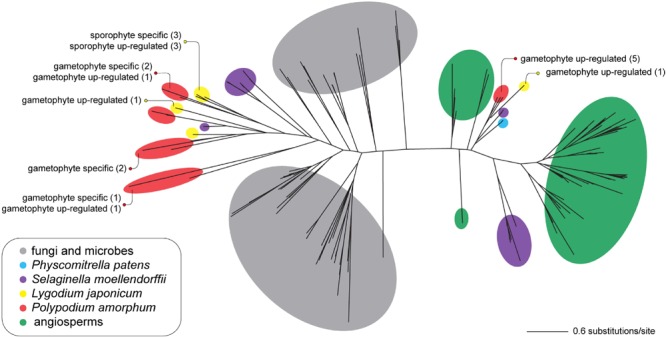
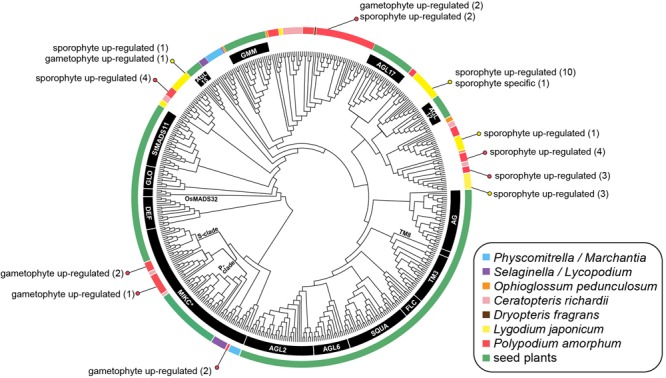
Ferns are unique among land plants in having sporophyte and gametophyte phases that are both free living and fully independent. Here, we examine patterns of sporophytic and gametophytic gene expression in the fern Polypodium amorphum, a member of the homosporous polypod lineage that comprises 80% of extant fern diversity, to assess how expression of a common genome is partitioned between two morphologically, ecologically, and nutritionally independent phases. Using RNA-sequencing, we generated transcriptome profiles for three replicates of paired samples of sporophyte leaf tissue and whole gametophytes to identify genes with significant differences in expression between the two phases. We found a nearly 90% overlap in the identity and expression levels of the genes expressed in both sporophytes and gametophytes, with less than 3% of genes uniquely expressed in either phase. We compare our results to those from similar studies to establish how phase-specific gene expression varies among major land plant lineages. Notably, despite having greater similarity in the identity of gene families shared between P. amorphum and angiosperms, P. amorphum has phase-specific gene expression profiles that are more like bryophytes and lycophytes than seed plants. Our findings suggest that shared patterns of phase-specific gene expression among seed-free plants likely reflect having relatively large, photosynthetic gametophytes (compared to the gametophytes of seed plants that are highly reduced). Phylogenetic analyses were used to further investigate the evolution of phase-specific expression for the phototropin, terpene synthase, and MADS-box gene families.

Keywords: MADS-box; gametophyte; life cycle; phototropins; sporophyte; terpene synthases; transcriptomics.


Figures

FIGURE 1
FIGURE 1
The homosporous fern life cycle. Sporophyte tissues, which are usually but not necessarily diploid, are shown in green. Gametophyte tissues and spores, which are often but not necessarily haploid, are shown in brown. Spores are generated by meiosis in sporangia. Gametes, both eggs and sperm, are generated by mitosis in archegonia and antheridia, respectively. For simplicity, fertilization is depicted between an egg and sperm from the same gametophyte, but fertilization is also likely to occur between gametes from different gametophytes that are derived from the same or different sporophytes. an, antheridium; ar, archegonium; e, egg; gam, gametophyte; spa, sporangium; spe, sperm; spo, spore; sporo, sporophyte; z, zygote. Images are not to scale.
FIGURE 2
FIGURE 2
Simplified phylogeny of the major clades of streptophyte plants, illustrating the gametophyte (colored brown) and sporophyte (colored green) phases for exemplar lineages. Charophyte algae have a multicellular gametophyte and a single celled sporophyte. All embryophytes, or land plants, have multicellular gametophytes and multicellular sporophytes. Synapomorphies are shown for the major clades.
FIGURE 3
FIGURE 3
Taxonomic summary of the annotated Polypodium amorphum reference transcriptome. Of the 98000 total genes, 63925 were not assigned to an orthogroup in the Plant Tribes classification (Wall et al., 2008). All remaining genes were assigned to an orthogroup with a predicted protein in the genome of at least one angiosperm species, the lycophyte Selaginella moellendorffii, and/or the bryophyte Physcomitrella patens.
FIGURE 4
FIGURE 4
Normalized expression (log2-transformed FPKM + 1) of genes assigned to four categories of differential expression using the criteria of log2FC ≥ 2 and padj ≤ 0.002. Each gray line represents the expression level of a particular gene relative to the median expression level of all genes in that expression category. Blue lines represent the median expression level for each expression category. Samples are labeled as gametophyte or sporophyte, with an arched line connecting samples derived from the same Polypodium amorphum individual. (A) gametophyte-specific genes; (B) gametophyte up-regulated genes; (C) sporophyte-specific genes; (D) sporophyte up-regulated genes.
FIGURE 5
FIGURE 5
Heat map showing the hierarchically clustered Euclidean distance matrix resulting from comparing the transcript expression values (log2-transformed FPKM + 1) for each pair of Polypodium amorphum samples. Samples are labeled as gametophyte or sporophyte, with an arched line connecting samples derived from the same P. amorphum individual.
FIGURE 6
FIGURE 6
Phylogram of the best maximum likelihood tree of phototropin sequences. Shading indicates taxonomic specific phototropin clades as described in Li et al. (2015). Red and yellow circles represent single transcripts from the ferns Polypodium amorphum and Lygodium japonicum, respectively, that are up-regulated in the gametophyte phase. Node support values are as indicated in the inset legend. MLBS, maximum likelihood bootstrap value; BIPP, Bayesian inference posterior probability.
FIGURE 7
FIGURE 7
Unrooted phylogram of the best maximum likelihood tree of terpene synthase sequences. Colored circles indicate the taxonomic identity of particular sequences (see inset legend). Text describes the number of transcripts that are phase specific or up-regulated in the ferns Polypodium amorphum (red) and Lygodium japonicum (yellow). Node support values are provided at Figshare (doi: 10.6084/m9.figshare.c.4229141).
FIGURE 8
FIGURE 8
Cladogram of the best maximum likelihood tree of land plant Type II MADS-box sequences. Specific MADS-box genes, as described by Kwantes et al. (2011) and Gramzow and Theissen (2013), are indicated by black lines or along branches. Colored lines indicate the taxonomic identity of particular sequences (see inset legend). Colored dots and text describes the number of transcripts that are phase-specific or phase up-regulated in the ferns Polypodium amorphum (red) and Lygodium japonicum (yellow). Node support values are provided at Figshare (doi: 10.6084/m9.figshare.c.4229141).

References

    1. Ambrose B. (2010). MADS-box genes in plant evolution and development. Int J Plant Dev. Biol. 4 30–37.
    1. Andrews S. (2010). FastQC: a Quality Control Tool for High Throughput Sequence Data. Available at: http://www.bioinformatics.babraham.ac.uk/projects/fastqc
    1. Aya K., Kobayashi M., Tanaka J., Ohyanagi H., Suzuki T., Yano K., et al. (2015). De novo transcriptome assembly of a fern, Lygodium japonicum, and a web resource database, Ljtrans DB. Plant Cell Physiol. 56:e5. 10.1093/pcp/pcu184 - DOI - PubMed
    1. Banks J. A., Nishiyama T., Hasebe M., Bowman J. L., Gribskov M., Albert V. A., et al. (2011). The Selaginella genome identifies genetic changes associated with the evolution of vascular plants. Science 33 960–963. 10.1126/science.1203810 - DOI - PMC - PubMed
    1. Barker M. S., Wolf P. G. (2010). Unfurling fern biology in the age of genomics. Bioscience 60 177–185. 10.1525/bio.2010.60.3.4 - DOI

LinkOut - more resources