. 2018 Sep 25:9:1336.
doi: 10.3389/fphys.2018.01336. eCollection 2018.

PGC-1α and PGC-1β Increase Protein Synthesis via ERRα in C2C12 Myotubes

Affiliations

PGC-1α and PGC-1β Increase Protein Synthesis via ERRα in C2C12 Myotubes

Erin L Brown et al. Front Physiol. .

Abstract

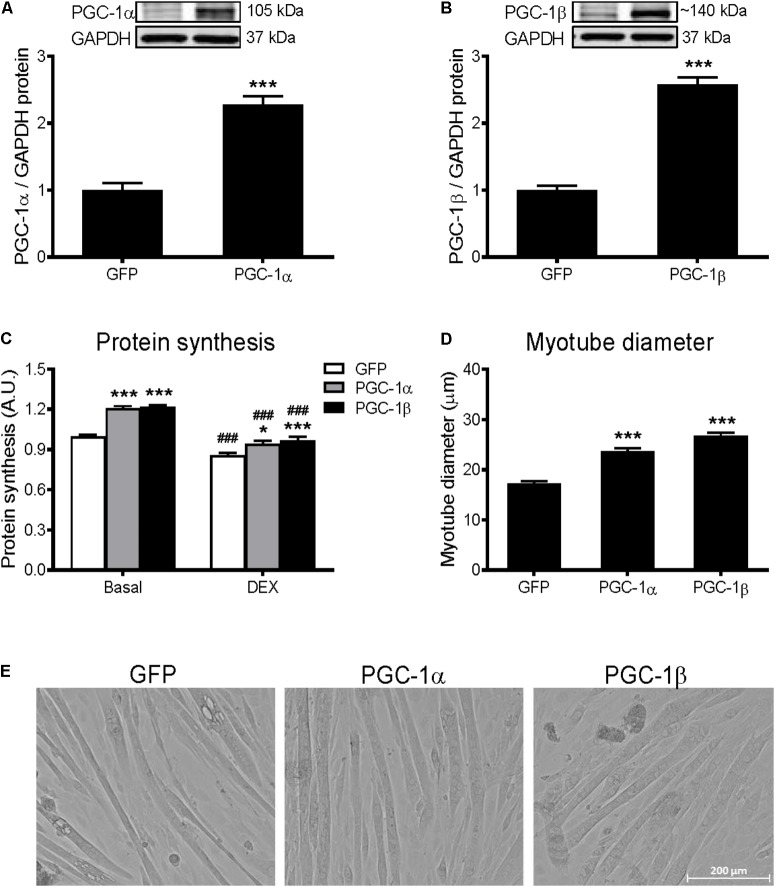
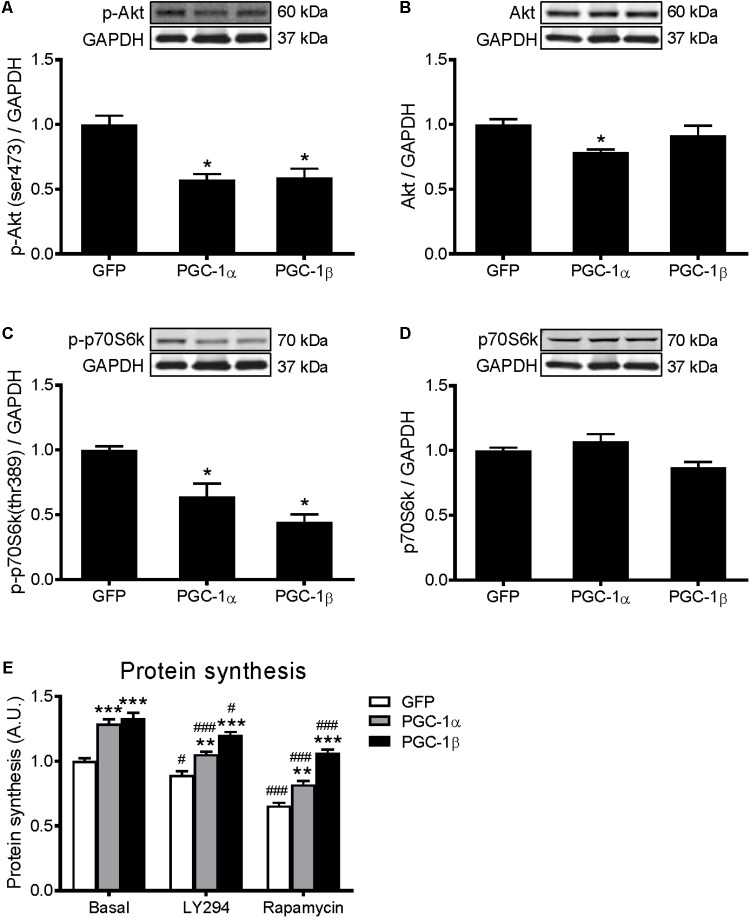
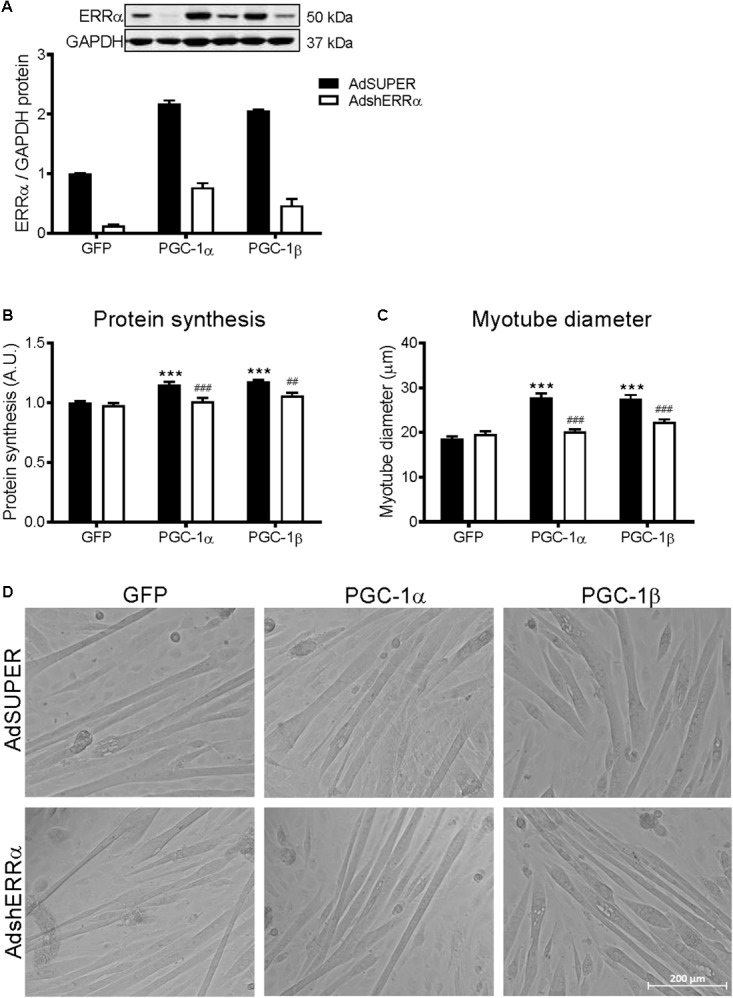
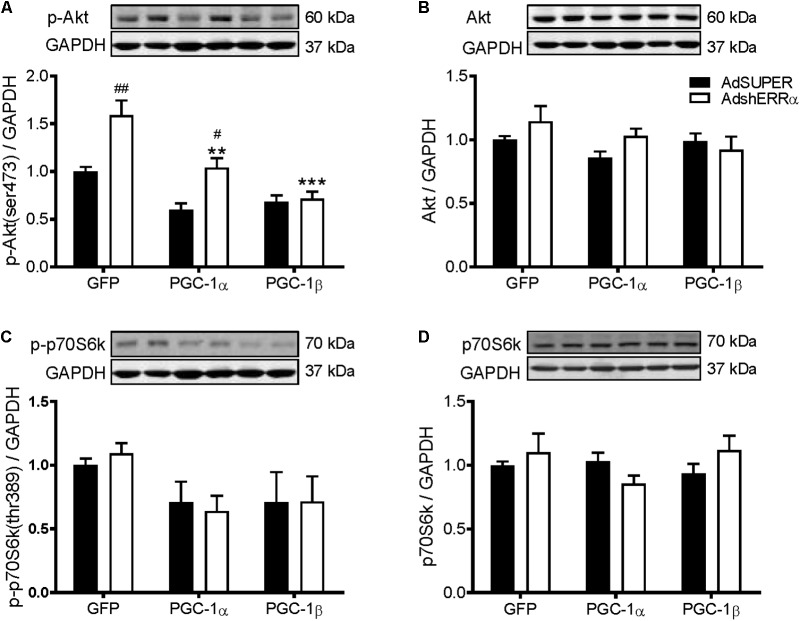
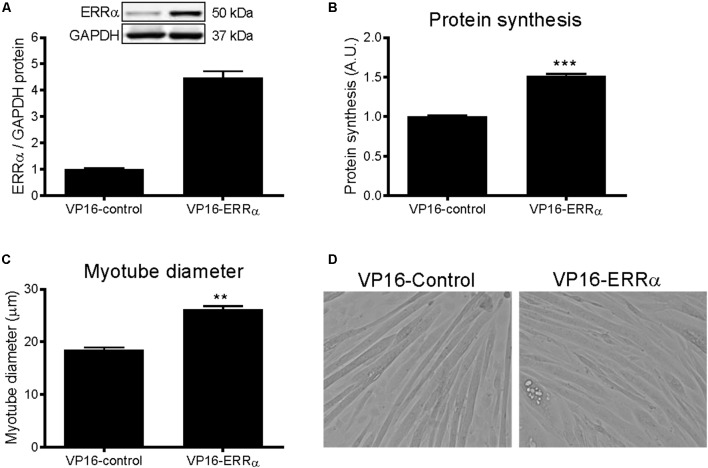
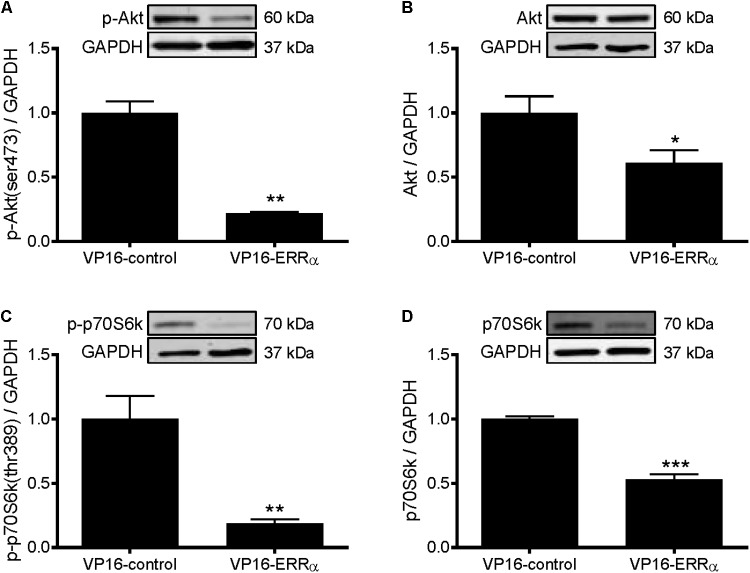
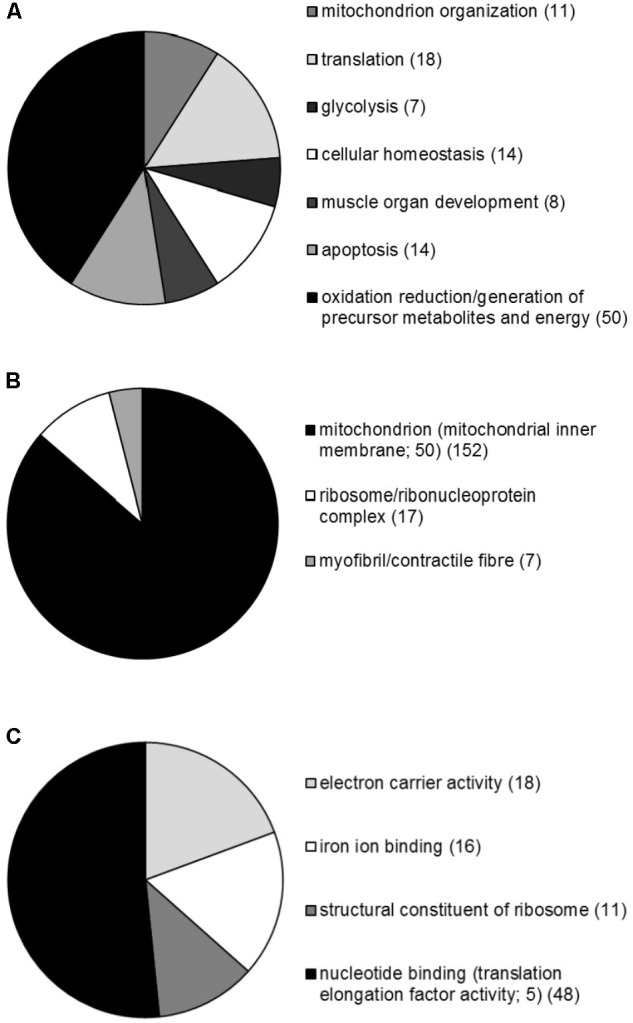
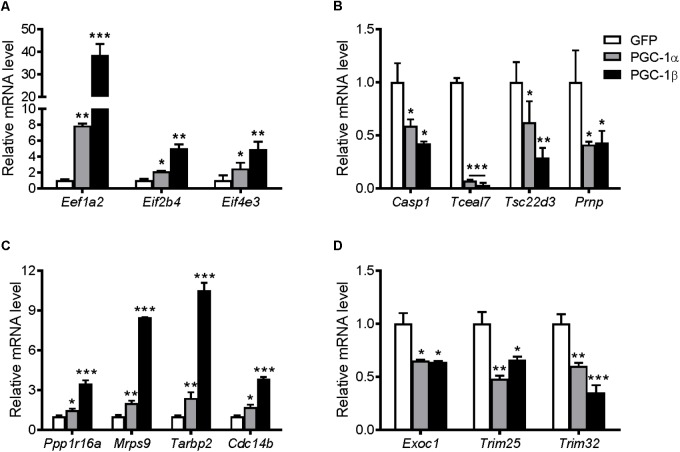
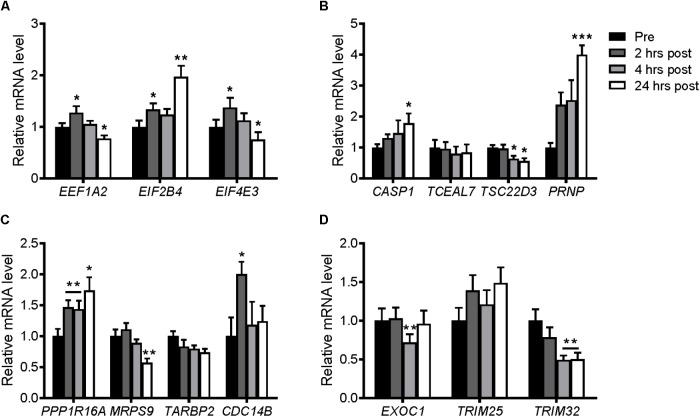
The transcriptional coactivators peroxisome proliferator-activated receptor-γ coactivator-1α (PGC-1α) and PGC-1β are positive regulators of skeletal muscle mass and energy metabolism; however, whether they influence muscle growth and metabolic adaptations via increased protein synthesis is not clear. This study revealed PGC-1α or PGC-1β overexpression in C2C12 myotubes increased protein synthesis and myotube diameter under basal conditions and attenuated the loss in protein synthesis following the treatment with the catabolic agent, dexamethasone. To investigate whether PGC-1α or PGC-1β signal through the Akt/mTOR pathway to increase protein synthesis, treatment with the PI3K and mTOR inhibitors, LY294002 and rapamycin, respectively, was undertaken but found unable to block PGC-1α or PGC-1β's promotion of protein synthesis. Furthermore, PGC-1α and PGC-1β decreased phosphorylation of Akt and the Akt/mTOR substrate, p70S6K. In contrast to Akt/mTOR inhibition, the suppression of ERRα, a major effector of PGC-1α and PGC-1β activity, attenuated the increase in protein synthesis and myotube diameter in the presence of PGC-1α or PGC-1β overexpression. To characterize further the biological processes occurring, gene set enrichment analysis of genes commonly regulated by both PGC-1α and PGC-1β was performed following a microarray screen. Genes were found enriched in metabolic and mitochondrial oxidative processes, in addition to protein translation and muscle development categories. This suggests concurrent responses involving both increased metabolism and myotube protein synthesis. Finally, based on their known function or unbiased identification through statistical selection, two sets of genes were investigated in a human exercise model of stimulated protein synthesis to characterize further the genes influenced by PGC-1α and PGC-1β during physiological adaptive changes in skeletal muscle.

Keywords: C2C12 myotubes; ERRα; PGC-1α; PGC-1β; metabolism; muscle mass; protein synthesis; resistance exercise.


Figures

FIGURE 1
FIGURE 1
Protein synthesis and myotube diameter in GFP, PGC-1α, and PGC-1β infected C2C12 myotubes. (A) PGC-1α and (B) PGC-1β protein 72 h after infection with GFP, PGC-1α, and PGC-1β adenoviruses. Bands were normalized to GAPDH protein; n = 4 per group. ∗∗∗P < 0.001 vs. GFP. (C) Protein synthesis under basal and dexamethasone (DEX)-treated conditions, when measured for 24 h following 48 h of infection with GFP, PGC-1α, and PGC-1β adenoviruses. n = 5–10 per group. P < 0.05, ∗∗∗P < 0.001 vs. GFP within the same treatment; ###P < 0.001 vs. basal within the same condition. (D) Average myotube diameter from 10 myotubes per visual field (10 visual fields for each group). ∗∗∗P < 0.001 vs. GFP. (E) Representative images of myotubes infected with GFP, PGC-1α, and PGC-1β adenoviruses for 72 h.
FIGURE 2
FIGURE 2
Western blot analysis of Akt and p70S6k proteins in GFP, PGC-1α, and PGC-1β infected C2C12 myotubes. Myotubes were infected with GFP, PGC-1α, or PGC-1β adenoviruses for 48 h, and samples were extracted after 72 h. (A) Phospho-Akt (ser473), (B) total Akt protein, (C) phospho-p70S6k (thr389), and (D) total p70S6k protein expression. Samples were harvested after 72 h of infection. Bands were normalized to GAPDH protein. The same control images have been used for A,C, and B,D. n = 5 per group. P < 0.01 vs. GFP. (E) Protein synthesis in GFP, PGC-1α, and PGC-1β infected C2C12 myotubes, treated with LY294002 (LY294) or Rapamycin and compared to basal conditions. n = 6, repeated in three experiments. ∗∗P < 0.01, ∗∗∗P < 0.001 vs. GFP within the same treatment; #P < 0.05, ###P < 0.001 vs. control within the same condition.
FIGURE 3
FIGURE 3
Protein synthesis and myotube diameter in C2C12 myotubes infected with AdshERRα and PGC-1 adenoviruses. Myotubes were infected with either AdSUPER or AdshERRα for 24 h, followed by infection with GFP, PGC-1α, or PGC-1β for a further 48 h. (A) ERRα protein, normalized to GAPDH protein. n = 3–4 per group. (B) Protein synthesis, measured via [3H]-tyrosine incorporation for 24 hours after infections. n = 6 per group, repeated in three experiments. (C) Average myotube diameter from 10 myotubes per visual field (10 visual fields for each group). (D) Representative images of GFP, PGC-1α, and PGC-1β infected myotubes, with AdSUPER or AdshERRα. ∗∗∗P < 0.001 vs. GFP-AdSUPER. ##P < 0.01, ###P < 0.001 vs. AdSUPER for each condition. A.U., arbitrary units.
FIGURE 4
FIGURE 4
Western blot analysis of Akt and p70S6k proteins in C2C12 myotubes infected with AdshERRα and PGC-1 adenoviruses. Myotubes were infected with either AdSUPER or AdshERRα for 24 h, followed by infection with GFP, PGC-1α, or PGC-1β for a further 48 h. Samples were harvested after 96 h. (A) Phospho-Akt (ser473), (B) total Akt protein, (C) phospho-p70S6k (thr389), and (D) total p70S6k protein expression. Bands were normalized to GAPDH protein. The same control images have been used for A–C. n = 4 per group. ∗∗P < 0.01, ∗∗∗P < 0.001 vs. GFP-AdShERRα; #P < 0.05, ##P < 0.01 vs. to AdSUPER for each condition.
FIGURE 5
FIGURE 5
Protein synthesis and myotube diameter in VP16-ERRα infected C2C12 myotubes. (A) ERRα protein, normalized to GAPDH protein. n = 4 per group. (B) Protein synthesis, measured by [3H]-tyrosine incorporation for 24 h following 48 h of infection with VP16-control or VP16-ERRα adenoviruses. n = 6 per group, repeated in three experiments. (C) Average myotube diameter from 10 myotubes per visual field (10 visual fields for each group). (D) Representative images of myotubes infected with VP16-control or VP16-ERRα for 72 hours. ∗∗∗P < 0.001 vs. VP16-control. A.U., arbitrary units.
FIGURE 6
FIGURE 6
Western blot analysis of Akt and p70S6k proteins in VP16-ERRα infected C2C12 myotubes. Myotubes were infected with VP16-control or VP16-ERRα adenoviruses for 48 h, and samples were extracted after 72 h. (A) phospho-Akt (ser473), (B) total Akt protein, (C) phospho-p70S6k (thr389), and (D) total p70S6k protein expression. Bands were normalized to GAPDH protein. The same control images have been used for A,B. n = 5 per group. P < 0.05, ∗∗P < 0.01, ∗∗∗P < 0.001 vs. VP16-control.
FIGURE 7
FIGURE 7
Overview of the GSEA performed on genes commonly regulated by both PGC-1α and PGC-1β in C2C12 myotubes. Proportional representation of gene numbers significantly enriched in GO-related (A) biological processes, (B) cellular compartment, and (C) molecular functions with the number of genes indicated in brackets. The proportion of genes making up the specific sub-groups; CC GO term mitochondrial inner membrane, and MF GO terms translation elongation factor activity are also indicated.
FIGURE 8
FIGURE 8
mRNA expression of genes identified from the microarray based on their GO terms involved with protein synthesis, translation, and growth. Myotubes were infected with GFP, PGC-1α, or PGC-1β adenoviruses for 48 h, and samples were extracted after 72 h. mRNA of biasedly selected genes that were (A) upregulated and (B) downregulated in the microarray. mRNA expression of the genes selected unbiasedly from the microarray that were most significantly (C) upregulated and (D) downregulated. Values were normalized to 36B4 mRNA expression. n = 3, repeated in three experiments. P < 0.05, ∗∗P < 0.01, ∗∗∗P < 0.001 vs. GFP.
FIGURE 9
FIGURE 9
mRNA expression of genes selected from the microarray in skeletal muscle after an acute bout of resistance exercise in humans. Muscle samples were taken before and 2, 4, and 24 h after resistance exercise. (A) Upregulated genes and (B) downregulated genes selected biasedly; and (C) upregulated genes and (D) downregulated genes selected unbiasedly from the microarray. Values were normalized to 36B4 mRNA expression. n = 8. P < 0.05, ∗∗P < 0.01, ∗∗∗P < 0.001 vs. Pre-exercise (Pre).

References

    1. Arany Z., Foo S. Y., Ma Y., Ruas J. L., Bommi-Reddy A., Girnun G., et al. (2008). HIF-independent regulation of VEGF and angiogenesis by the transcriptional coactivator PGC-1alpha. Nature 451 1008–1012. 10.1038/nature06613 - DOI - PubMed
    1. Arany Z., Lebrasseur N., Morris C., Smith E., Yang W., Ma Y., et al. (2007). The transcriptional coactivator PGC-1beta drives the formation of oxidative type IIX fibers in skeletal muscle. Cell Metab. 5 35–46. 10.1016/j.cmet.2006.12.003 - DOI - PubMed
    1. Assereto S., Piccirillo R., Baratto S., Scudieri P., Fiorillo C., Massacesi M., et al. (2016). The ubiquitin ligase tripartite-motif-protein 32 is induced in Duchenne muscular dystrophy. Lab. Invest. 96 862–871. 10.1038/labinvest.2016.63 - DOI - PubMed
    1. Benton C. R., Nickerson J. G., Lally J., Han X. X., Holloway G. P., Glatz J. F., et al. (2008). Modest PGC-1alpha overexpression in muscle in vivo is sufficient to increase insulin sensitivity and palmitate oxidation in subsarcolemmal, not intermyofibrillar, mitochondria. J. Biol. Chem. 283 4228–4240. 10.1074/jbc.M704332200 - DOI - PubMed
    1. Bodine S. C., Stitt T. N., Gonzalez M., Kline W. O., Stover G. L., Bauerlein R., et al. (2001). Akt/mTOR pathway is a crucial regulator of skeletal muscle hypertrophy and can prevent muscle atrophy in vivo. Nat. Cell Biol. 3 1014–1019. 10.1038/ncb1101-1014 - DOI - PubMed