

Interferon-α Up-Regulates the Expression of PD-L1 Molecules on Immune Cells Through STAT3 and p38 Signaling
- PMID: 30356906
- PMCID: PMC6190899
- DOI: 10.3389/fimmu.2018.02129
Interferon-α Up-Regulates the Expression of PD-L1 Molecules on Immune Cells Through STAT3 and p38 Signaling
Abstract
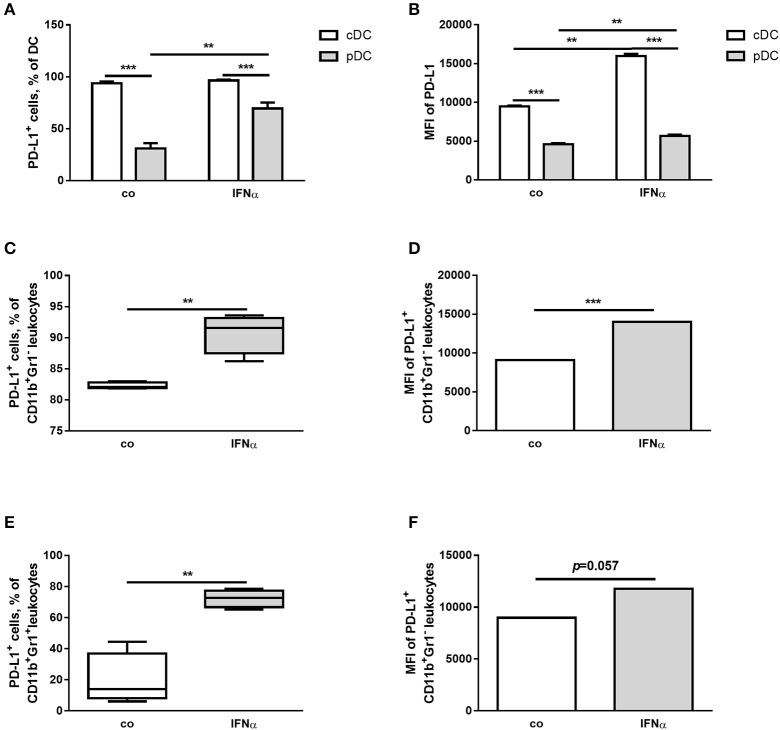
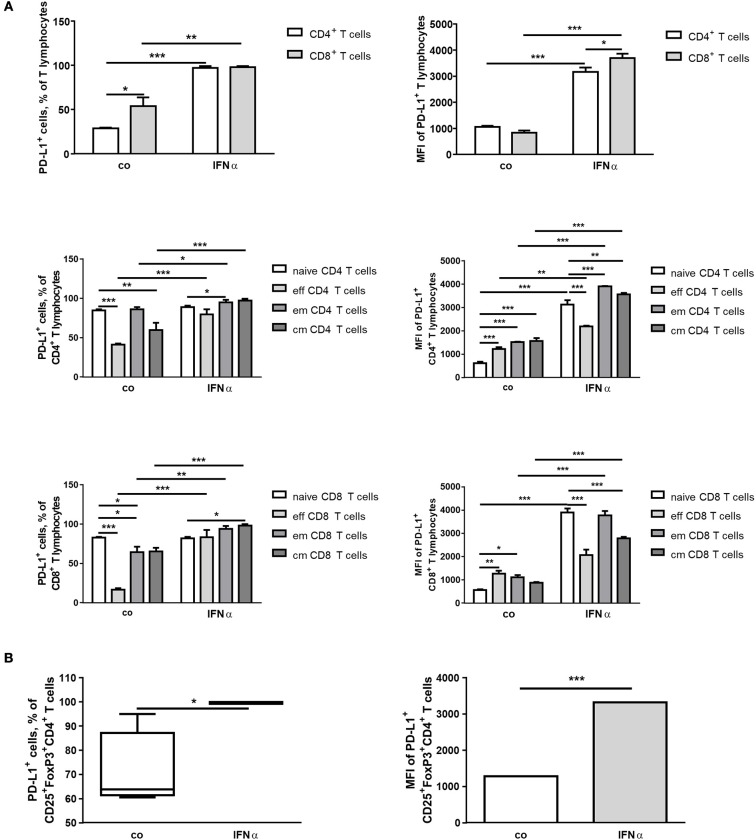
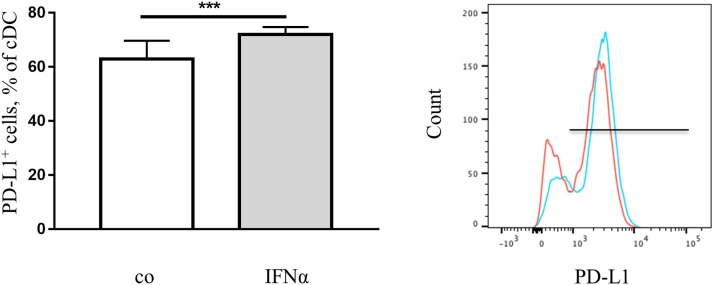
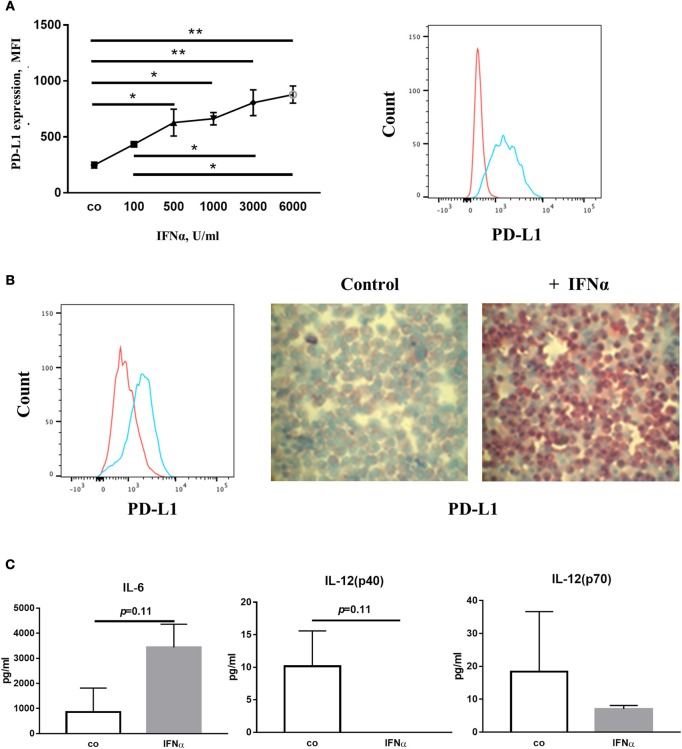
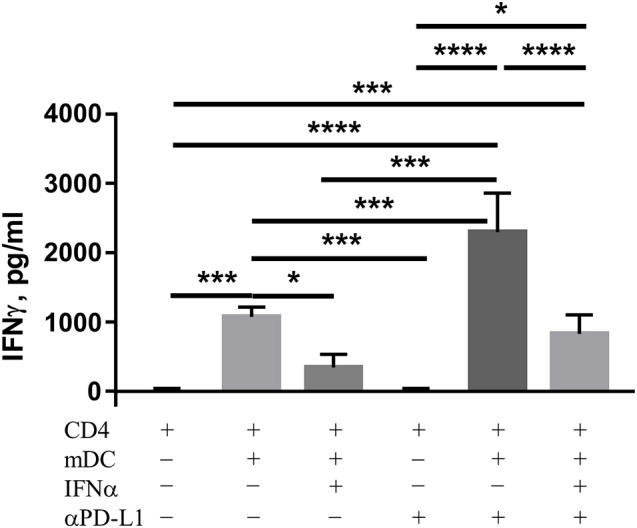
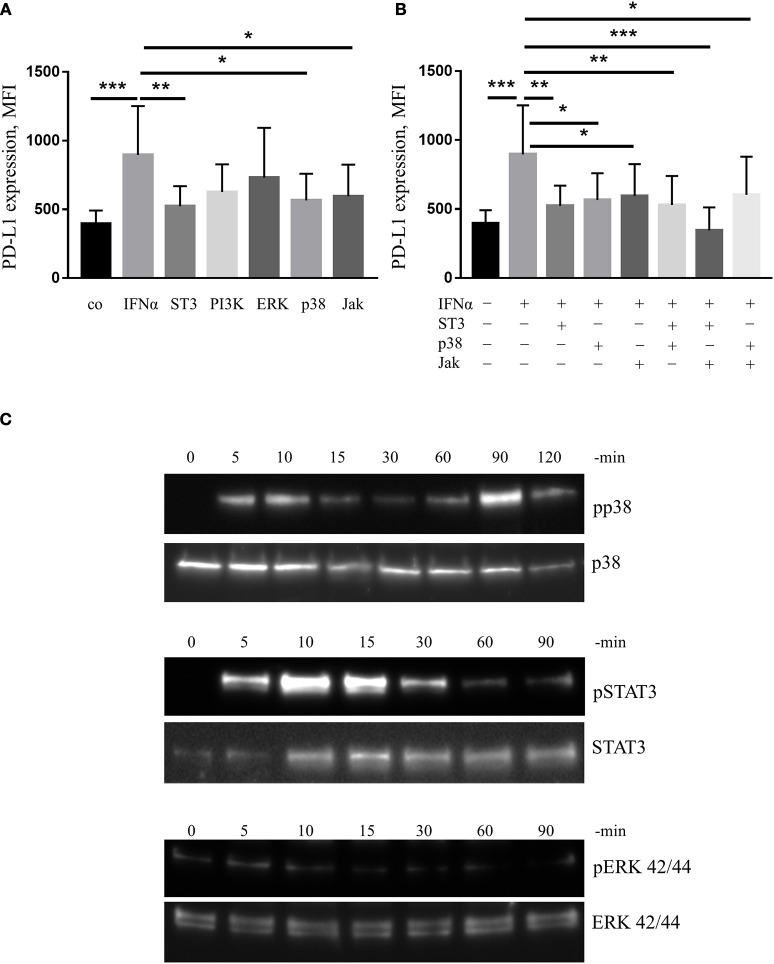
Interferon-α (IFNα) has one of the longest histories of use amongst cytokines in clinical oncology and has been applied for the treatment of many types of cancers. Due to its immune-activating properties, IFNα is also an attractive candidate for combinatory anti-cancer therapies. Despite its extensive use in animal tumor models as well as in several clinical trials, the different mechanisms underlying patient responses and affecting desirable clinical benefits are still under investigation. Here we show that in addition to its immune-activating properties, IFNα induces the expression of a key negative regulator, immunosuppressive PD-L1 molecule, in the majority of the specific immune cell populations, particularly in the dendritic cells (DC). DC can modulate immune responses by a variety of mechanisms, including expression of T-cell regulatory molecules and cytokines. Our results showed that treatment of DC with IFNα-2b led to pronounced up-regulation of surface expression of PD-L1 molecules, increased IL-6 and decreased IL-12 production. Moreover, we present evidence that IFNα-treated DC exhibited a reduced capacity to stimulate interferon-γ production in T cells compared to control DC. This T-cell response after treatment of DC with IFNα was recovered by a pre-treatment with an anti-PD-L1 blocking antibody. Further analyses revealed that IFNα regulated PD-L1 expression through the STAT3 and p38 signaling pathways, since blocking of STAT3 and p38 activation with specific inhibitors prevented PD-L1 up-regulation. Our findings underline the important roles of p38 and STAT3 in the regulation of PD-L1 expression and prove that IFNα induces STAT3/p38-mediated expression of PD-L1 and thereby a reduced stimulatory ability of DC. The augmentation of PD-L1 expression in immune cells through IFNα treatment should be considered by use of IFNα in an anti-cancer therapy.
Keywords: IFNα; PD-L1 (B7-H1); STAT3 signaling; cancer immunotherapy; dendritic cell; immunosuppression.
Figures
Similar articles
-
CXCL9 secreted by tumor-associated dendritic cells up-regulates PD-L1 expression in bladder cancer cells by activating the CXCR3 signaling.BMC Immunol. 2021 Jan 6;22(1):3. doi: 10.1186/s12865-020-00396-3. BMC Immunol. 2021. PMID: 33407095 Free PMC article.
-
Enhanced anti-tumor effects of the PD-1 blockade combined with a highly absorptive form of curcumin targeting STAT3.Cancer Sci. 2020 Dec;111(12):4326-4335. doi: 10.1111/cas.14675. Epub 2020 Oct 20. Cancer Sci. 2020. PMID: 33006786 Free PMC article.
-
Blockage of immune checkpoint molecules increases T-cell priming potential of dendritic cell vaccine.Immunology. 2020 Jan;159(1):75-87. doi: 10.1111/imm.13126. Epub 2019 Oct 24. Immunology. 2020. PMID: 31587253 Free PMC article.
-
Regulation of PD-L1: a novel role of pro-survival signalling in cancer.Ann Oncol. 2016 Mar;27(3):409-16. doi: 10.1093/annonc/mdv615. Epub 2015 Dec 17. Ann Oncol. 2016. PMID: 26681673 Review.
-
What Do We Have to Know about PD-L1 Expression in Prostate Cancer? A Systematic Literature Review. Part 4: Experimental Treatments in Pre-Clinical Studies (Cell Lines and Mouse Models).Int J Mol Sci. 2021 Nov 14;22(22):12297. doi: 10.3390/ijms222212297. Int J Mol Sci. 2021. PMID: 34830179 Free PMC article.
Cited by
-
IFN-I-tolerant oncolytic Semliki Forest virus in combination with anti-PD1 enhances T cell response against mouse glioma.Mol Ther Oncolytics. 2021 Mar 17;21:37-46. doi: 10.1016/j.omto.2021.03.008. eCollection 2021 Jun 25. Mol Ther Oncolytics. 2021. PMID: 33869741 Free PMC article.
-
MerTK-mediated efferocytosis promotes immune tolerance and tumor progression in osteosarcoma through enhancing M2 polarization and PD-L1 expression.Oncoimmunology. 2022 Jan 12;11(1):2024941. doi: 10.1080/2162402X.2021.2024941. eCollection 2022. Oncoimmunology. 2022. PMID: 35036076 Free PMC article.
-
Mitogen-activated protein kinase phosphatase-1 controls PD-L1 expression by regulating type I interferon during systemic Escherichia coli infection.J Biol Chem. 2022 May;298(5):101938. doi: 10.1016/j.jbc.2022.101938. Epub 2022 Apr 13. J Biol Chem. 2022. PMID: 35429501 Free PMC article.
-
DLX2 Is a Potential Immune-Related Prognostic Indicator Associated with Remodeling of Tumor Microenvironment in Lung Squamous Cell Carcinoma: An Integrated Bioinformatical Analysis.Dis Markers. 2022 Oct 21;2022:6512300. doi: 10.1155/2022/6512300. eCollection 2022. Dis Markers. 2022. PMID: 36317140 Free PMC article.
-
Identification of Interleukin1β as an Amplifier of Interferon alpha-induced Antiviral Responses.PLoS Pathog. 2020 Oct 1;16(10):e1008461. doi: 10.1371/journal.ppat.1008461. eCollection 2020 Oct. PLoS Pathog. 2020. PMID: 33002089 Free PMC article.
References
-
- Iacopino F, Ferrandina G, Scambia G, Benedetti-Panici P, Mancuso S, Sica G. Interferons inhibit EGF-stimulated cell growth and reduce EGF binding in human breast cancer cells. Anticancer Res. (1996) 16:1919–24. - PubMed
-
- Hoffmann K, Mehrle S, Schmidt J, Buchler MW, Marten A. Interferon-alpha restitutes the chemosensitivity in pancreatic cancer. Anticancer Res. (2008) 28:1499–507. - PubMed
MeSH terms
Substances
LinkOut - more resources
Full Text Sources
Research Materials
Miscellaneous