Review
. 2018 Jul 19;5(10):1800518.
doi: 10.1002/advs.201800518. eCollection 2018 Oct.

Insights into 2D MXenes for Versatile Biomedical Applications: Current Advances and Challenges Ahead

Affiliations
Review

Insights into 2D MXenes for Versatile Biomedical Applications: Current Advances and Challenges Ahead

Han Lin et al. Adv Sci (Weinh). .

Abstract

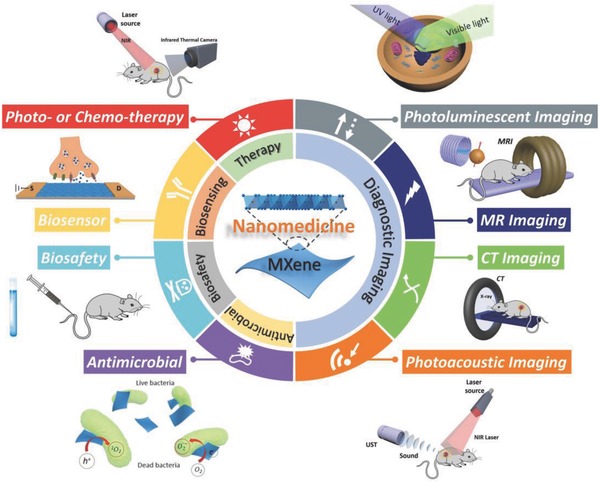
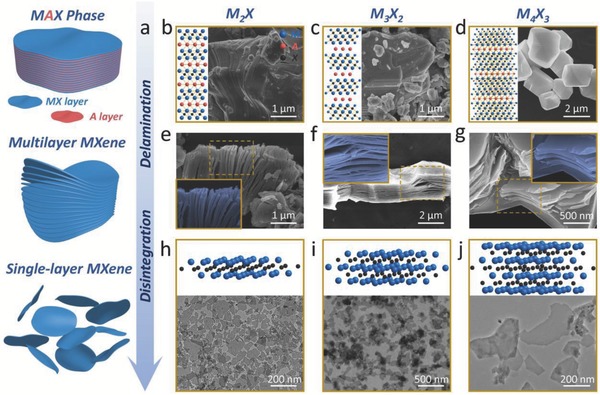
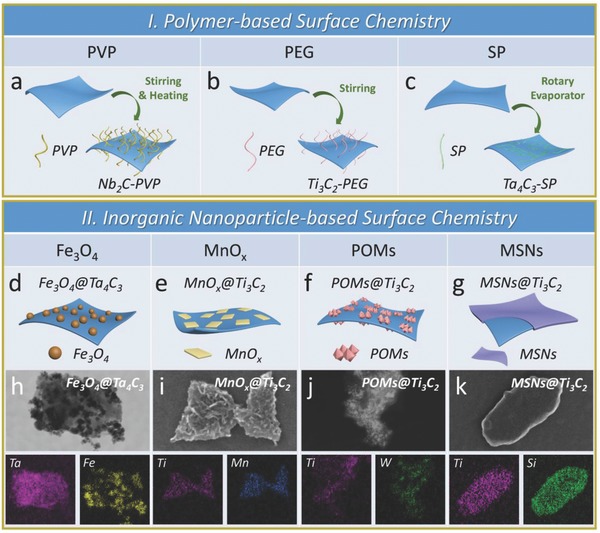
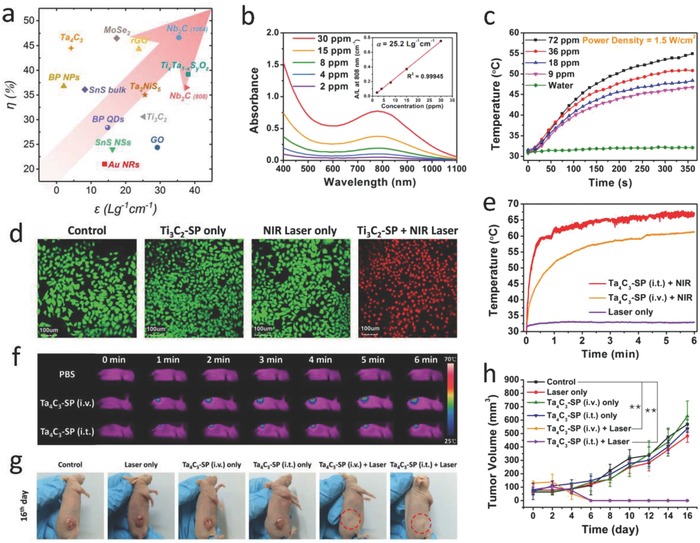
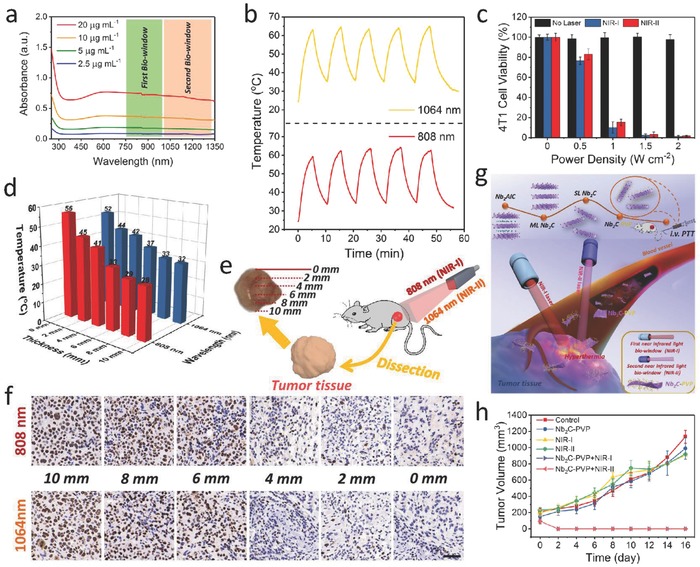
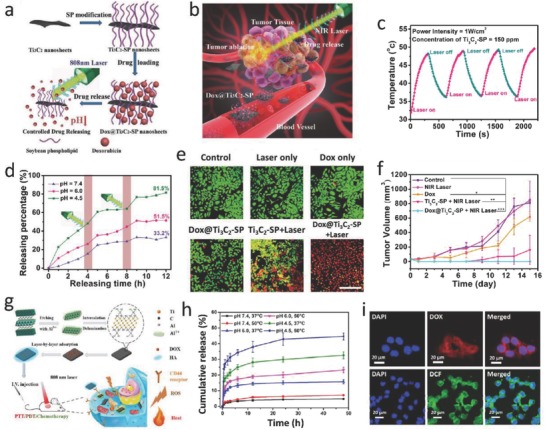
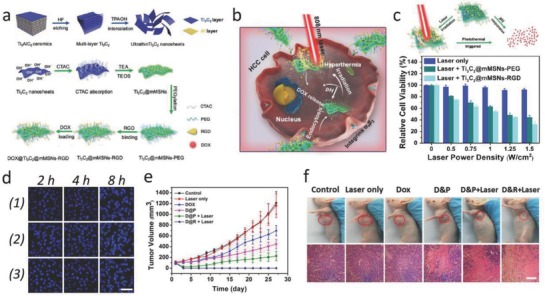
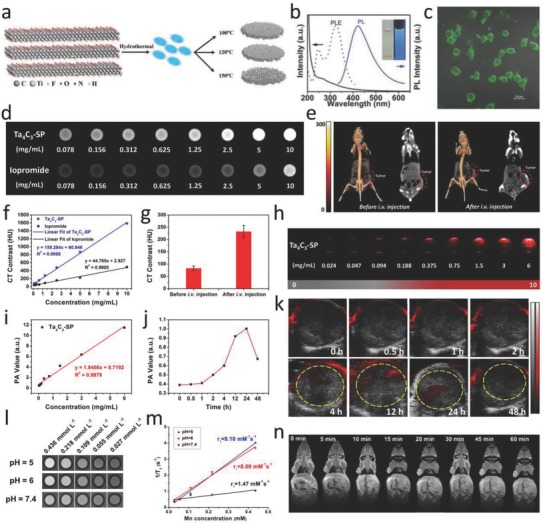
Great and interdisciplinary research efforts have been devoted to the biomedical applications of 2D materials because of their unique planar structure and prominent physiochemical properties. Generally, ceramic-based biomaterials, fabricated by high-temperature solid-phase reactions, are preferred as bone scaffolds in hard tissue engineering because of their controllable biocompatibility and satisfactory mechanical property, but their potential biomedical applications in disease theranostics are paid much less attention, mainly due to their lack of related material functionalities for possibly entering and circulating within the vascular system. The emerging 2D MXenes, a family of ultrathin atomic nanosheet materials derived from MAX phase ceramics, are currently booming as novel inorganic nanosystems for biologic and biomedical applications. The metallic conductivity, hydrophilic nature, and other unique physiochemical performances make it possible for the 2D MXenes to meet the strict requirements of biomedicine. This work introduces the very recent progress and novel paradigms of 2D MXenes for state-of-the-art biomedical applications, focusing on the design/synthesis strategies, therapeutic modalities, diagnostic imaging, biosensing, antimicrobial, and biosafety issues. It is highly expected that the elaborately engineered ultrathin MXenes nanosheets will become one of the most attractive biocompatible inorganic nanoplatforms for multiple and extensive biomedical applications to profit the clinical translation of nanomedicine.

Keywords: MXenes; materials science; nanomedicines; surface chemistry; theranostics.


Figures

Figure 1
Figure 1
Summary of emerging 2D MXenes used in nanomedicine. Summative scheme of emerging 2D MXenes for biomedical applications, and schematic illustration of the 2D MXene‐based nanomedical applications, including therapeutic practice, diagnostic imaging, biosensing, antimicrobial, and biosafety evaluations.
Figure 2
Figure 2
Synthetic methods of MXenes for biomedicine. a) Schematic diagram for the synthesis of biocompatible MXenes, including HF etching (delamination), organic base molecules intercalation (disintegration), and surface functionalization with organic molecules or inorganic nanoparticles (surface modification). b) 2D ball‐and‐stick models and SEM images of precursor MAX phase for M2X, e) SEM image of multilayer M2X, and h) 3D ball‐and‐stick models and TEM image single‐layer M2X‐based MXenes. Reproduced with permission.49 Copyright 2017, American Chemical Society. c) 2D ball‐and‐stick models and SEM images of precursor MAX phase for M3X2, f) SEM image of multilayer M3X2, and i) 3D ball‐and‐stick models and TEM image single‐layer M3X2‐based MXenes. Reproduced with permission.45 Copyright 2017, American Chemical Society. d) 2D ball‐and‐stick models and SEM images of precursor MAX phase for M4X3, g) SEM image of multilayer M4X3, and j) 3D ball‐and‐stick models and TEM image single‐layer M4X3‐based MXenes. Reproduced with permission.47 Copyright 2018, Wiley‐VCH.
Figure 3
Figure 3
Surface chemistry of MXenes for biomedicine. Schematic illustrations of polymer‐based surface chemistry of MXenes. a) PVP modification of M2X (e.g., Nb2C nanosheets). b) PEGylation of M3X2 (e.g., Ti3C2 nanosheets). c) SP modification M4X3‐based MXenes. Schematic representations of inorganic nanoparticle‐based surface chemistry of MXenes. d) Superparamagnetic iron oxide (Fe3O4) nanoparticles grew onto the surface of Ta4C3 MXene by an in situ redox reaction. Reproduced with permission.78 Copyright 2018, Ivyspring International Publisher. e) In situ growth of small MnOx nanosheets on the surface of Ti3C2 according to a facile redox reaction. Reproduced with permission.51 Copyright 2017, American Chemical Society. f) Integration of GdW10‐based polyoxometalates (POMs) onto the surface of Ti3C2 MXene though an amide bond. Reproduced with permission.79 Copyright 2018, Springer. g) Surface nanopore engineering of silica (SiO2) on the 2D Ti3C2 MXene based on a process of sol‐gel chemistry. Reproduced with permission.80 Copyright 2018, Wiley‐VCH. The STEM images and the corresponding element mappings of h) Fe3O4@Ta4C3, i) MnOx@Ti3C2, j) POMs@Ti3C2, and k) SiO2@Ti3C2 composite MXenes.
Figure 4
Figure 4
MXene‐based photothermal therapy. a) The photothermal performance parameters, including mass extinction coefficient (ε) and photothermal conversion efficiency (η), of various 2D inorganic nanomaterials in the literatures. Each symbol indicates a set of material category. b) Absorbance spectra of Ti3C2 nanosheets dispersed in water at varied concentrations (30, 15, 8, 4, and 2 µg mL−1). Inset is the mass extinction coefficient (ε) of Ti3C2 MXene. c) Photothermal‐heating curves of Ti3C2 nanosheet‐dispersed aqueous suspension at varied concentrations (72, 36, 18, and 9 µg mL−1) by using an 808 nm irradiation (1.5 W cm−2). d) Confocal laser scanning microscopy (CLSM) images of Ti3C2‐SP‐induced photothermal ablation after various treatments. Reproduced with permission.45 Copyright 2017, American Chemical Society. e) Temperature elevations and f) the corresponding IR thermal images at the tumor sites of 4T1 tumor‐bearing mice in groups of different treatments. g) Photographs of 4T1 tumor‐bearing mice after different treatments. h) Time‐dependent tumor growth curves after different treatments. Reproduced with permission.47 Copyright 2017, Wiley‐VCH.
Figure 5
Figure 5
MXene‐based photothermal therapy. a) Absorbance spectra of well‐dispersed aqueous Nb2C NSs at varied concentrations. b) Photostability profiles of an aqueous Nb2C NSs solution in NIR‐I and NIR‐II biowindows for five laser on/off cycles. c) Relative viabilities of 4T1 cell line after Nb2C‐PVP‐induced (40 µg mL−1) photothermal eradication at various power densities (0, 0.5, 1.0, 1.5, and 2 W cm−2) of laser (n = 5, mean ± SD). d) Temperature elevations of Nb2C NSs‐dispersed aqueous suspensions upon exposure to tissue‐penetrating NIR‐I and NIR‐II laser via photothermal conversion. e) Schematic diagram of in vivo tumor tissue penetration for photothermal conversion based on NIR‐I and NIR‐II. f) Cancer cellular proliferation at varied depths of tumor tissues by antigen Ki‐67 immunofluorescence staining (scale bar: 50 µm). g) Scheme of synthetic procedure and in vivo photothermal tumor ablation process of 2D biodegradable Nb2C (modified with PVP). h) Time‐dependent tumor growth curves after various treatments. Reproduced with permission.49 Copyright 2017, American Chemical Society.
Figure 6
Figure 6
MXene‐based synergistic multitherapies. a) Schematic illustration of surface modification of Ti3C2 MXene, further surface engineering of drug loading, and stimuli‐triggered drug releasing under inner and external triggers. b) In vivo process of Ti3C2 MXene‐based drug delivery system (DDS) for synergistic photo‐chemotherapy of tumor. c) The DOX‐releasing curves from DOX@Ti3C2 composite nanosheets in buffer with varied pHs of 4.5, 6.0, and 7.4. d) The DOX‐releasing curves with 808 nm laser irradiation on or off at varied pH values (4.5, 6.0, and 7.4). e) CLSM images of cancer cells after various treatments, including control, laser, DOX, DOX@Ti3C2‐SP, Ti3C2‐SP + laser, and DOX@ Ti3C2‐SP + laser groups. Scale bar: 50 µm. f) Time‐dependent tumor growth profiles after different treatments. Reproduced with permission.104 Copyright 2018, Wiley‐VCH. g) Schematic diagram of the construction of Ti3C2‐based nanosystem and photothermal/photodynamic/chemo synergistic therapy of tumor. h) Accumulative drug release curves with or without NIR laser irradiation at pH 4.5, 6.0, and 7.4. i) CLSM images of HCT‐116 cells treated with Ti3C2‐DOX (top), and DCFH‐DA‐stained HCT‐116 cells treated with Ti3C2‐DOX under NIR laser irradiation for the intracellular ROS detection (bottom). Reproduced with permission.52 Copyright 2017, American Chemical Society.
Figure 7
Figure 7
MXene‐based synergistic multitherapies. a) Schematic diagram for the fabrication of ultrathin Ti3C2 nanosheets and the synthetic procedure for Ti3C2@mMSNs‐RGD. b) Scheme for synergistic multitherapies on HCC cell line as assisted by DOX‐loaded mMSNs@Ti3C2‐RGD. c) Schematic representation of pH/photothermal‐responsive drug release from DOX‐loaded Ti3C2@mMSNs‐RGD (top), and relative viabilities of SMMC‐7721 cells under NIR irradiation of different power densities (0, 0.5, 0.75, 1, 1.25, and 1.5 W cm−2) (bottom). d) CLSM images of SMMC‐7721 cell line coincubated with FITC‐labeled mMSNs@Ti3C2 for a varied incubation times (2, 4, and 8 h). Scale bar: 50 µm. e) Time‐dependent tumor growth curves after various treatments. f) Photographs of SMMC‐7721 tumor‐bearing mice and its tumor regions in 28 d after various treatments. H&E staining for pathological changes in tumor tissues from each group. Scale bar: 100 µm. Reproduced with permission.80 Copyright 2018, Wiley‐VCH.
Figure 8
Figure 8
MXene‐based diagnostic imaging modalities. a) Schematic diagram of synthesizing Ti3C2 MXene QDs (MQDs). b) UV–vis absorbance spectra (solid line), PLE (dashed line), and PL spectra (solid blue line, excitation wavelength of 320 nm) of MQD‐100 in aqueous solutions. c) Merged images of the bright‐field and the confocal images (488 nm) for MQD‐100 incubated with cells. Reproduced with permission.53 Copyright 2017, Wiley‐VCH. d) In vitro CT images and f) CT contrasts of Ta4C3‐SP nanosheet solutions and iopromide solutions at varied concentrations. e) In vivo 3D reconstruction CT images (left) and CT contrast images (right) of mice before and after intravenous administration (10 mg mL−1, 200 µL) for 24 h. g) In vivo CT contrasts before and after intravenous administration. h) PA images of Ta4C3‐SP solutions with varied concentrations. i) In vitro PA values as a function of a series of concentrations. j) In vivo PA value temporal evolution and k) PA images of the tumor locations at varied time intervals postinjection. Reproduced with permission.47 Copyright 2017, Wiley‐VCH. l) In vitro T1‐weighted MR imaging, and m) the corresponding 1/T 1 versus Mn concentration of MnOx/Ti3C2‐SP nanosheets in buffer solution at different pH values after soaking for 3 h. n) T 1‐weighted imaging of tumor‐bearing mice after postinjection of MnOx/Ti3C2‐SP at varied time intervals. Reproduced with permission.51 Copyright 2017, American Chemical Society.
Figure 9
Figure 9
MXene‐based applications in biosensing. a) SEM image of multilayered Ti3C2 MXene. b) Device schematics for biosensing based on Ti3C2 MXene field‐effect transistor (FET). c) Schematics of real‐time recording for neuronal‐spiking activities by employing MXene‐FET device. d) Confocal image of neurons immunofluorescence staining for βIII‐tubulin (left). Merged image of the bright‐field and fluorescence channels (scale bar: 100 µm). e) The derivation of spiking activities from primary neurons by utilizing MXene‐FET device via recording the current and fluorescence changes. Reproduced with permission.57 Copyright 2017, Wiley‐VCH. f) Amperometric current–time (it) curves for GOx/Au/MXene/Nafion/GCE biosensor under a constant voltage of −0.402 V. g) Steady‐state calibration curves for contrast recordings between GOx/MXene/Nafion/GCE and GOx/Au/MXene/Nafion/GCE biosensors. Reproduced with permission.55 Copyright 2016, Nature Publishing Group.
Figure 10
Figure 10
MXene‐based applications in antimicrobials. a) Schematic illustration of antibacterial activity of Ti3C2Tx MXene. b) Concentration‐dependent antibacterial activities of the Ti3C2Tx in aqueous suspensions: Images of agar plates onto which E. coli (top) and B. subtilis (bottom) bacterial cells were recultivated after treatment for 4 h with varied concentrations. c) Cell viability analysis of E. coli treated with Ti3C2Tx and graphene oxide (GO) in aqueous suspension. d) Ti3C2Tx cytotoxicity investigated by LDH‐releasing from the bacterial cells exposure to varied concentrations of Ti3C2Tx. SEM images of the e) E. coli and f) B. subtilis treated with 0, 50, and 100 µg mL−1 of Ti3C2Tx, at low and high magnification, respectively. Reproduced with permission.58 Copyright 2016, American Chemical Society. g) The scheme of antimicrobial mechanism for Ti3C2 MXenes. h) Cell viability studies of E. coli and B. subtilis cultivated on fresh and aged PVDF‐supported Ti3C2 membranes. i) Flow cytometry analyses of E. coli and B. subtilis bacterial cells exposed to PVDF and Ti3C2 MXene membranes. Reproduced with permission.59 Copyright 2017, Nature Publishing Group.
Figure 11
Figure 11
Ecotoxicological assessments, biocompatibility, and biosafety evaluations of MXenes. a) CLSM imaging of an entire embryo. b) Spinal cord adjacent to the somite 14–17 territory of the various treatments toward representative embryos. c) Average of the relative neuronal number of as‐treated embryos (n = 14, *P < 0.05). Reproduced with permission.129 Copyright 2018, Royal Society of Chemistry. d) Relative viabilities of 4T1 cell line after being incubated with varied concentrations of Ta4C3‐SP nanosheets. Reproduced with permission.47 Copyright 2018, Wiley‐VCH. e) Relative viabilities of 4T1 and U87 cells after being incubated with Nb2C‐PVP nanosheets of varied concentrations. f) Histological data (H&E stained) collected from the major organs (heart, liver, spleen, lung, and kidney) of the Nb2C‐PVP‐treated mice in 28 d postinjection under different conditions (control, exposure to NIR‐I, NIR‐II, and daylight). Scale bars: 100 µm. g) Hematological parameters and h) biochemical blood indexes of the Nb2C‐PVP‐treated mice in 1, 7, and 28 d postinjection under different treatments (control, exposure to daylight, NIR‐I, and NIR‐II). Reproduced with permission.49 Copyright 2017, American Chemical Society.
Figure 12
Figure 12
Conclusions and perspectives for 2D MXenes used in nanomedicine. Summary of current research developments and future perspectives of ultrathin 2D MXenes for versatile biomedical applications.

Similar articles

Cited by

References

    1. Ashley C. E., Carnes E. C., Phillips G. K., Padilla D., Durfee P. N., Brown P. A., Hanna T. N., Liu J., Phillips B., Carter M. B., Carroll N. J., Jiang X., Dunphy D. R., Willman C. L., Petsev D. N., Evans D. G., Parikh A. N., Chackerian B., Wharton W., Peabody D. S., Brinker C. J., Nat. Mater. 2011, 10, 389. - PMC - PubMed
    1. Hong G., Lee J. C., Robinson J. T., Raaz U., Xie L., Huang N. F., Cooke J. P., Dai H., Nat. Med. 2012, 18, 1841. - PMC - PubMed
    1. Kotagiri N., Sudlow G. P., Akers W. J., Achilefu S., Nat. Nanotechnol. 2015, 10, 370. - PMC - PubMed
    1. Mura S., Nicolas J., Couvreur P., Nat. Mater. 2013, 12, 991. - PubMed
    1. Chen H., Zhang W., Zhu G., Xie J., Chen X., Nat. Rev. Mater. 2017, 10.1038/natrevmats.2017.24. - DOI - PMC - PubMed

LinkOut - more resources