. 2018 Oct 16;7(5):28.
doi: 10.1167/tvst.7.5.28. eCollection 2018 Sep.

Multi-line Adaptive Perimetry (MAP): A New Procedure for Quantifying Visual Field Integrity for Rapid Assessment of Macular Diseases

Affiliations

Multi-line Adaptive Perimetry (MAP): A New Procedure for Quantifying Visual Field Integrity for Rapid Assessment of Macular Diseases

Steven M Thurman et al. Transl Vis Sci Technol. .

Erratum in

  • Erratum.
    [No authors listed] [No authors listed] Transl Vis Sci Technol. 2018 Nov 14;7(6):4. doi: 10.1167/tvst.7.6.4. eCollection 2018 Nov. Transl Vis Sci Technol. 2018. PMID: 30479875 Free PMC article.

Abstract

Purpose: In order to monitor visual defects associated with macular degeneration (MD), we present a new psychophysical assessment called multiline adaptive perimetry (MAP) that measures visual field integrity by simultaneously estimating regions associated with perceptual distortions (metamorphopsia) and visual sensitivity loss (scotoma).

Methods: We first ran simulations of MAP with a computerized model of a human observer to determine optimal test design characteristics. In experiment 1, predictions of the model were assessed by simulating metamorphopsia with an eye-tracking device with 20 healthy vision participants. In experiment 2, eight patients (16 eyes) with macular disease completed two MAP assessments separated by about 12 weeks, while a subset (10 eyes) also completed repeated Macular Integrity Assessment (MAIA) microperimetry and Amsler grid exams.

Results: Results revealed strong repeatability of MAP and high accuracy, sensitivity, and specificity (0.89, 0.81, and 0.90, respectively) in classifying patient eyes with severe visual impairment. We also found a significant relationship in terms of the spatial patterns of performance across visual field loci derived from MAP and MAIA microperimetry. However, there was a lack of correspondence between MAP and subjective Amsler grid reports in isolating perceptually distorted regions.

Conclusions: These results highlight the validity and efficacy of MAP in producing quantitative maps of visual field disturbances, including simultaneous mapping of metamorphopsia and sensitivity impairment.

Translational relevance: Future work will be needed to assess applicability of this examination for potential early detection of MD symptoms and/or portable assessment on a home device or computer.

Keywords: macular disease; metamorphopsia; microperimetry; psychophysics; retina.


Figures

Figure 1
Figure 1
Schematic of the MAP to assess visual field integrity. (a) Upon fixation, horizontal or vertical dotted lines are flashed on the screen for 160 ms (200 ms for MD participants). A variable number of target bumps are introduced in the lines, displacing a subset of elements. Participants indicate where line distortions are perceived, and responses are classified as hits, misses, or FAs. For healthy participants, we used a screen with white background and dark dotted lines, while for MD participants, the background was dark and the dotted lines white. (b) Across many trials, FA responses are statistically evaluated for the degree of spatial clustering. Thresholded statistical maps show regions of visual field with a degree of clustering significantly greater than chance. Patterns of accuracy across the visual field are assessed by computing mean accuracy (hits/hits + misses) of behavioral responses within 2.5° radius of reference points, for example, in a 7 by 7 grid.
Figure 2
Figure 2
Results for simulated metamorphopsia with healthy participants in experiment 1, with thresholded statistical maps of FA clustering overlaid from each participant, and with ground truth shown for reference (blue circle markers), which represents the assigned ground truth location for four different subject cohorts (a through d). The left panel in a to d represents maps from the one-line per trial condition, and the right panel represents three-lines per trial condition. The reddish pink regions are statistically significant (P < 0.05) as assessed with permutation testing, and have transparency so that darker red regions indicate more overlap across participants.
Figure 3
Figure 3
(a) ROC curve for classifying eyes labeled as pathological versus severely pathological (defined from MAIA microperimetry thresholds) using mean MAP accuracy measurements. (b) Distribution of MAIA sensitivity values across all retinal loci from all eyes in the study, where three discrete bins are defined to represent low, mid, and high level sensitivity. (c) Mean MAP accuracy and standard error across loci categorized as low, mid, and high based on MAIA sensitivity level. *P < 0.0001.
Figure 4
Figure 4
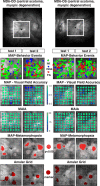
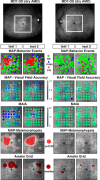
(Upper panel) Fundus image of OD and OS for patient MD5 diagnosed with Stargardt's disease with box identifying the central 14° of the visual field centered on the fovea. (Lower panels) Test measurements from test 1 and test 2 associated with MAP and MAIA, overlaid on the corresponding location of the retina centered on the fovea. MAP data were scaled, inverted, and then mirror reversed to transform from Cartesian coordinates to approximate retinal fundus image coordinates. The first lower panel shows MAP behavioral responses including FAs (red dots), hits (green dots), and misses (blue dots); the second lower panel shows MAP accuracy values resampled to the same resolution as the reference MAIA grid for direct comparison of measurements across retinal loci between the two tests. The third lower panel shows MAIA threshold sensitivity values. The fourth lower panel shows thresholded FA distortion maps, where regions marked red indicate a statistically significant degree of clustering for FA responses. The fifth lower panel shows a mirror-reversed projection of subjective Amsler grid demarcations onto the fundus image for easier visual comparison the FA distortion maps.
Figure 5
Figure 5
(Upper panel) Fundus image of OD and OS for patient MD6 diagnosed with myopic degeneration and central scotoma. The lower panels are the same as described in Figure 4.
Figure 6
Figure 6
(Upper panel) Fundus image of OD and OS for patient MD7 diagnosed with dry AMD. The lower panels are the same as described in Figure 4.

Similar articles

References

    1. Schiller JS, Lucas JW, Ward BW, Peregoy JA. Summary health statistics for U.S. adults: National Health Interview Survey, 2011. Vital Heal Stat. 2012;(256):1–218. - PubMed
    1. Liu MM, Chan C-C, Tuo J. Genetic mechanisms and age-related macular degeneration: common variants, rare variants, copy number variations, epigenetics, and mitochondrial genetics. Hum Genomics. 2012;6:13. - PMC - PubMed
    1. Friedman DS, O'Colmain BJ, Muñoz B, et al. Prevalence of age-related macular degeneration in the United States. Arch Ophthalmol. 2004;122:564–572. - PubMed
    1. Cruess AF, Zlateva G, Xu X, et al. Economic burden of bilateral neovascular age-related macular degeneration: multi-country observational study. Pharmacoeconomics. 2008;26:57–73. - PubMed
    1. Simunovic MP. Metamorphopsia and its quantification. Retina. 2015;35:1285–1291. - PubMed