. 2018 Oct 17:6:e5815.
doi: 10.7717/peerj.5815. eCollection 2018.

C9orf72, a protein associated with amyotrophic lateral sclerosis (ALS) is a guanine nucleotide exchange factor

Affiliations

C9orf72, a protein associated with amyotrophic lateral sclerosis (ALS) is a guanine nucleotide exchange factor

Shalini Iyer et al. PeerJ. .

Abstract

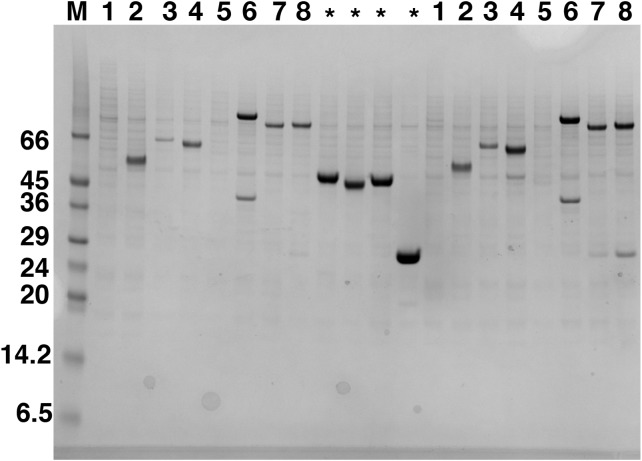
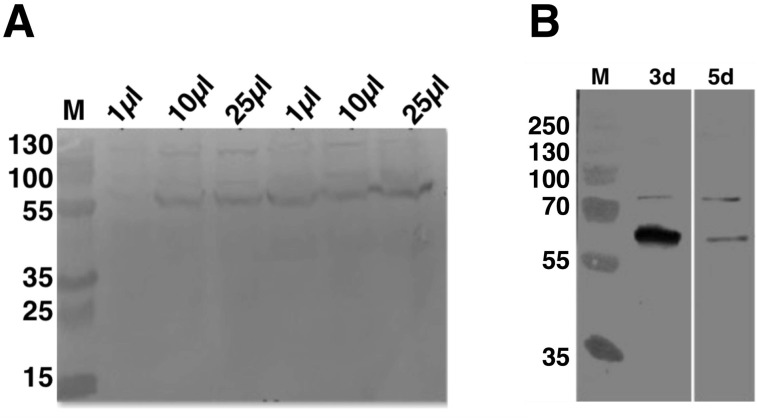
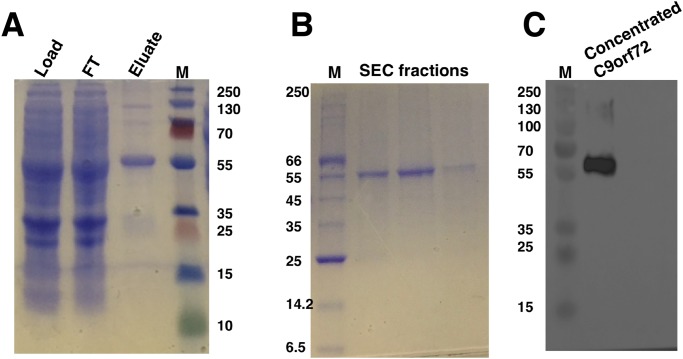
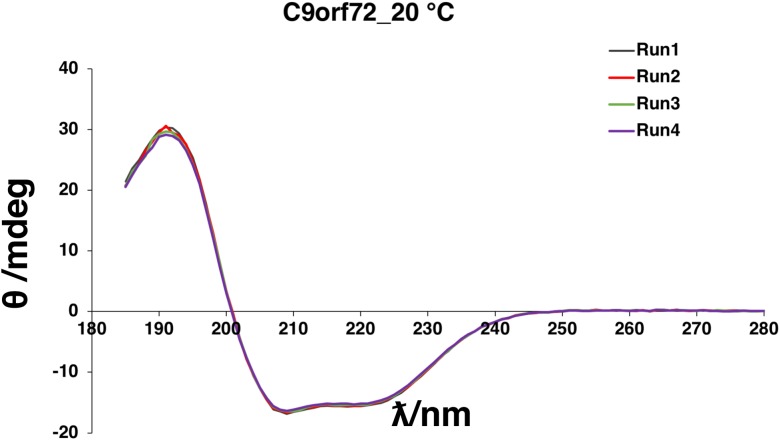
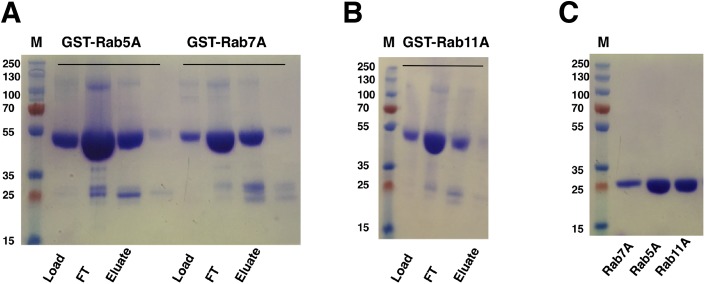
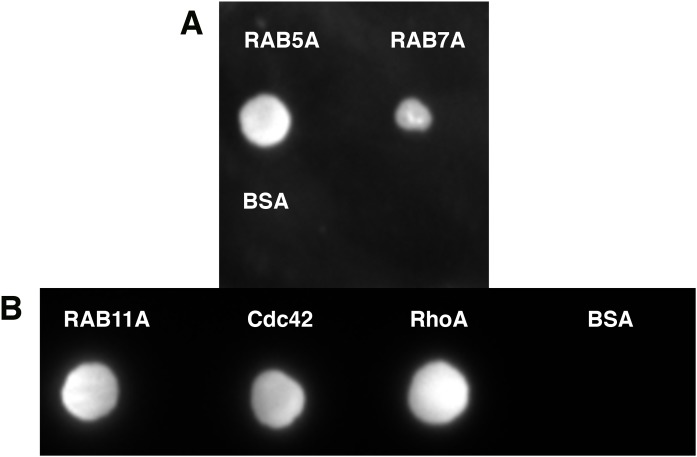
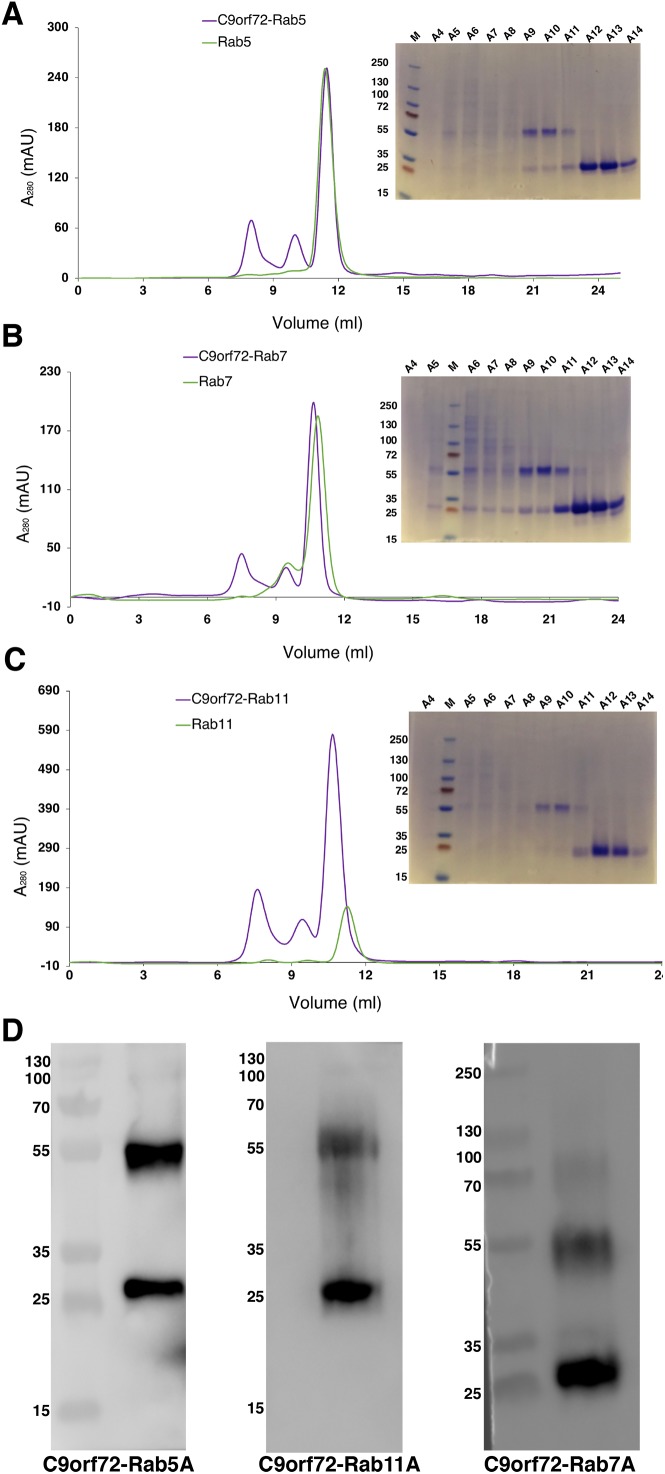
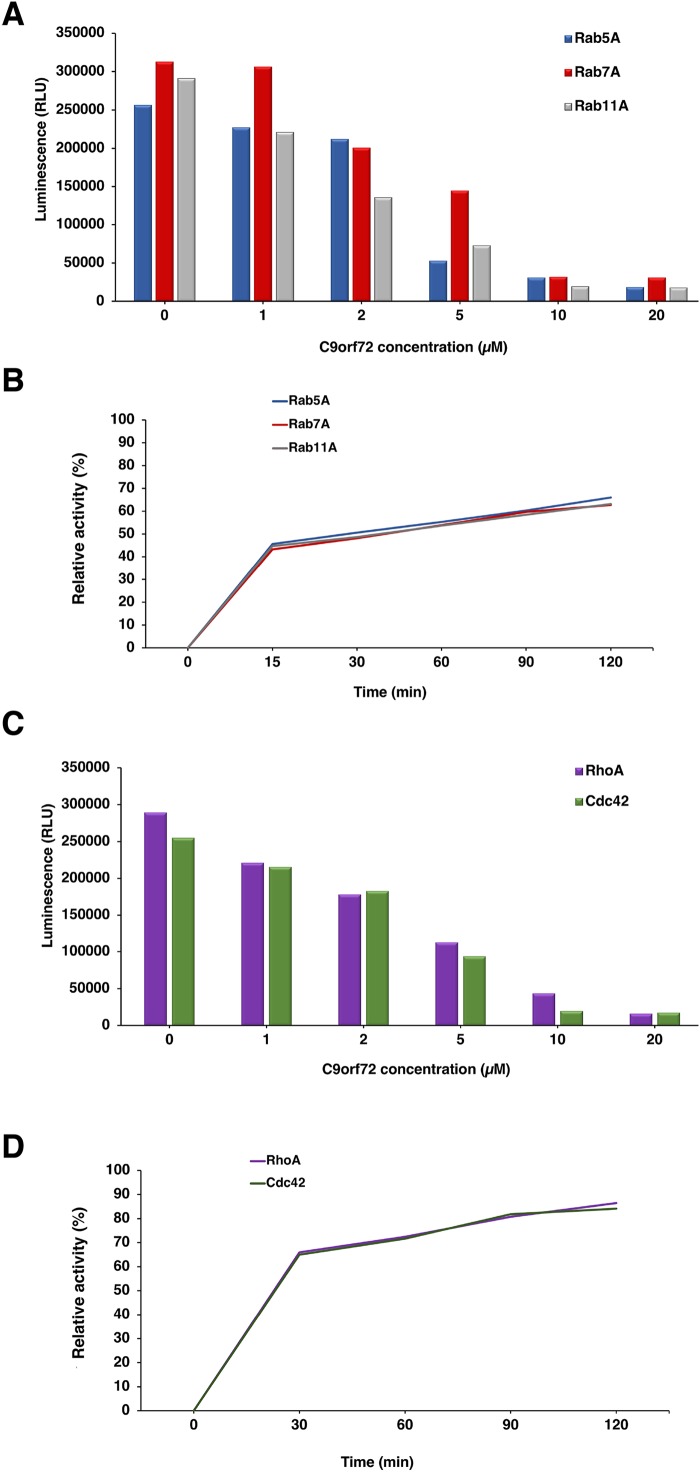
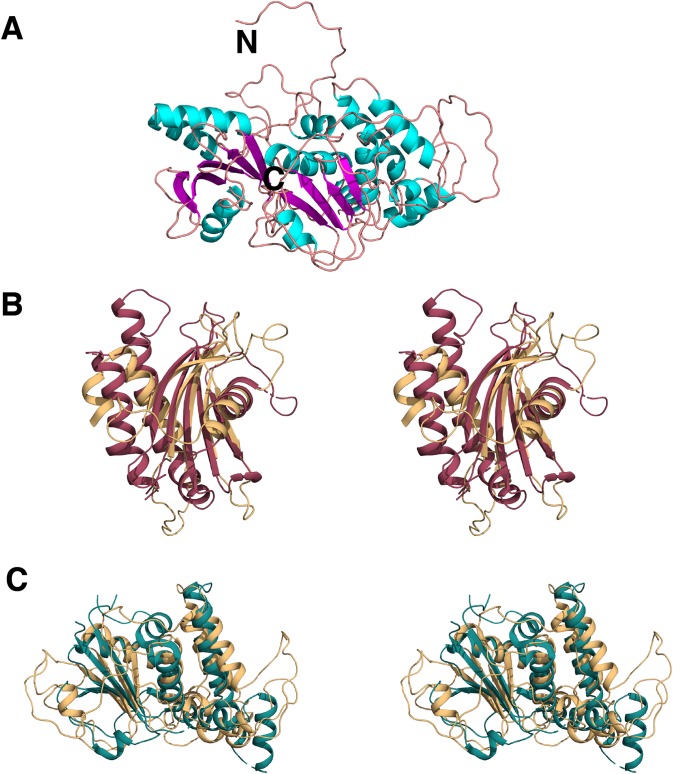
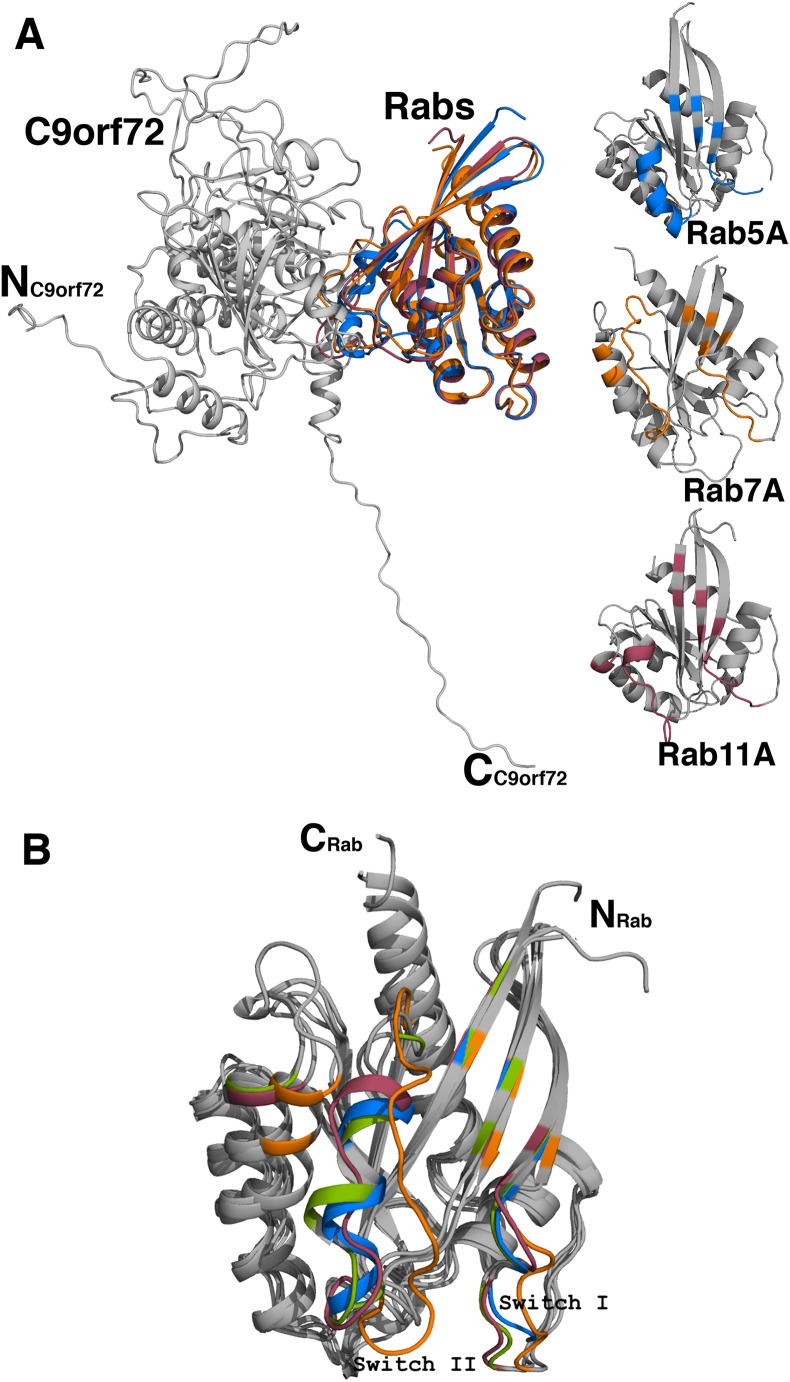
Amyotrophic lateral sclerosis (ALS) and frontotemporal dementia (FTD), two late onset neurodegenerative diseases, have been shown to share overlapping cellular pathologies and genetic origins. Studies suggest that a hexanucleotide repeat expansion in the first intron of the C9orf72 gene is the most common cause of familial FTD and ALS pathology. The C9orf72 protein is predicted to be a differentially expressed in normal and neoplastic cells domain protein implying that C9orf72 functions as a guanine nucleotide exchange factor (GEF) to regulate specific Rab GTPases. Reported studies thus far point to a putative role for C9orf72 in lysosome biogenesis, vesicular trafficking, autophagy and mechanistic target of rapamycin complex1 (mTORC1) signaling. Here we report the expression, purification and biochemical characterization of C9orf72 protein. We conclusively show that C9orf72 is a GEF. The distinctive presence of both Rab- and Rho-GTPase GEF activities suggests that C9orf72 may function as a dual exchange factor coupling physiological functions such as cytoskeleton modulation and autophagy with endocytosis.

Keywords: ALS; C9orf72; Guanine nucleotide exchange factor; Neurodegeneration; Protein expression; Protein purification; Rab GTPases; Size-exclusion chromatography.


Conflict of interest statement

Vasanta Subramanian is an Academic Editor for PeerJ.

Figures

Figure 1
Figure 1. Western blot analysis of expression screening of C9orf72 in Sf9 cells.
Different constructs of C9orf72 (Table 1) were screened for expression in Sf9 cells. Expression was analyzed by western blotting as described in the materials and methods section. The lane labeled M represents the Low Range Sigma Markers (M3913). Molecular marker masses are indicated in kilodalton. Lanes are numbered 1–8, according to the construct numbers detailed in Table 1. Lane 2 showing expression for pOPINF-C9orf72 was selected for scale-up expression and purification. The lanes marked with asterisks are control proteins for which transfections were carried out alongside the eight C9orf72 constructs.
Figure 2
Figure 2. Analysis of expression optimization of C9orf72 in Sf9 cells.
pOPINF-C9orf72 construct selected for expression in Sf9 cells was tested for (A) total volume of virus used by SDS–PAGE analysis. The two series of volumes (1, 10 and 25 μl) shown represent volumes of viruses generated from using two different concentrations of DNA during transfection. (B) Total time of infection (3d, 3 days and 5d, 5 days). Expression was analyzed by western blotting as described in the materials and methods section. Detection was carried out using a monoclonal mouse anti-His (primary) antibody (1:5,000) from R&D Systems (MAB050) in combination with an HRP-conjugated polyclonal mouse (secondary) antibody (1:10,000), raised in goat and Luminata™ Forte western HRP substrate. The lanes labeled M in both panels contain the PageRuler™ Plus Prestained Protein ladder (Fermentas). Molecular marker masses are indicated in kilodalton.
Figure 3
Figure 3. SDS–PAGE and western blot analysis of C9orf72 purification.
(A) SDS–PAGE analysis of samples from Ni2+-affinity purification of C9orf72 (B) SDS–PAGE analysis of fractions from size-exclusion chromatography purification of C9orf72 and (C) western blot analysis of concentrated C9orf72. Detection was carried out using an affinity purified rabbit polyclonal anti-C9orf72 (primary) antibody (1:1,000) from Santa Cruz Biotechnology (sc-138763) in combination with an HRP-conjugated polyclonal rabbit (secondary) antibody (1:10,000), raised in goat and Luminata™ Forte western HRP substrate. The lanes labeled M in all three panels contain the PageRuler™ Plus Prestained Protein ladder (Fermentas). Molecular marker masses are indicated in kilodalton.
Figure 4
Figure 4. Far-UV CD spectrum showing native state of C9orf72.
CD spectra were collected for purified C9orf72 (five μM) using the Chirascan CD spectrometer in a one mm path length cell at 20 °C between 185 and 280 nm. The response time was 1 s with spectral bandwidth of 2.5 nm. Secondary structural elements were estimated using the K2D algorithm (Andrade et al., 1993) included with DichroWeb (Whitmore & Wallace, 2007).
Figure 5
Figure 5. SDS–PAGE analysis of Rab GTPase purifications.
(A and B) SDS–PAGE analysis of eluted samples from GST-affinity purification of Rab GTPases, GST-Rab5A, GST-Rab11A and GST-Rab7A. (C) SDS–PAGE analysis of Rab GTPases after tag cleavage. Molecular marker masses, indicated in kilodalton, were determined by the PageRuler™ Plus Prestained Protein ladder (Fermentas). Molecular mass of GST-tagged Rab GTPases is around 50 kDa. After tag cleavage the Rab GTPases have a molecular mass of around 25 kDa.
Figure 6
Figure 6. Far-western analysis to assess protein–protein interactions.
(A) Rab5A, Rab7A and BSA were spotted at 50 pmoles on a nitrocellulose membrane. BSA was included as a negative control. (B) Rab11A, Cdc42 and RhoA were spotted at 50 pmoles on a nitrocellulose membrane. BSA was included as a negative control. The membrane was incubated with 100 nM purified C9orf72 (prey protein) for at least 6–8 h at 4 °C with gentle agitation. This was followed by incubation with the primary antibody, polyclonal rabbit anti-C9orf72 antibody (1:1,000 in blocking buffer). The membrane was subsequently incubated with the HRP-conjugated secondary goat anti-rabbit antibody at a 1:2,000 dilution.
Figure 7
Figure 7. Complex formation of the Rab proteins with C9orf72, analyzed by size-exclusion chromatography.
Complex formation of Rab5A (A), Rab7A (B) and Rab11A (C) with full-length C9orf72 was analyzed on a Superdex 200 10/30 column (GE Healthcare, Buckinghamshire, UK) by monitoring the UV absorption at 280 nm (left). Eluted fractions were subjected to denaturing polyacrylamide gel electrophoresis (SDS–PAGE) to verify Rab and C9orf72 co-elution (right). An amount of 21 μM C9orf72 and 48 μM Rab were applied per gel filtration run. (D) Western blot analysis of the eluted complexes: C9orf72-Rab5A (left panel), C9orf72-Rab11A (middle panel) and C9orf72-Rab7A (right panel). The band around the 55 kDa mark is C9orf72 and the band at around 25 kDa mark all the three panels is the Rab protein from the respective complex. Detection was carried out using an affinity purified rabbit polyclonal anti-C9orf72 (primary) antibody (1:1,000) from Santa Cruz Biotechnology (sc-138763) in combination with: anti-Rab5A (primary) antibody (1:400) for C9orf72-Rab5A complex, anti-Rab7A (primary) antibody (1:200) for C9orf72-Rab7A complex and anti-Rab11A (primary) antibody (1:200) for C9orf72-Rab11A complex. The Rab antibodies were from a sampler kit bought from Cell Signaling Technology (9385).
Figure 8
Figure 8. Guanine nucleotide exchange activity of C9orf72.
(A) Titration of C9orf72 in the presence of fixed concentrations of Rab-GTPases. The reactions contained two μM of Rab-GTPase (Rab5A, Rab7A or Rab11A), one mM DTT, five μM GTP in GEF buffer along with different concentrations of C9orf72 (0–20 μM). The reactions (in triplicate) were incubated at 22 °C for 120 min. (B) Time course assay to determine optimal Rab-GTPase reaction time for C9orf72 at fixed concentration (determined above). The reactions contained two μM of Rab-GTPase (Rab5A, Rab7A or Rab11A), one mM DTT, five μM GTP in GEF buffer along five μM C9orf72. The reactions (in triplicate) were incubated at 22 °C for different time periods. (C) Titration of C9orf72 in the presence of fixed concentrations of Rho-GTPases. The reactions contained two μM of Rho-GTPase (Cdc42 or RhoA), one mM DTT, five μM GTP in GEF buffer along with different concentrations of C9orf72 (0–20 μM). The reactions (in triplicate) were incubated at 22 °C for 120 min. (D) Time course assay to determine optimal Rho-GTPase reaction time for C9orf72 at fixed concentration (determined above). The reactions contained two μM of Rho-GTPase (Cdc42 or RhoA), one mM DTT, five μM GTP in GEF buffer along five μM C9orf72. The reactions (in triplicate) were incubated at 22 °C for different time periods.
Figure 9
Figure 9. Homology model of C9orf72.
(A) Template-based model of C9orf72, generated by RaptorX (Källberg et al., 2012), with α-helices shown in cyan, β-strands in magenta and coil/loop regions in pink. N- and C-termini are labeled. (B) Stereo representation of the superposition of C9orf72 (shown in beige, residues 1–144) with the longin domain of Lst4 (PDB code: 4ZY8; (Pacitto et al., 2015)) shown in raspberry red. (C) Stereo representation of the superposition C9orf72 (shown in beige, residues 195–481) with folliculin (PDB code: 3V42; (Nookala et al., 2012)) shown in deep teal. All figures were rendered using PyMol (www.pymol.org).
Figure 10
Figure 10. Homology model of C9orf72 and Rab GTPase complexes.
(A) Cartoon representation of the superposed complexes of C9orf72 (shown in gray) with the three Rab proteins: Rab5A (marine blue), Rab7A (orange) and Rab11A (raspberry red). The figure also shows the individual Rabs. The main frame of the Rab proteins is colored gray. Residues that interact with C9orf72 at the binding interface are colored accordingly to the convention stated above. (B) Superposition of the Rab proteins from their modeled complexes with C9orf72. The N- and C-termini of the proteins are shown. Also, highlighted are the two canonical loop regions, Switch I and Switch II. All figures were rendered using PyMol (www.pymol.org).

Similar articles

Cited by

References

    1. Adams PD, Afonine PV, Bunkóczi G, Chen VB, Davis IW, Echols N, Headd JJ, Hung LW, Kapral GJ, Grosse-Kunstleve RW, McCoy AJ, Moriarty NW, Oeffner R, Read RJ, Richardson DC, Richardson JS, Terwilliger TC, Zwart PH. PHENIX: a comprehensive python-based system for macromolecular structure solution. Acta Crystallographica Section D Biological Crystallography. 2010;66(2):213–221. doi: 10.1107/s0907444909052925. - DOI - PMC - PubMed
    1. Amick J, Roczniak-Ferguson A, Ferguson SM. C9orf72 binds SMCR8, localizes to lysosomes, and regulates mTORC1 signaling. Molecular Biology of the Cell. 2016;27(20):3040–3051. doi: 10.1091/mbc.e16-01-0003. - DOI - PMC - PubMed
    1. Andersen PM, Al-Chalabi A. Clinical genetics of amyotrophic lateral sclerosis: what do we really know? Nature Reviews Neurology. 2011;7(11):603–615. doi: 10.1038/nrneurol.2011.150. - DOI - PubMed
    1. Andrade MA, Chacón P, Merelo JJ, Morán F. Evaluation of secondary structure of proteins from UV circular dichroism spectra using an unsupervised learning neural network. Protein Engineering, Design and Selection. 1993;6(4):383–390. doi: 10.1093/protein/6.4.383. - DOI - PubMed
    1. Ash PE, Bieniek KF, Gendron TF, Caulfield T, Lin WL, Dejesus-Hernandez M, Van Blitterswijk MM, Jansen-West K, Paul JW, 3rd, Rademakers R, Boylan KB, Dickson DW, Petrucelli L. Unconventional translation of C9ORF72 GGGGCC expansion generates insoluble polypeptides specific to c9FTD/ALS. Neuron. 2013;77(4):639–646. doi: 10.1016/j.neuron.2013.02.004. - DOI - PMC - PubMed

LinkOut - more resources