. 2018 Oct 18:6:e5770.
doi: 10.7717/peerj.5770. eCollection 2018.

What is an archaeon and are the Archaea really unique?

Affiliations

What is an archaeon and are the Archaea really unique?

Ajith Harish. PeerJ. .

Abstract

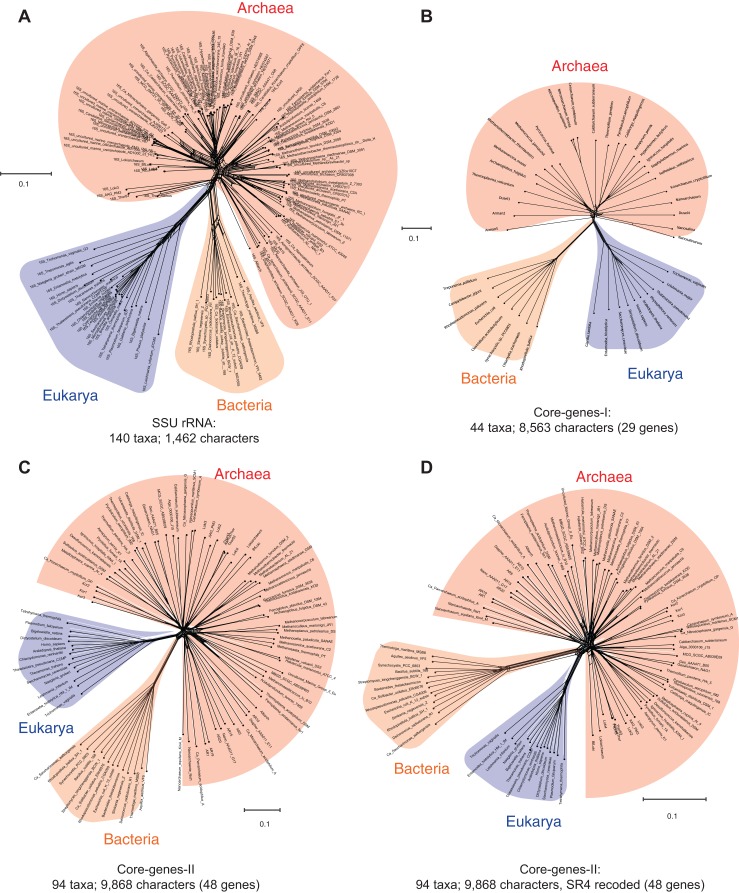
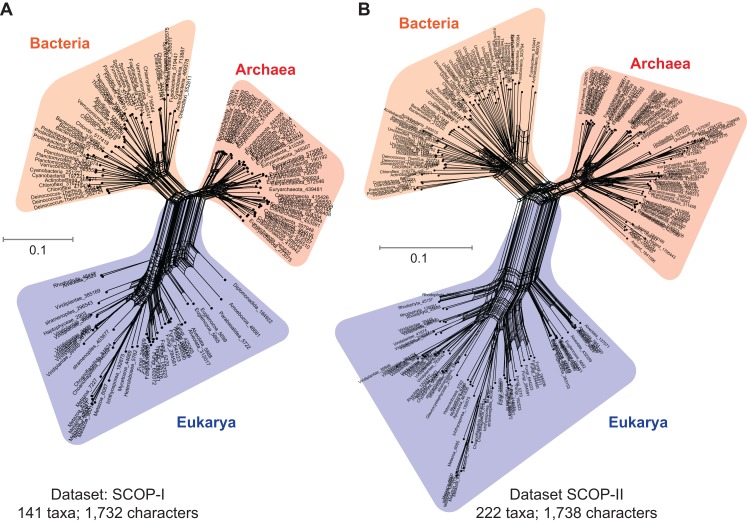
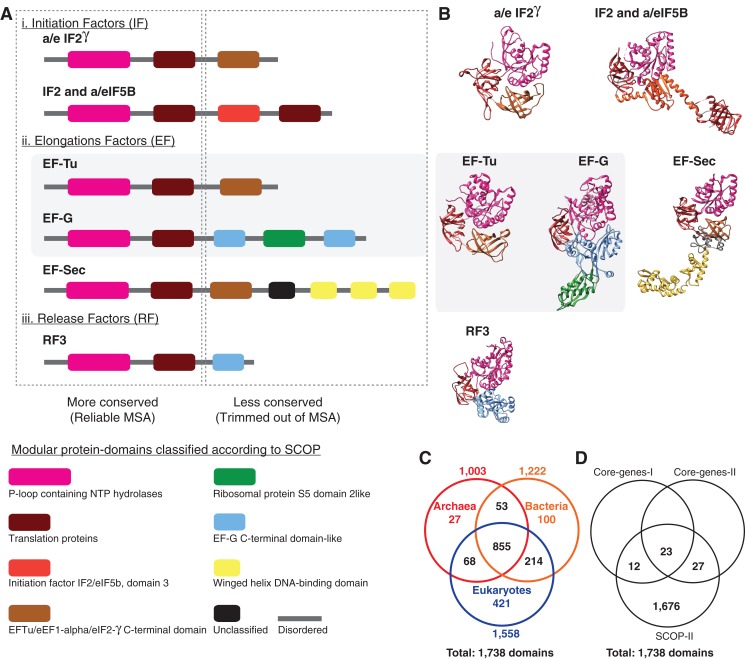
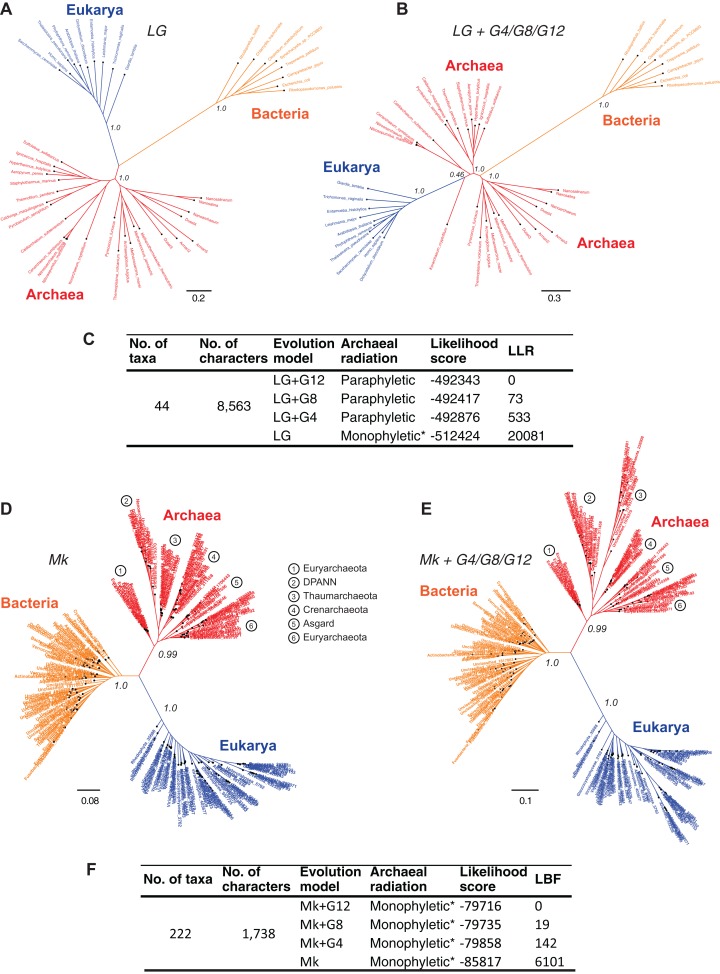
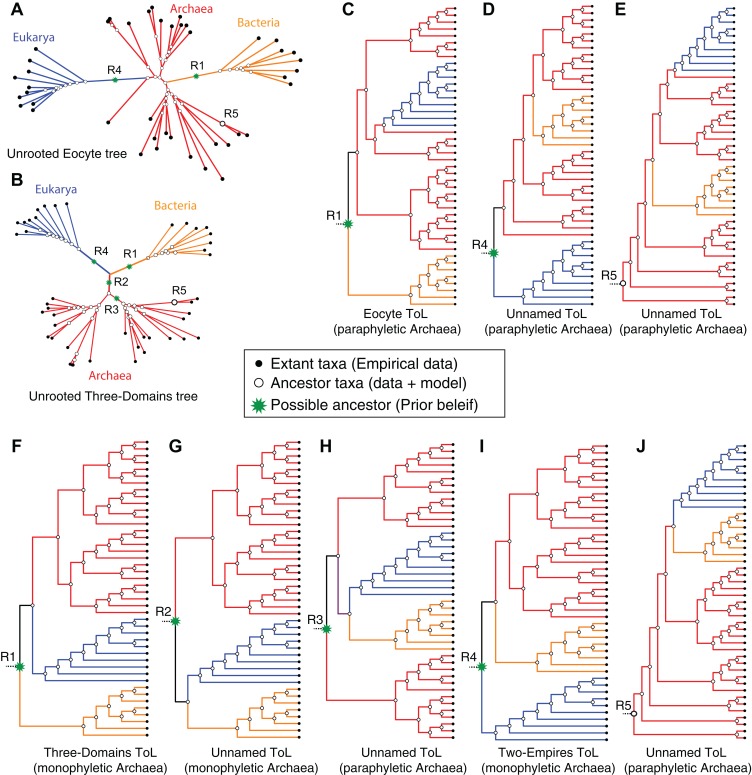
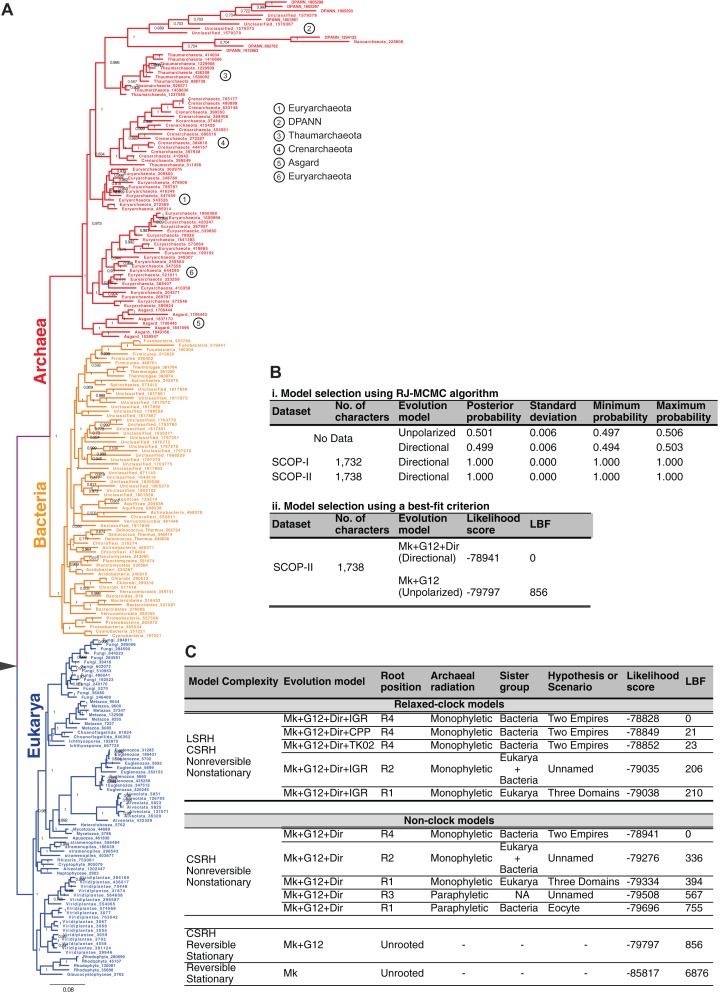
The recognition of the group Archaea as a major branch of the tree of life (ToL) prompted a new view of the evolution of biodiversity. The genomic representation of archaeal biodiversity has since significantly increased. In addition, advances in phylogenetic modeling of multi-locus datasets have resolved many recalcitrant branches of the ToL. Despite the technical advances and an expanded taxonomic representation, two important aspects of the origins and evolution of the Archaea remain controversial, even as we celebrate the 40th anniversary of the monumental discovery. These issues concern (i) the uniqueness (monophyly) of the Archaea, and (ii) the evolutionary relationships of the Archaea to the Bacteria and the Eukarya; both of these are relevant to the deep structure of the ToL. To explore the causes for this persistent ambiguity, I examine multiple datasets and different phylogenetic approaches that support contradicting conclusions. I find that the uncertainty is primarily due to a scarcity of information in standard datasets-universal core-genes datasets-to reliably resolve the conflicts. These conflicts can be resolved efficiently by comparing patterns of variation in the distribution of functional genomic signatures, which are less diffused unlike patterns of primary sequence variation. Relatively lower heterogeneity in distribution patterns minimizes uncertainties and supports statistically robust phylogenetic inferences, especially of the earliest divergences of life. This case study further highlights the limitations of primary sequence data in resolving difficult phylogenetic problems, and raises questions about evolutionary inferences drawn from the analyses of sequence alignments of a small set of core genes. In particular, the findings of this study corroborate the growing consensus that reversible substitution mutations may not be optimal phylogenetic markers for resolving early divergences in the ToL, nor for determining the polarity of evolutionary transitions across the ToL.

Keywords: Archaea; Asgard; Chimeric genome; Clade; Directional evolution; Genome fusion; Non-stationary; Phylogenomics; Rooting; Tree of life.


Conflict of interest statement

The authors declare that they have no competing interests.

Figures

Figure 1
Figure 1. Data-display networks (DDN) depicting the character conflicts in datasets that employ different character types: nucleotides or amino acids, to resolve the tree of life.
(A) SSU rRNA alignment of 1,462 characters. Concatenated amino acid sequence alignment of: (B) 29 genes, 8,563 characters (Core-genes-I dataset); (C) 48 genes, 9,868 characters (Core-genes-II dataset); and (D) SR4 recoded core-genes-II dataset (data simplified from 20 to four character-states). Each network is constructed from a neighbor-net analysis based on the observed genetic distance (p-distance) and displayed as an equal angle split network. Edge (branch) lengths correspond to the support for character bipartitions (splits), and reticulations in the tree correspond to character conflicts. The scale bar represents the split support for the edges. Conflicts in character partitions that are incongruent with a tree appear as reticulations in the DDN. Source of the datasets is as specified in Table 1.
Figure 2
Figure 2. Data-display networks (DDN) depicting character conflicts among complex molecular characters.
Complex characters here are genomic loci that correspond to protein-domains as opposed to elementary characters (individual nucleotides or amino acids). The presence–absence patterns of homologous protein-domains identified by the structural classification of proteins (SCOP) scheme were coded with non-arbitrary state labels to assemble a data matrix. Each network is constructed from a neighbor-net analysis based on the Hamming distance identical to p-distance in (Fig. 1) and displayed as an equal angle split network. (A) DDN of 1,732 characters sampled from 141 species, each from distinct genera (SCOP-I dataset). (B) DDN based on an updated SCOP-I data matrix to include recently described novel species of Archaea and Bacteria, totaling to 222 species and a modest increase to 1,738 characters (SCOP-II dataset). Details of the DDNs are as in Fig. 1.
Figure 3
Figure 3. Alignment uncertainty in closely related proteins due to domain recombination.
Multi-domain architecture (MDA), the N- to C-terminal sequence of the translational GTPase superfamily based on recombination of eight modular domains is shown as (A) linear sequences and (B) 3D structures. A total of 57 distinct families with varying MDAs are known, of which six canonical families are shown as a schematic in (A) and the corresponding 3D folds in (B). Amino acid sequences of only two of the eight conserved domains can be aligned with confidence for use in MSA-based phylogenomics. The length of the alignment varies from ∼200–300 amino acids depending on the sequence diversity sampled (Atkinson, 2015; Gouy, Baurain & Philippe, 2015). The EF-Tu—EF-G paralogous pair employed as pseudo-outgroups for the classical rooting of the rRNA tree is highlighted. (C) Phyletic distribution of 1,738 out the 2,000 distinct SCOP-domains sampled from 222 species used for phylogenetic analyses in the present study. About 70% of the domains are widely distributed across the sampled taxonomic diversity. (D) Comparison of the number of genomic loci represented in the different data matrices used in phylogenomic studies.
Figure 4
Figure 4. Comparison of the sensitivity of the tree topology to character-specific rate heterogeneity (CSRH).
(A–C) Concatenated gene trees derived from amino acid characters, and (D–F) genome trees derived from protein-domain characters. (A, B) Unrooted trees estimated using the core-genes-I dataset for which (A) rate homogeneous-LG model, or (B) a CSRH-LG substitution model was implemented. Branch support values are approximate likelihood-ratio test (aLRT) scores (C) Model-fit to data is ranked according the log likelihood ratio (LLR) scores for the tree topology. LLR scores are computed as the difference from the best-fitting model (LG+G12) of the likelihood scores estimated in PhyML. Thus, larger LLR values indicate lesser support for that model/tree, relative to the most-likely model/tree. Substitution rate heterogeneity is approximated with four, eight, or 12 rate categories in the complex models, but with a single rate category in the simpler model. (D, E) Genome trees derived from the SCOP-II datasets using (D) a rate homogeneous- or, (E) CSRH model of evolution of genomic protein-domain cohorts. Scale bars represent the estimated number of character-state changes. Branch support values are posterior probability (PP) scores estimated in MrBayes. (F) Model fit to data is ranked according log Bayes factor (LBF) scores, which like LLR scores are the log odds of the hypotheses. LBF scores are computed as the difference in likelihood scores estimated in MrBayes. Note: * Monophyly of Archaea is conditional on the placement of the root of the tree (see Fig. 5).
Figure 5
Figure 5. Impact of alternative ad hoc, a posteriori rootings on the phylogenetic classification of archaeal biodiversity.
(A, B) Unrooted trees derived from standard evolution-models are oblivious to the root and are not fully resolved into bipartitions (i.e., some braches are polytomous rather than dichotomous), and thus preclude identification of clades and sister group relationships. With multiple, independent sets of bipartitions, the Archaea are unresolved in (A), but are resolved into a distinct set of bipartitions in (B). It is common practice to add a user-specified root node (green*) a posteriori to unrooted trees, by hand, based on prior knowledge (or belief) of the investigator. Such an a posteriori rooting is necessary to determine the recency of common ancestry as well as the temporal order of key evolutionary transitions that define evolutionary groups. Five possible (of many) rootings R1–R5 are shown (see text for description). (C–J) The different possible evolutionary relationships of the Archaea to other taxa, depending on the position of the root, are shown. Both the Eocyte ToL (A) and the three-domains ToL (F) depend on the notion that the root should be placed at position R1 in the unrooted tree. (I) Two-empires ToL based on the root placed at position R4. (D, E, G, H, and J) arbitrarily rooted ToL.
Figure 6
Figure 6. Global tree of life depicting the evolutionary relationships of the major taxa of life.
(A) Phylogeny of the major taxa Archaea, Bacteria, and Eukarya inferred from patterns of inheritance of functional genomic signatures. Monophyly of each major taxon and placement of Archaea sister to Bacteria supports a dichotomous classification of the diversity of life such that Archaea and Bacteria together constitute a clade of akaryotes (or Akarya). Eukarya and Akarya are sister-clades that diverge from the universal common ancestor (UCA) at the root of the tree of life. Each clade is supported by the highest posterior probability of 1.0. The phylogeny supports a scenario of independent origins and descent of eukaryote and akaryote species. (B) Model selection tests identify, overwhelmingly, directional evolution-models to be better-fitting models to describe the evolution of genomic signatures. (C) The estimated phylogeny, especially the placement of the root is robust to both CSRH and LSRH. Alternative hypotheses, and accordingly alternative classifications or scenarios for the origins of the major clades of life, are much less probable and not supported.

Similar articles

Cited by

References

    1. Anantharaman K, Brown CT, Hug LA, Sharon I, Castelle CJ, Probst AJ, Thomas BC, Singh A, Wilkins MJ, Karaoz U, Brodie EL, Williams KH, Hubbard SS, Banfield JF. Thousands of microbial genomes shed light on interconnected biogeochemical processes in an aquifer system. Nature Communications. 2016;7:13219. doi: 10.1038/ncomms13219. - DOI - PMC - PubMed
    1. Andreeva A, Howorth D, Chothia C, Kulesha E, Murzin AG. SCOP2 prototype: a new approach to protein structure mining. Nucleic Acids Research. 2014;42(D1):D310–D314. doi: 10.1093/nar/gkt1242. - DOI - PMC - PubMed
    1. Arenas M. Trends in substitution models of molecular evolution. Frontiers in Genetics. 2015;6:319. doi: 10.3389/fgene.2015.00319. - DOI - PMC - PubMed
    1. Atkinson GC. The evolutionary and functional diversity of classical and lesser-known cytoplasmic and organellar translational GTPases across the tree of life. BMC Genomics. 2015;16(1):78. doi: 10.1186/s12864-015-1289-7. - DOI - PMC - PubMed
    1. Avise JC, Robinson TJ. Hemiplasy: a new term in the lexicon of phylogenetics. Systematic Biology. 2008;57(3):503–507. doi: 10.1080/10635150802164587. - DOI - PubMed

LinkOut - more resources