. 2018 Oct 1;18(11):16.
doi: 10.1167/18.11.16.

Saccadic momentum and attentive control in V4 neurons during visual search

Affiliations

Saccadic momentum and attentive control in V4 neurons during visual search

Brad C Motter. J Vis. .

Abstract

Saccadic momentum refers to the increased probability of making a saccade in a forward direction relative to the previous saccade. During visual search and free viewing conditions saccadic probability falls in a gradient from forward to backward directions. It has been considered to reflect an oculomotor bias for a continuing motor plan. Here we report that a saccadic momentum gradient is observed in nonhuman primate behavior and in the visual responses of cortical area V4 neurons during a conjunction style visual search task. This result suggests that saccadic momentum arises in part from a biased spatial distribution of visual responses to stimuli. The effect is independent of feature-based selective attention and overridden by directed spatial attention. The implications of saccadic momentum for search guidance are much broader and robust than the inhibition-of-return's presumed role in preventing refixation of recent locations.


Figures
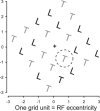
Figure 1
Figure 1
Search array construction. The eccentricity of the receptive field (dashed circle) center and its location with respect to the point of fixation defined the grid spacing (interstimulus distance) and overall orientation of the stimulus array. Stimulus shape, size, orientation, and color varied based on the neurons' tuning preferences. Two shapes and two colors were chosen to configure four stimuli for the conjunction style search task; each trial contained a target and two sets of distracters. Trials began with fixation on a small fixation target (plus) on an otherwise blank screen. Once fixation was established the small target was replaced with a replica of the trial's target stimulus. After 300–500 ms, the cueing replica was removed and the array was simultaneously presented without any stimulus at the center location. As search for the target progressed, each fixation resulted in a stimulus appearing in the RF except for fixations that placed the RF outside of the array, or at its center.
Figure 2
Figure 2
What is saccadic momentum for a neuron? Arrowed lines portray saccades. (A) Saccadic momentum states that a subsequent forward saccade to a location in the lower oval is more likely than a backward saccade to a location in the upper oval. A neural sensory correlate of saccadic momentum can be defined as a difference in the responses to identical stimuli located in the upper versus lower oval at the end of the first saccade. (B) Circles portray receptive fields (RF). Instead of simultaneously recording neurons with RFs at all grid locations marked by the dots in (A), the evidence for saccadic momentum is derived from repeated measures from a single neuron. The direction of saccadic momentum for a single neuron (a single RF) is derived from a consideration of the angle between each saccade vector and the neuron's RF vector. The RF vector is represented as the line between the RF center and the fovea (the fixation point). A saccade from F1 to F2 with the accompanying shift of the RF from P1 to P2 results in a large angle indicated by α. Whereas a saccade from F3 to F4 with the accompanying shift of the RF from P3 to P4, results in a small angle indicated by β. In this manner, although there is only one RF location, an entire range of saccade angles can be associated with the response to an item appearing in that RF. (C) The different angles with respect to the saccade away from the current fixation at F0 can be classified based on whether the RF leads the saccade, trails behind the saccade, or is displaced sideways.
Figure 3
Figure 3
Saccadic momentum. (A) Relative saccade directions for midtrial saccade pairs for each subject. Polar plot shows percentage of observed counts for saccade angles binned in 45° increments centered on major axes. Gray radial circles in A and B indicate 10% and 20% of total count levels, respectively. (B) Percentage of expected counts for possible saccade angles. Possible angles are based on the vector of the prior saccade and vectors to all other array item locations. (C) Saccadic momentum expressed as ratio of observed / expected. Ratios greater than 1.0 (inner dashed gray circle in C) indicate increased probability of occurrence, those less than 1.0 indicate decreased probability. Outer dashed gray circle in C represents a 2.0 observed / expected ratio. Magenta line for subject A; blue line for subject B.
Figure 4
Figure 4
Saccadic momentum in control array series. (A) Search array of 48 items, with 50/50 distribution of distracter types. Items randomly placed in 27.2° × 20.4° display area with only a nonoverlap constraint. Same trial procedure as main experiment. (B) The observed relative saccade directions measured as the angle between consecutive midtrial saccades for search through the full array shown in (A). (C) Expected relative saccade direction count distribution for the full array. (D) The observed / expected ratio for search in the large array, showing saccadic momentum favoring forward (180°) direction over backward (0°) direction. (E) Observed and (F) Expected relative saccade direction distributions when the fixation between saccades was restricted to occur in an 8° × 8° area in the upper right of the array (dashed square). (G) Despite asymmetries induced by nearby boundaries the observed/expected ratio still strongly favors forward saccade momentum. (H) Observed and (I) Expected relative saccade direction distributions when only saccade amplitudes less than 6.5° are considered. This analysis approximates search in a “local” area. (J) The observed / expected ratio for search restricted to small saccades. Dashed gray circles indicate values of 1, 2, or 3 for o/e ratios. Magenta line for subject A; blue line for subject B.
Figure 5
Figure 5
Saccade momentum gradients for fixation duration. The fixation duration between, as well as the angle formed by, consecutive midtrial saccades were measured. (A) Fixation duration as a function of saccade angle for outgoing saccades less than 6.5° (red) in amplitude and saccades greater than 6.5° (blue) for subject A in the regular grid experiment. (B) Same for subject B. (C) and (D) Same measurements but for the control array experiments. In all cases the shorter saccades show a monotonic increase in fixation duration from forward to backward saccades, a possible correlate of saccadic momentum. The longer saccades do not show a similar consistent correlate. The separated rightmost points at 0.0 are the fixation durations for the specific O-IOR events, also sorted by saccade length. There is no consistent increase in fixation duration increment for the short saccade group. The longer saccades appear to have an increment in duration, but its meaning in relation to the overall gradient is not clear. Note the difference in fixation durations between the two tasks, A and B versus C and D in the same subjects. The standard error bars are often hidden behind symbols.
Figure 6
Figure 6
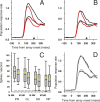
Response to array Onset. (A) Response histograms for PR stimulus (upper pair) and SH stimulus (lower pair). For each pair the black line represents the response when the stimulus matched the color of the trial's target and the red line when it did not. Small upward triangle along baseline indicates average saccade latency following array onset. Short vertical tics along baseline (at 50 and 250) mark the time window used to measure the response activity. (B) Same for histograms of CL stimulus (upper pair) and NP stimulus (lower pair). (C) Box plots of raw spikes/s activity for each stimulus and for each attentive (color matching) condition. Notes: M = matching; NM – non-matching. Yellow bar within the 25th–75th percentiles box is the mean; black, the median response. Whiskers are the 10th and 90th percentile response rate limits. (D) Response histogram to array onset when next saccade is away from receptive field stimulus (black); response when next saccade is onto the receptive field stimulus (gray). Upper pair for the preferred (PR) stimulus, lower pair for SH stimulus.
Figure 7
Figure 7
Response to stimulus during midtrial fixations. (A–D) Peri-event response histograms for each stimulus type, synchronized to the onset of the midtrial fixation at time zero. Black lines represent response to the RF stimulus when it matches the color of the target; red lines when the stimulus does not match the target's color, and cyan lines for the blank condition where there is no stimulus in the RF. Gray dashed line is response to target color-matching stimulus at array onset (from Figure 6). The two short vertical tics along baseline mark the analysis window. (E) Comparisons of response rates for Onset versus midtrial, broken down according to the target color-matching condition for each stimulus type. (F) A nearly constant 75% ratio of midtrial responses to onset responses as a function of both match condition and stimulus type. (G) Feature attentive selection advantage for color matching is comparable for Onset and midtrial conditions.
Figure 8
Figure 8
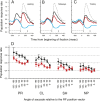
Neural correlates of saccadic momentum. (A) Peri-event response histogram when the PR stimulus appeared in the RF as a result of a leading direction (LD) saccade. Note the amplitude and breadth of the response in comparison to B and C. (B) Response histogram when stimulus appeared in RF as result of a sideways direction (SD) saccade. (C) Response histogram when stimulus appeared in RF as result of a trailing direction (TR) saccade. Lines in (A–C) represent conditions as in Figure 7; matching (black), nonmatching (red), and blank (cyan) conditions. (D) Population responses to the four stimulus types appearing in RF; in 30° increments of the angle between the saccade vector and the line between the fovea and RF center. Response means and standard errors for feature attentive conditions corresponding to target color-matching conditions (black) and nonmatching conditions (red).
Figure 9
Figure 9
Neural correlates of spatially directed attention. (A) Peri-event response histogram showing response to target color-matching distracter in receptive field when next saccade goes to it (magenta) versus away from it (black). Population response based on 54 neurons. (B) Response histograms showing subdivision of blue response in A, into leading (black), sideways (blue), and trailing (cyan) directional groups. Responses are based on different numbers of neurons as indicated due to limitations in availability of different combinations of stimulus and saccade events. (C) Response histograms for target color-matching (black) and nonmatching (red) stimulus conditions when the next saccade was to the RF stimulus, for a subset of 10 neurons. (D) Response histograms to the actual trial target in the RF when the next saccade was to the target (black) and when the next saccade was away from the target (green). A reduced data criterion was used to include neurons for D, as explained in main results section. For A–D the gray dashed line represents response to target color matching distracter at array onset. (E, F). Mean population responses to the four stimulus types in various conditions detailed in the inset legends and main text. Onset refers to array onset response. Onto refers to condition where next saccade goes to stimulus in the RF. Away refers to condition where next saccade goes away from the stimulus in the RF. Notes: dist = distracter; m = matching; nm = nonmatching condition.

Similar articles

Cited by

References

    1. Bays P. M, Husain M. Active inhibition and memory promote exploration and search of natural scenes. Journal of Vision. (2012);12(8):1–18.:8. doi: 10.1167/12.8.8. PubMed Article https://doi.org/10.1167/12.8.8 PubMed ] [ PubMed ] [ Article. - DOI - PMC - PubMed
    1. Bichot N. P, Heard M.T, DeGennaro E.M, Desimone R. A source for feature-based attention in the prefrontal cortex. Neuron. (2015);88:832–844. - PMC - PubMed
    1. Bichot N. P, Rossi A. F, Desimone R. Parallel and serial neural mechanisms for visual search in macaque area V4. Science. (2005, April 22);308:529–534. - PubMed
    1. Bichot N. P, Schall J. D. Priming in macaque frontal cortex during popout visual search: Feature-based facilitation and location-based inhibition of return. Journal of Neuroscience. (2002);22:4675–4685. - PMC - PubMed
    1. Blatt G. J, Andersen R. A, Stoner G. R. Visual receptive field organization and cortico-cortical connections of the lateral intraparietal (area LIP) in the macaque. Journal of Comparative Neurology. (1990);299:421–445. doi: 10.1002/cne.902990404. - DOI - PubMed

Publication types