. 2019 Jan;52(1):e12523.
doi: 10.1111/cpr.12523. Epub 2018 Oct 25.

The spatiotemporal expression and mineralization regulation of p75 neurotrophin receptor in the early tooth development

Affiliations

The spatiotemporal expression and mineralization regulation of p75 neurotrophin receptor in the early tooth development

Manzhu Zhao et al. Cell Prolif. 2019 Jan.

Erratum in

  • Corrigendum.
    [No authors listed] [No authors listed] Cell Prolif. 2022 Feb;55(2):e13171. doi: 10.1111/cpr.13171. Cell Prolif. 2022. PMID: 35139251 Free PMC article. No abstract available.

Abstract

Objective: The aim of this study was to investigate the spatiotemporal expression and potential role of p75NTR in tooth morphogenesis and tissue mineralization.

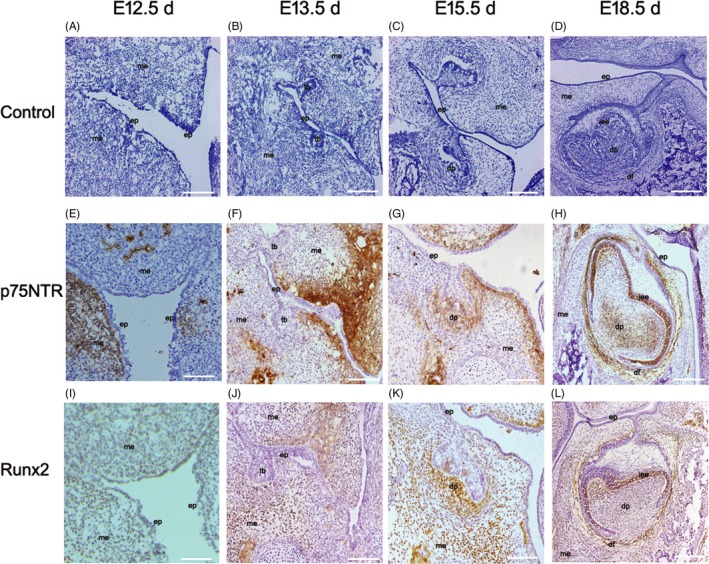
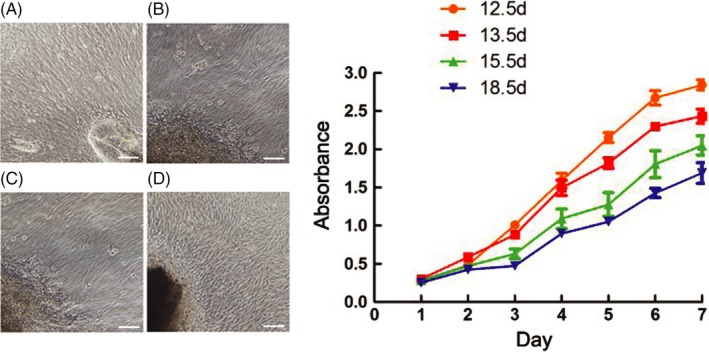
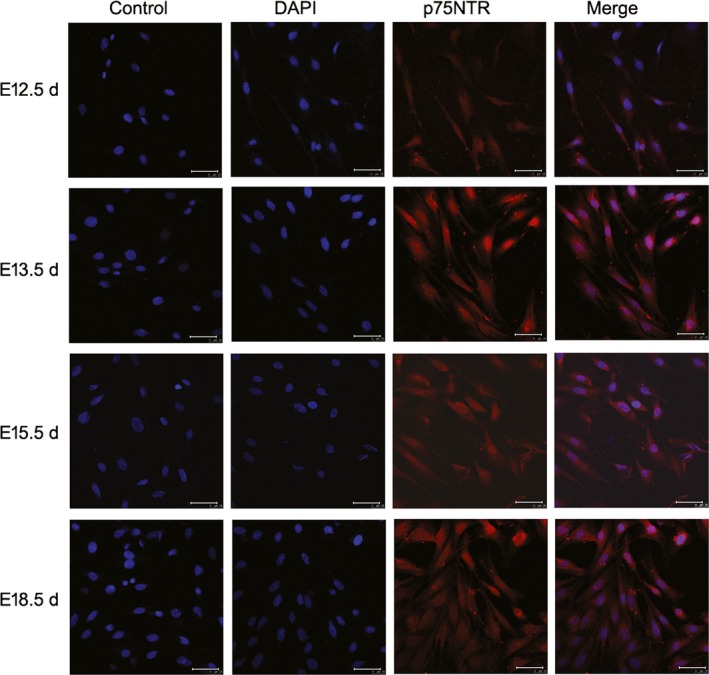
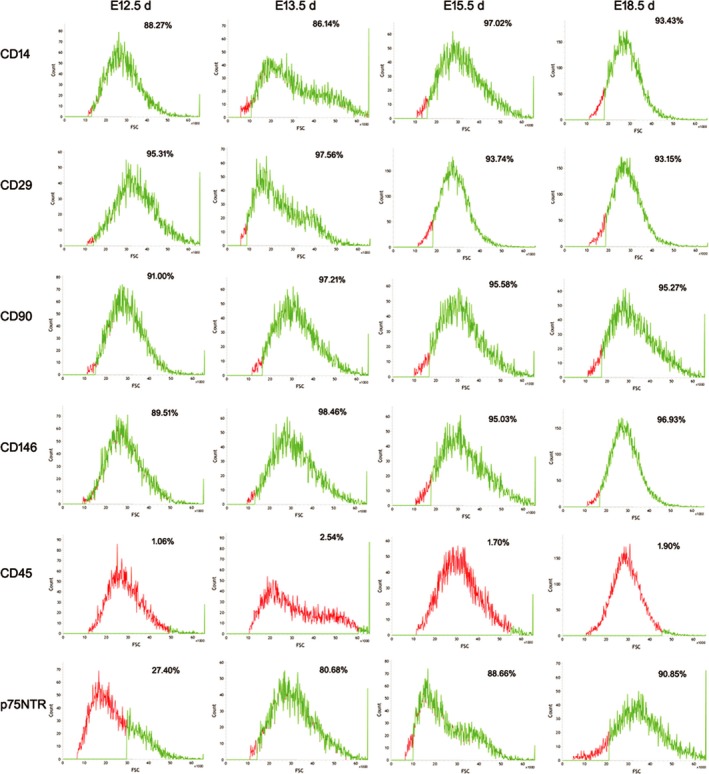
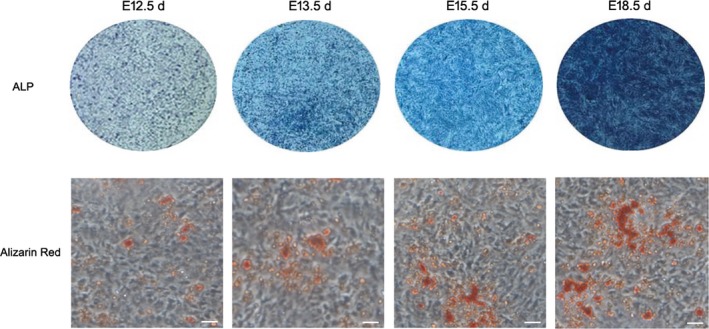
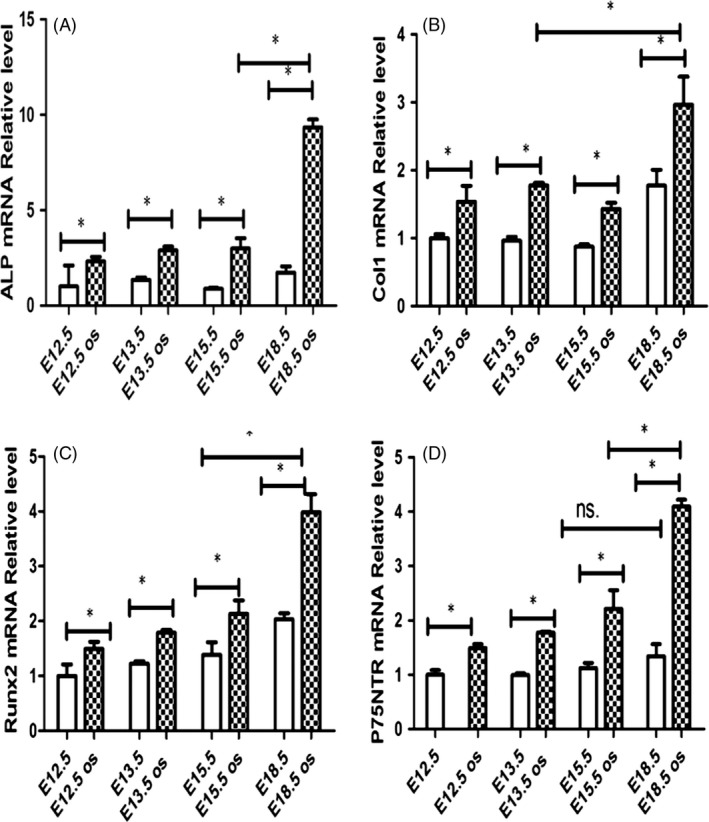
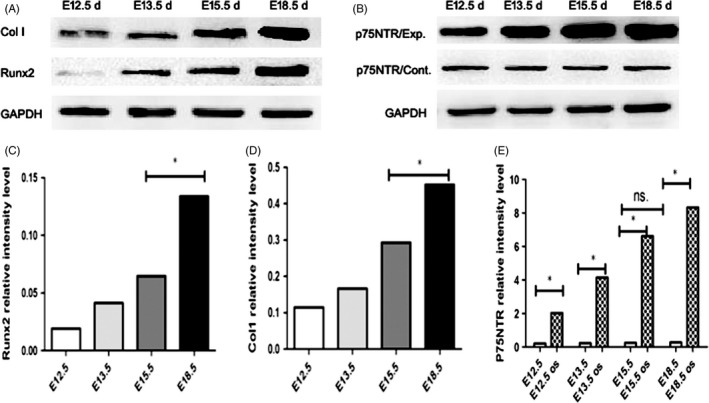
Materials and methods: The dynamic morphology of the four stages (from the beginning of E12.5 d, then E13.5 d and E15.5 d, to the end of E18.5 d) was observed, and the expressions of p75NTR and Runx2 were traced. The ectomesenchymal stem cells (EMSCs) were harvested in vitro, and the biological characteristics were observed. Moreover, the mineralization capability of EMSCs was evaluated. The relations between p75NTR and ALP, Col-1 and Runx2 were investigated.

Results: The morphologic results showed that the dental lamina appeared at E12.5 d, the bud stage at E13.5 d, the cap stage at E15.5 d and the bell stage at E18.5 d. p75NTR and Runx2 showed the similar expression pattern. EMSCs from the four stages showed no significant difference in proliferation. But the positive rate of p75NTR in the E12.5 d cells was significantly lower than that in the other three stages (P < 0.05). Moreover, the higher positive rate of p75NTR the cells were, the stronger mineralization capability they showed. p75NTR was well positively correlated with the mineralization-related markers ALP, Col-1 and Runx2, which increased gradually with the mature of dental germs.

Conclusion: p75NTR might play an important role in the regulation of tooth morphogenesis, especially dental hard tissue formation.

Keywords: ectomesenchymal stem cells; epithelial; mesenchymal interaction; mineralization; p75 neurotrophin receptor; tooth morphogenesis.


Conflict of interest statement

The authors declare that they have no competing interests.

Figures

Figure 1
Figure 1
The results of HE staining (A‐D) and immunohistochemistry staining (E‐L). The rat original oral epithelium(ep) invaginated to form dental lamina at E12.5 d (A). The dental germs turned up and entered the bud stage at E13.5 d, the cap stage at E15.5 d and the bell stage at E18.5 d (B‐D). p75NTR immunoreactivity was little expressed at E12.5 d in some subjacent mesenchyme area under the oral pit epithelium (E). p75NTR immunoreactivity was enhanced at E13.5 d, but not detected around the tooth buds(tb) (F). At the cap stage, p75NTR began to express in the mesenchyme(me) of dental papilla(dp), liking that p75NTR‐positive ectomesenchymal cells migrate to dental papilla from the oral pit (G). At the bell stage (H), the p75NTR expression became weak in dental papilla and strong in dental follicle(df), but firstly expressed in the inner enamel epithelium(iee). Runx2 was hardly detected at E12.5 d (I) and became weakly positive in the mesenchyme around the tooth buds at E13.5 d (J). It was positive in mesenchyme area and became significantly enhanced under epithelial–mesenchymal interaction of the tooth germs at E15.5 d, but not positive in the mesenchyme area under the oral pit epithelium (K). At the bell stage of E18.5 d, Runx2 was positive in the inner enamel epithelium and dental follicle area but little in the dental papilla (L). Scale bar represents 100 μm
Figure 2
Figure 2
The cell culture and proliferation assay in vitro. All the cells exhibited a fibroblast‐like morphology, and no difference was observed between the cells from different tooth development stages (A‐D). The CCK‐8 assay showed that the cell proliferation capacity decreased during the development proceeding (E). But there was also no significant difference (P > 0.05). Scale bar represents 100 μm
Figure 3
Figure 3
The confocal laser scanning microscopy results showed that p75NTR was detected at different levels in the cells from the four tooth development stages. p75NTR was weakly expressed in the cells of E12.5 d, whereas it was significantly enhanced in the cells of E13.5 d, E15.5 d and E18.5 d. Scale bar represents 50 μm
Figure 4
Figure 4
This results of the following flow cytometry detection showed that the mesenchymal stem cell surface markers CD14, CD29, CD90 and CD146 were highly expressed, while the hemopoietic stem cell surface marker CD45 was little expressed in the cells of the four tooth development stages. p75NTR was lowly expressed at E12.5 d, but significantly increased at E13.5 d and stably expressed at a high level during the 13.5 d‐18.5 d
Figure 5
Figure 5
The results of Alkaline phosphatase staining and alizarin red staining. The colour of EMSCs in ALP assay was gradually deeper with the increase in development days and becomes the deepest at E18.5 d after a 7‐day mineralized induction. The alizarin red staining also showed that there were more and bigger mineralized nodules in the E18.5 d and E15.5 d EMSCs than that in the E13.5 d and E12.5 d EMSCs after a 21‐day mineralized induction. Scale bar represents 50 μm
Figure 6
Figure 6
The RT‐PCR assay showed that p75NTR mRNA was on the slight increase with the mature of dental germs in the four control groups, but no significant difference between them (P > 0.05). After mineralization induction, p75NTR mRNA in all the experimental groups was significantly increased in comparison with each control group (P < 0.05), especially for the E18.5 d EMSC groups in which the increase was the highest (D).The mineralization‐related markers ALP, Col‐1 and Runx2 mRNA showed the similar changes to p75NTR (A‐C). They changed slightly in the four control groups, while significantly increased after mineralization induction. Moreover, all the three markers were detected to be highest in the E18.5 d EMSC groups (*P < 0.05, ns.=no significant difference)
Figure 7
Figure 7
Western blot assay showed that the expressions of Col‐1 and Runx2 increased gradually with the mature of dental germs (A, C, D). p75NTR was on the slight increase with the mature of dental germs and significantly increased after mineralization induction (B, E). p75NTR/Exp means p75NTR experiment group, and p75NTR/Cont means p75NTR control group (*P < 0.05, ns.=no significant difference)

Similar articles

Cited by

References

    1. Moscatelli I, Pierantozzi E, Camaioni A, Siracusa G, Campagnolo L. p75 neurotrophin receptor is involved in proliferation of undifferentiated mouse embryonic stem cells. Exp Cell Res. 2009;315(18):3220‐3232. - PubMed
    1. Crane JF, Trainor PA. Neural crest stem and progenitor cells. Annu Rev Cell Dev Biol. 2006;22:267‐286. - PubMed
    1. Charalampopoulos I, Vicario A, Pediaditakis I, Gravanis A, Simi A, Ibáñez CF. Genetic dissection of neurotrophin signaling through the p75 neurotrophin receptor. Cell Rep. 2012;2(6):1563‐1570. - PubMed
    1. Truzzi F, Marconi A, Atzei P et al. p75 neurotrophin receptor mediates apoptosis in transit‐amplifying cells and its overexpression restores cell death in psoriatic keratinocytes. Cell Death Differ. 2011;18(6):948‐958. - PMC - PubMed
    1. Gentry JJ, Barker PA, Carter BD. The p75 neurotrophin receptor: multiple interactors and numerous functions. Prog Brain Res. 2004;146:25‐39. - PubMed

MeSH terms