

Associations Among Dietary Fat Oxidation Responses to Overfeeding and Weight Gain in Obesity-Prone and Resistant Adults
- PMID: 30358145
- PMCID: PMC6214358
- DOI: 10.1002/oby.22321
Associations Among Dietary Fat Oxidation Responses to Overfeeding and Weight Gain in Obesity-Prone and Resistant Adults
Abstract
Objective: This study tested the hypothesis that 3 days of overfeeding (OF) decreases dietary fat oxidation and predicts longitudinal weight change in adults classified as obesity prone (OP) and obesity resistant (OR) based on self-identification and personal and family weight history. Changes in diurnal profiles of plasma metabolites and hormones were measured to probe mechanisms.
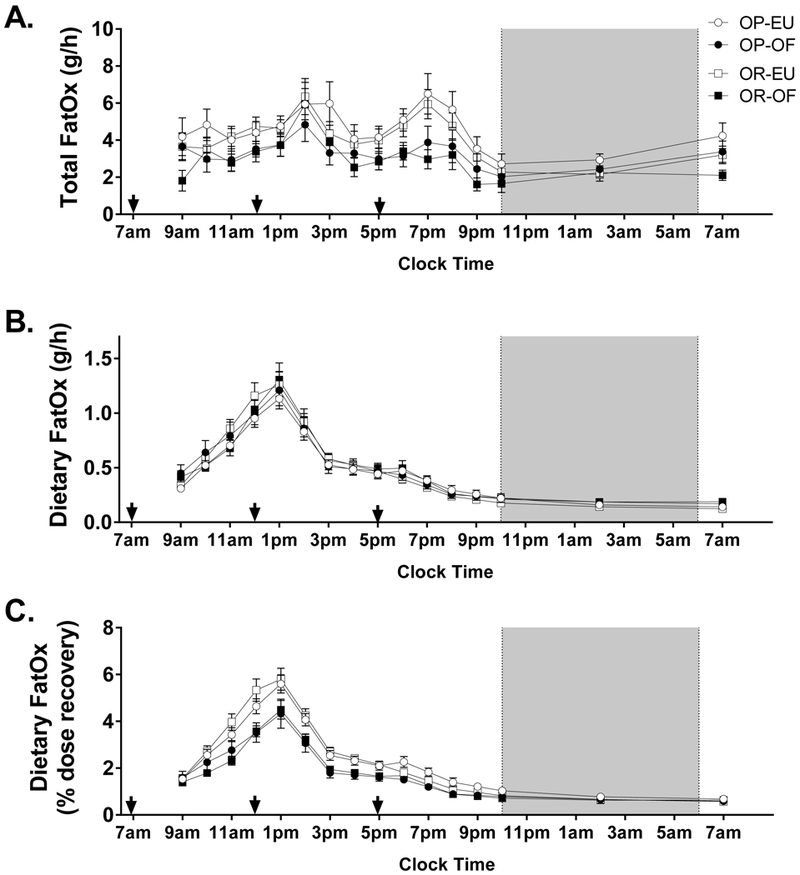
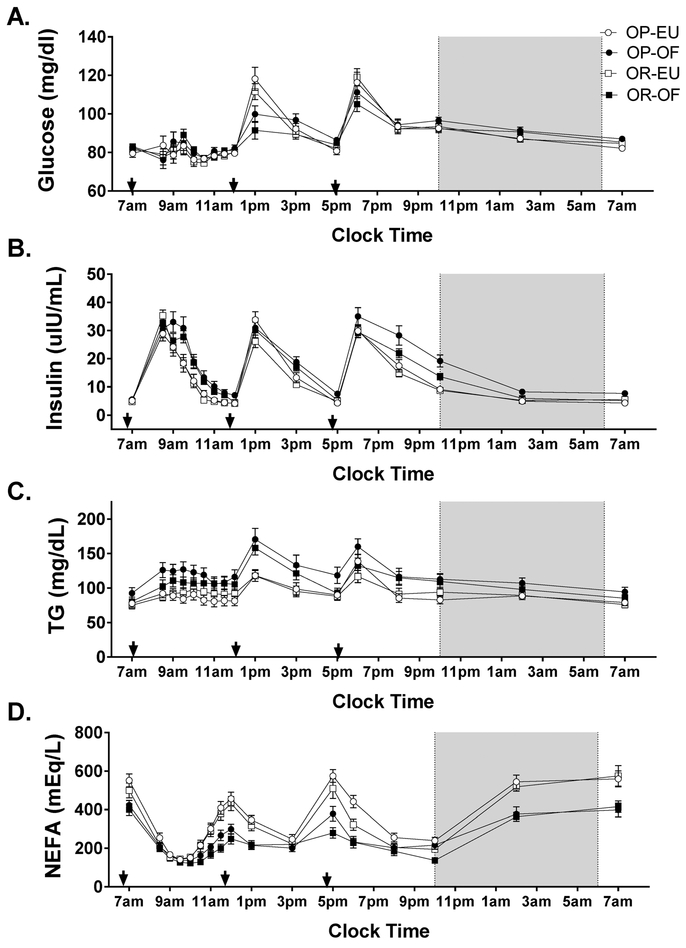
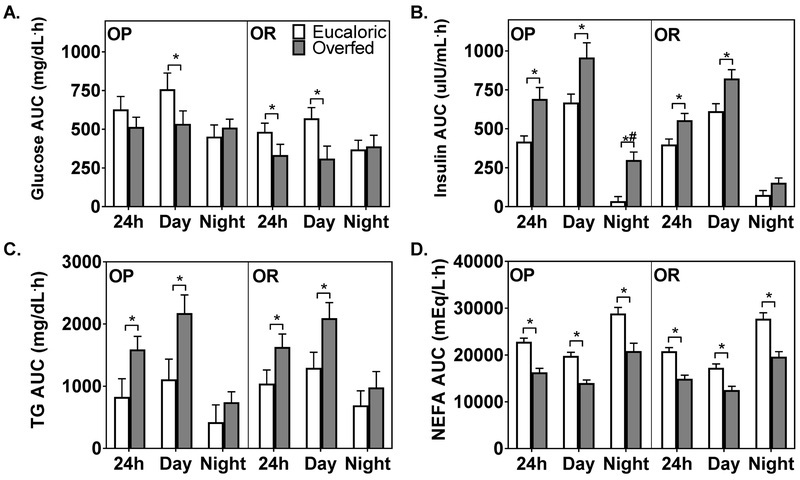
Methods: Adults identified as OP (n = 22; BMI: 23.9 ± 2.4 kg/m2 ) and OR (n = 30; BMI: 20.5 ± 2.2 kg/m2 ) completed 3 days of eucaloric (EU) feeding and 3 days of OF. On day 3, the 24-hour total and dietary fat oxidation was measured using room calorimetry and an oral 14 C tracer. Plasma glucose, insulin, triglycerides, and nonesterified fatty acid (NEFA) concentrations were frequently sampled over 24 hours. Body composition was measured annually for 4.0 ± 1.4 years in a subsample (n = 19 OP and 23 OR).
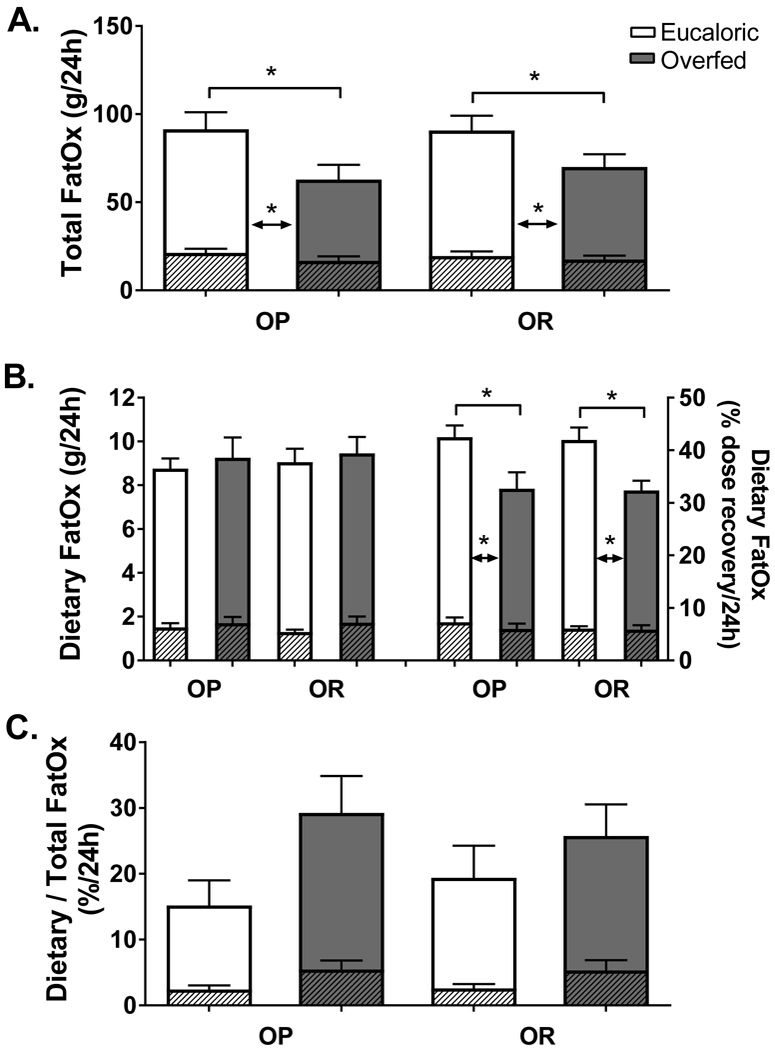
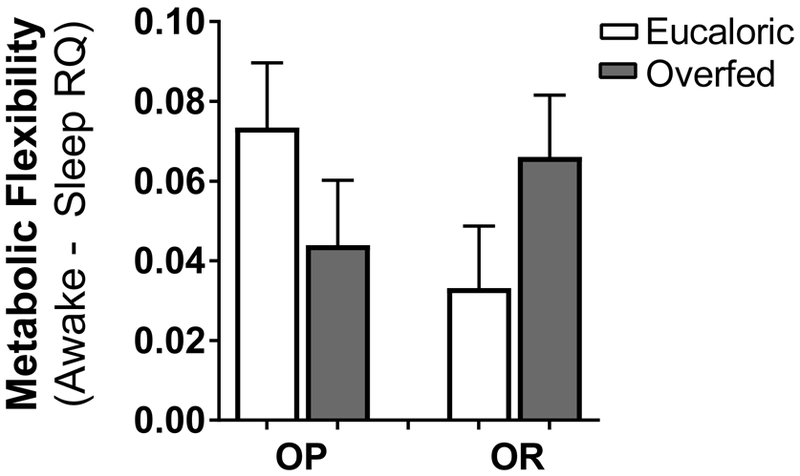
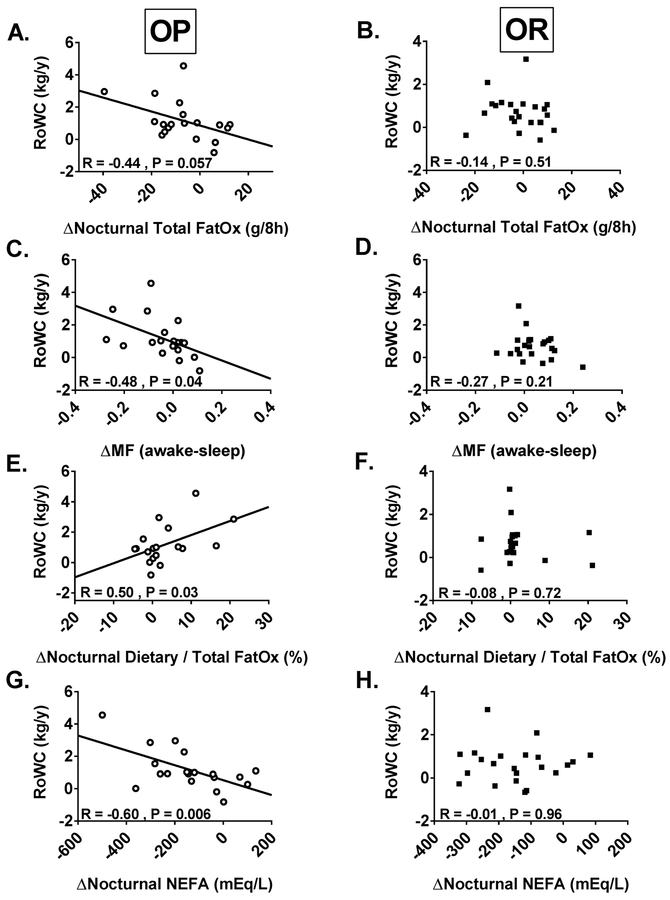
Results: Dietary fat oxidation over 24 hours was not altered by OF versus EU (P = 0.54). Weight gain in OP correlated with lower nocturnal NEFA concentrations during OF (r = -0.60; P = 0.006) and impaired fuel selection over 24 hours (metabolic inflexibility, wake respiratory quotient-sleep respiratory quotient) (r = -0.48; P = 0.04).
Conclusions: Short-term OF did not alter dietary fat oxidation. Lower nocturnal NEFA availability and metabolic inflexibility to overfeeding may be factors contributing to weight gain.
Trial registration: ClinicalTrials.gov NCT00072917.
© 2018 The Obesity Society.
Conflict of interest statement
Figures
Similar articles
-
Ability to adjust nocturnal fat oxidation in response to overfeeding predicts 5-year weight gain in adults.Obesity (Silver Spring). 2017 May;25(5):873-880. doi: 10.1002/oby.21807. Obesity (Silver Spring). 2017. PMID: 28440048 Free PMC article.
-
The effects of short-term overfeeding on energy expenditure and nutrient oxidation in obesity-prone and obesity-resistant individuals.Int J Obes (Lond). 2013 Sep;37(9):1192-7. doi: 10.1038/ijo.2012.202. Epub 2012 Dec 11. Int J Obes (Lond). 2013. PMID: 23229737 Free PMC article.
-
Free-Living Responses in Energy Balance to Short-Term Overfeeding in Adults Differing in Propensity for Obesity.Obesity (Silver Spring). 2018 Apr;26(4):696-702. doi: 10.1002/oby.22121. Obesity (Silver Spring). 2018. PMID: 29570248 Free PMC article.
-
Effect of dietary fatty acid composition on substrate utilization and body weight maintenance in humans.Eur J Nutr. 2014 Apr;53(3):691-710. doi: 10.1007/s00394-013-0638-z. Epub 2013 Dec 22. Eur J Nutr. 2014. PMID: 24363161 Review.
-
Routes to obesity: phenotypes, food choices and activity.Br J Nutr. 2000 Mar;83 Suppl 1:S33-8. doi: 10.1017/s0007114500000933. Br J Nutr. 2000. PMID: 10889790 Review.
Cited by
-
Association Between Adipose Tissue Characteristics and Metabolic Flexibility in Humans: A Systematic Review.Front Nutr. 2021 Dec 3;8:744187. doi: 10.3389/fnut.2021.744187. eCollection 2021. Front Nutr. 2021. PMID: 34926544 Free PMC article.
-
Appetite-Related Responses to Overfeeding and Longitudinal Weight Change in Obesity-Prone and Obesity-Resistant Adults.Obesity (Silver Spring). 2020 Feb;28(2):259-267. doi: 10.1002/oby.22687. Obesity (Silver Spring). 2020. PMID: 31970906 Free PMC article.
-
Circadian Rhythm of Substrate Oxidation and Hormonal Regulators of Energy Balance.Obesity (Silver Spring). 2020 Jul;28 Suppl 1(Suppl 1):S104-S113. doi: 10.1002/oby.22816. Epub 2020 May 28. Obesity (Silver Spring). 2020. PMID: 32463976 Free PMC article.
-
Metabolic Factors Determining the Susceptibility to Weight Gain: Current Evidence.Curr Obes Rep. 2020 Jun;9(2):121-135. doi: 10.1007/s13679-020-00371-4. Curr Obes Rep. 2020. PMID: 32248352 Free PMC article. Review.
-
The role of physical activity in the regulation of body weight: The overlooked contribution of light physical activity and sedentary behaviors.Obes Rev. 2023 Feb;24(2):e13528. doi: 10.1111/obr.13528. Epub 2022 Nov 16. Obes Rev. 2023. PMID: 36394185 Free PMC article. Review.
References
Publication types
MeSH terms
Substances
Associated data
Grants and funding
LinkOut - more resources
Full Text Sources
Medical
Research Materials
Miscellaneous
