

BMI and Mortality in UK Biobank: Revised Estimates Using Mendelian Randomization
- PMID: 30358150
- PMCID: PMC6334168
- DOI: 10.1002/oby.22313
BMI and Mortality in UK Biobank: Revised Estimates Using Mendelian Randomization
Erratum in
-
Erratum: Obesity BMI and Mortality in UK Biobank: Revised Estimates Using Mendelian Randomization.Obesity (Silver Spring). 2019 Feb;27(2):349. doi: 10.1002/oby.22397. Epub 2019 Jan 9. Obesity (Silver Spring). 2019. PMID: 30677259 Free PMC article. No abstract available.
Abstract
Objective: The aim of this study was to obtain estimates of the causal relationship between BMI and mortality.
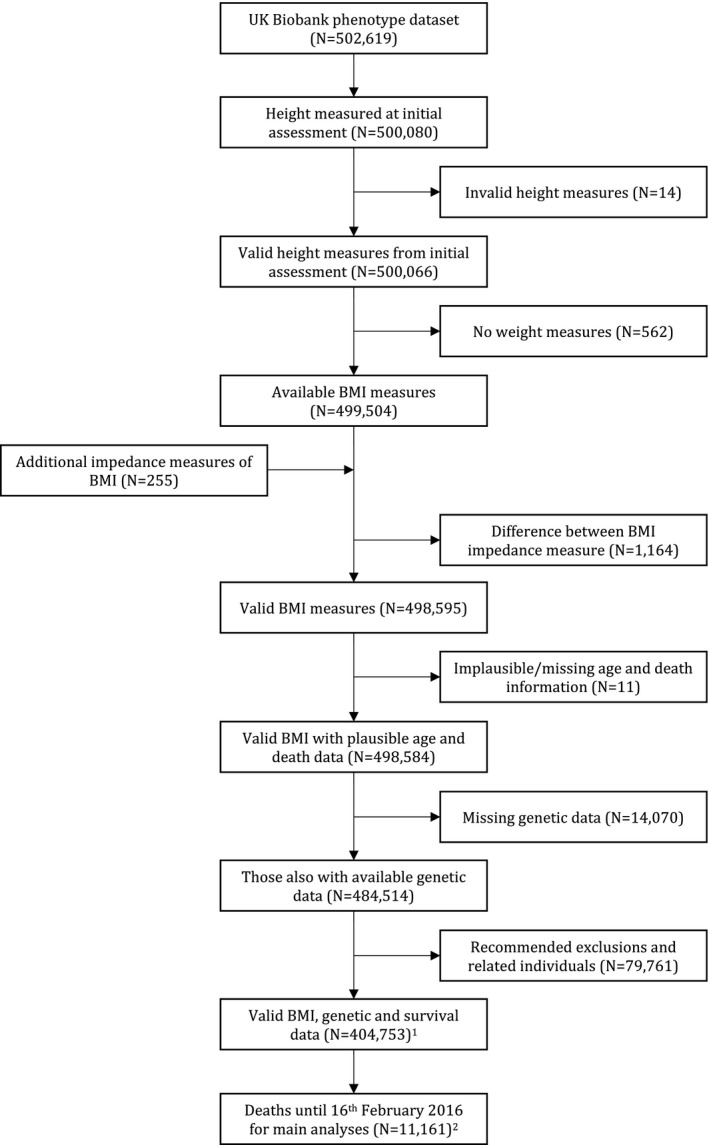
Methods: Mendelian randomization (MR) with BMI-associated genotypic variation was used to test the causal effect of BMI on all-cause and cause-specific mortality in UK Biobank participants of White British ancestry.
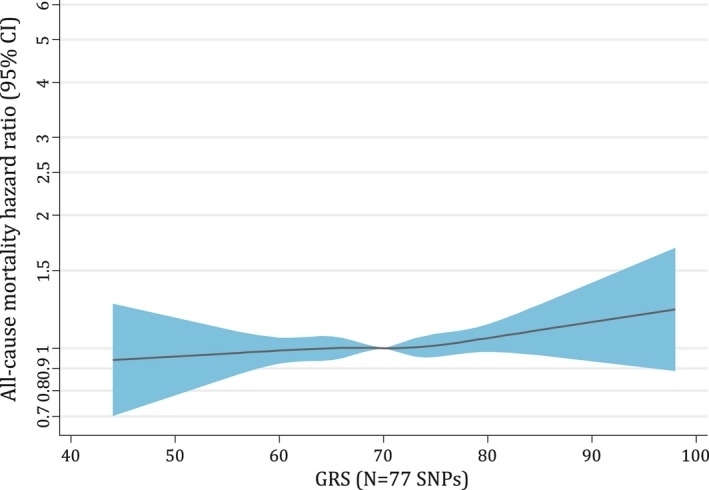
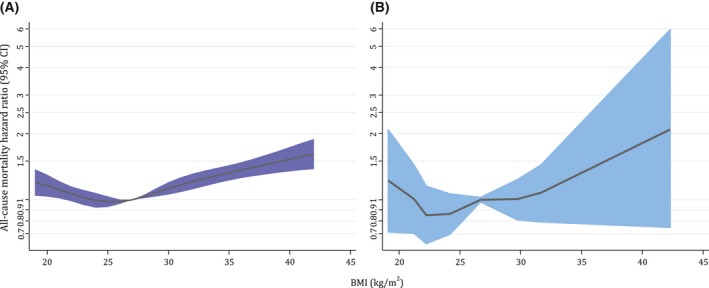
Results: MR analyses supported a causal association between higher BMI and greater risk of all-cause mortality (hazard ratio [HR] per 1 kg/m2 : 1.03; 95% CI: 0.99-1.07) and mortality from cardiovascular diseases (HR: 1.10; 95% CI: 1.01-1.19), specifically coronary heart disease (HR: 1.12; 95% CI: 1.00-1.25) and those excluding coronary heart disease/stroke/aortic aneurysm (HR: 1.24; 95% CI: 1.03-1.48), stomach cancer (HR: 1.18; 95% CI: 0.87-1.62), and esophageal cancer (HR: 1.22; 95% CI: 0.98-1.53), and a decreased risk of lung cancer mortality (HR: 0.96; 95% CI: 0.85-1.08). Sex stratification supported the causal role of higher BMI increasing bladder cancer mortality risk (males) but decreasing respiratory disease mortality risk (males). The J-shaped observational association between BMI and mortality was visible with MR analyses, but the BMI at which mortality was minimized was lower and the association was flatter over a larger BMI range.
Conclusions: Results support a causal role of higher BMI in increasing the risk of all-cause mortality and mortality from several specific causes.
© 2018 The Obesity Society.
Figures
References
Publication types
MeSH terms
Grants and funding
- 2013-2018/CRUK_/Cancer Research UK/United Kingdom
- C18281/CRUK_/Cancer Research UK/United Kingdom
- 3/CRUK_/Cancer Research UK/United Kingdom
- 19169/CRUK_/Cancer Research UK/United Kingdom
- MC_QA137853/MRC_/Medical Research Council/United Kingdom
- 16/WT_/Wellcome Trust/United Kingdom
- MC_UU_00011/1/MRC_/Medical Research Council/United Kingdom
- 202802/WT_/Wellcome Trust/United Kingdom
- 2018-2023/WT_/Wellcome Trust/United Kingdom
- 1-7/CRUK_/Cancer Research UK/United Kingdom
- MC_UU_12013/1/MRC_/Medical Research Council/United Kingdom
- MC_UU_12013/4/MRC_/Medical Research Council/United Kingdom
- 4/CRUK_/Cancer Research UK/United Kingdom
- MC_UU_12013/9/MRC_/Medical Research Council/United Kingdom
- 2013-2018/WT_/Wellcome Trust/United Kingdom
- MC_PC_12028/MRC_/Medical Research Council/United Kingdom
- MC_PC_17228/MRC_/Medical Research Council/United Kingdom
- 2018-2023/CRUK_/Cancer Research UK/United Kingdom
- MC_UU_12013/3/MRC_/Medical Research Council/United Kingdom
- 9/WT_/Wellcome Trust/United Kingdom
- 1-6/CRUK_/Cancer Research UK/United Kingdom
- 1/WT_/Wellcome Trust/United Kingdom
- 202802/Z/16/Z/WT_/Wellcome Trust/United Kingdom
- A19169/CRUK_/Cancer Research UK/United Kingdom
